KADİR HAS UNIVERSITY SCHOOL OF GRADUATE STUDIES
DEPARTMENT OF SOCIAL SCIENCES AND HUMANITIES
LABOR MARKET OUTCOMES OF MINIMUM WAGE INCREASES:
A CASE STUDY
ENES IŞIK
SUPERVISOR: PROF.DR. ÖZGÜR ORHANGAZİ
MASTER’S THESIS
LABOR MARKET OUTCOMES OF MINIMUM WAGE INCREASES: A
CASE STUDY
ENES IŞIK
SUPERVISOR: PROF.DR. ÖZGÜR ORHANGAZİ
MASTER’S THESIS
Submitted to the School of Graduate Studies of Kadir Has University in partial fulfillment of the requirements for the degree of Master’s in the Discipline Area of Economics under the Program of Economics.
TABLE OF CONTENTS
ABSTRACT . . . i ¨ OZET . . . ii ACKNOWLEDGEMENTS . . . iii LIST OF SYMBOLS/ABBREVIATIONS . . . iv 1. INTRODUCTION . . . 1 2. LITERATURE REVIEW . . . 83. DATA AND DESCRIPTIVE ANALYSIS . . . 18
3.1 DATA . . . 18
3.2 IDENTIFICATION OF THE MINIMUM WAGE WORK-ERS . . . 19
3.3 PRE-EXISTING TRENDS IN LABOR MARKET OUT-COMES . . . 26
3.3.1 Wages . . . 26
3.3.2 Employment . . . 28
3.3.3 Informality . . . 32
3.4 SUMMARY . . . 34
4. EMPIRICAL APPROACH AND MODEL . . . 35
4.1 IDENTIFICATION STRATEGY . . . 35
4.2 MODEL . . . 40
4.3 FINDINGS . . . 48
4.4 ROBUSTNESS ANALYSIS . . . 52
4.4.1 Placebo Test . . . 52
4.4.2 Alternative Time Periods . . . 53
4.5 SUMMARY AND DISCUSSION . . . 54
5. CONCLUSION . . . 56
REFERENCES . . . 58
LABOR MARKET OUTCOMES OF MINIMUM WAGE INCREASES: A CASE STUDY
ABSTRACT
There is an ongoing controversy surrounding the minimum wage policy. On the one hand, proponents argue that minimum wage can support employment in the presence of a labor market monopsony; opponents, on the other hand, argue that minimum wage has adverse impact on employment outcomes. In this study, using the 33% minimum wage increase in 2016 in Turkey as a quasi-experiment and uti-lizing the regional variation in the fraction of workers a↵ected by minimum wage increases, I examine the impact of the minimum wage policy on wages,employment, and informality. I illustrate that young workers and less than high school educated workers are disproportionally represented among minimum wage workers. Armed with this finding, I show wage gains for less educated workers and no adverse im-pact on employment outcomes. I find, however, relatively large positive informality e↵ects on young workers.According to the findings presented in this study, an addi-tional 10 percent of potential minimum wage workers a↵ected by the 2016 minimum wage increase rises young workers’ informality by 12 to 17 percent.
Keywords: Minimum wage, labor market institutions, employment, un-employment
ASGAR˙I ¨UCRET ARTIS¸LARI ˙IS¸G ¨UC ¨U P˙IYASASI SONUC¸ LARINI NASIL
ETK˙ILER? B˙IR VAKA C¸ ALIS¸MASI
¨
OZET
Asgari ¨ucretin i¸sg¨uc¨u piyasasında yarattı˘gı sonu¸clar tartı¸smalıdır.Asgari ¨ucret poli-tikasını destekleyenler i¸sg¨uc¨u piyasasında tekel alıcı konumunda bulunan i¸sverenlerin yo˘gun oldu˘gu durumlarda ¨ucret tabanının istihdamı destekleyici bir etki yarattı˘gını ¨one s¨urerken asgari ¨ucrete kar¸sı ¸cıkanlar emek piyasasının rekabet¸ci olması
duru-munda ¨ucret tabanının istihdamı olumsuz etkiledi˘gini savunmaktadır.Bu ¸calı¸smada
T¨urkiye’de asgari ¨ucret d¨uzeyinde 2016 yılında meydana gelen %33’l¨uk etkili artı¸sın istisnaili˘ginden faydalanarak ve asgari ¨ucret artı¸slarından etkilenmesi beklenen gru-pların oranlarındaki b¨olgesel farklılıkları dikkate alarak asgari ¨ucret politikasının ¨
ucret, istihdam ve kayıtdı¸sılık ¨uzerindeki etkisini inceliyorum.Gen¸c i¸s¸ciler ile lise e˘gitimi olmayan i¸s¸cilerin asgari ¨ucretli ¸calı¸san i¸s¸cilerin kaydade˘ger bir oranını temsil etti˘gini g¨osterdikten sonra, 2016 yılındaki asgari ¨ucret artı¸sının lise e˘gitimi olmayan i¸s¸cilerin ¨ucretlerinde bir artı¸s meydana getirdi˘gini ancak bu grubun istihdamında as-gari ¨ucret artı¸sından kaynaklanan negatif bir etki bulunmadı˘gını g¨osteriyorum. ¨Ote yandan bu ¸calı¸smada sunulan bulgular, gen¸c i¸s¸cilerin kayıtdı¸sılı˘gında asgari ¨ucret artı¸sından kaynaklanan ¨onemli bir artı¸s bulundu˘gunu g¨osteriyor. Bu sonu¸clara g¨ore,
2015’te 2016 yılında meydana gelen asgari ¨ucret artı¸sından etkilenmesi beklenen
gen¸c i¸s¸cilerin oranında meydana gelen her %10’luk artı¸s, 2016’daki gen¸c kayıtdı¸sılık oranını %12 ila %17 oranında artırmı¸stır.
ACKNOWLEDGEMENTS
During the last two years, I have learned so much from ¨Ozg¨ur Orhangazi. His
lectures and works have changed my point of view. I would like to thank him for his continuous guidance, criticism, and “just write your dissertation” reminder. Without his support, I would have been lost (literally). I would also like to thank
Hasan Tekg¨u¸c who has taught me empirical thinking. Completing this dissertation
would have been impossible without his generous support. I have greatly benefited from lengthy conversations with him.
Many people fed me with their valuable feedbacks. I am thankful to Murat G¨uray
Kırdar who spared his time to become my committee member. I would also like to thank Kerim Keskin, G¨ozde C¸ ¨orek¸cio˘glu ˙Ishako˘glu, Dila Asfuro˘glu for their invalu-able comments.
I have been very lucky to have friends who have been source of fun and support. Special thanks go to C¸ a˘gda¸s Yal¸cınkaya and Kardelen C¸ i¸cek for our long conversa-tions. I have been also fortunate to meet Ay¸ca Tuba Alp, Ali Alper Alemdar, Beste
G¨un Aslan, ¨Ozge Sarıyer, Serra Aydo˘gdu and Berke Sancaklı. Barı¸s Faik Orhan,
my dear chum, has been always a great source of motivation.
Finally, I would like to express my gratitude to my family. Their sacrifices and support made everything possible.
LIST OF SYMBOLS/ABBREVIATIONS
Fijt 1 Fraction of a↵ected workers by minimum wage increase within
demographic group i in region j in year t 1
Wijt Average wages of demographic group i in region j in year t
Yijt Labor market outcomes of demographic group i in region j in
year t
Jj Region fixed e↵ect
Tt Year fixed e↵ect
Xjt 1 log GDP in region j in year t 1
M W1t Minimum wage level of the first half of year t
M W2t Minimum wage level of the second half of year t
HLFS Household Labor Force Survey
HBS Household Budget Survey
TE Tertiary Educated Workers
LTH Less Than High School Educated Workers
NUTS Nomenclature of Territorial Units for Statistics
LIST OF TABLES
Table 1.1 Minimum wage level and its annual deviation... 4
Table 4.1 Effects of the minimum wage increase in 2015 and 2016 on labor market outcomes of the mostly affected groups... 51
Table B.1 Fraction of minimum and sub-minimum wage workers ... 79
Table B.2 A brief survey of the minimum wage literature ... 80
Table B.3 Descriptive statistics for the period of 2014-2016... 90
Table B.4 Effects of the minimum wage increase in 2015 and 2016 on labor market outcomes of the least affected groups ... 91 Table B.5 Baseline results and follow-up models with alternative time periods.92
1. INTRODUCTION
There is an ongoing controversy surrounding the minimum wage policy. Some argue that an increase in minimum wage has an expansionary e↵ect on the economy; others, on the other hand, argue that the minimum wage has an adverse impact on employment outcomes. The debate mainly originates in the standard textbook model predicting a negative relationship between above equilibrium minimum wage and employment. In his seminal paper, Stigler (1946) elaborates on this prediction by arguing that adverse employment e↵ects of minimum wage are substantial and certain (p.361). In their extensive review of the empirical minimum wage literature, Neumark & Wascher (2008) support Stigler and show that majority of the minimum wage studies find negative employment e↵ects.
In the case of Turkey, business owners and large business organizations often com-plain about the minimum wage being too high. Following the announcement of the sharp minimum wage increase in 2016 in Turkey, for example, an employer in tex-tile sector complained that “I rented a new facility. I was planning to increase my production by hiring 500 workers. In response to announcement [of the minimum wage increase], however, I dropped the idea” (Hurriyet 2015). Similarly, a CEO in textile manufacturing business argued that “the labor intensive sector is not able to cope with a 30% increase in minimum wage. Some factories will be liquated.” (ibid.). But complaints were not limited to the textile sector. Before the enactment of the increase, the vice chairman of the Independent Industrialists’ and
Business-men’s Association (M ¨US˙IAD) maintained that “business world is very sensitive to
such costs” (IHA 2015).
interested in market demand rather than wage level in determining employment.A number of prominent case studies (Card 1992a,b, Katz & Krueger 1992, Card & Krueger 1994) and empirical studies conducted in 2000s (Dube et al. 2010, 2013, Allegretto et al. 2011, 2017) support Lester, suggesting that there is no consensus on the e↵ects of the minimum wage policy.
I contribute to this debate by using the regional variation in the fraction of the potential minimum wage workers in Turkey to show how the 33% increase in the minimum wage in 2016 impacted average wages, which groups were most likely to benefit from the increase, and how this increase changed the employment and informality dynamics of the mostly a↵ected workers.
There are few studies on the impact of minimum wages on labor markets for the case of Turkey. These studies examine di↵erent time periods and use di↵erent
meth-ods. For example, G¨uven et al. (2011) use a time-series framework to examine the
employment e↵ects of minimum wage. Papps (2012) exploits the variation of the individual level labor costs in order to detect the employment e↵ects of the social security taxes and minimum wage. Using a fixed-e↵ect model, Pelek (2015)
ex-plores the minimum wage’s e↵ects on youth employment. More recently, Y¨unc¨uler
& Y¨unc¨uler (2016) use the variation in the fraction of the a↵ected workers across in-dustry and occupation interactions. They adopt a di↵erence-in-di↵erences approach to examine the labor market e↵ects of the dramatic increase in minimum wage in
2004. G¨ursel et al. (2018) focus on the low-wage sectors to explore the e↵ects of
minimum wage increase in 2016 on informality. Acar et al. (2019) examine how the increase in minimum wage in 2016 a↵ected firm’s exit rates from the formal economy.
I make three contributions to this limited literature. First, I utilize the quasi-experimentality of the sharp minimum wage increase in 2016 to capture the e↵ects of minimum wage on wage and employment dynamics. Past minimum wage studies focusing on this increase are interested in only one aspect (i.e., informal job) of the
minimum wage’s e↵ects. However, minimum wage could potentially a↵ect many labor market outcomes, especially wages. Without considering these e↵ects alto-gether, it is hard to understand the general e↵ects of an increase in minimum wage on a↵ected groups’ welfare. For this reason, I examine the e↵ects of the dramatic minimum wage increase in 2016 on wage, informality, and employment outcomes.
Second, following the recent developments in the literature, I explicitly addresses the time-varying heterogeneities across regions. A well-known fact is that the results of the studies which utilizes the variation of the national minimum wage/regional average wages ratio or the regional variation in the fraction of the minimum wage workers are vulnerable to time-variant unobservable heterogeneities across regions. If an unobservable region-specific shock coinciding with the minimum wage increase, the regional identification strategy is not able to capture the causal e↵ects of the minimum wage increase. This study handles this issue by following Aksu et al. (2018) who use year x 5 regions interaction terms to capture the unobservable time-variant changes in regional labor market outcomes.
Third, this study also discusses the important confounders such as Russian attack aircraft shootdown by Turkey on 25 Nov. 2015, and coup d’etat attempt on 15 July. 2016. Since these political events which were likely to have important e↵ects on labor market outcomes were experienced in a period in which the sharp minimum wage increase in 2016 became e↵ective, more importantly, in sectors where considerable share of minimum wage workers are employed; studies relying on sectoral identifi-cation strategy may falsely attribute the e↵ects of this observable confounders to minimum wage increase in 2016.
This is especially important, because the increase in the minimum wage in 2016 followed a series of striking political events. First of all, 2015 was an election year for Turkey. After the June 7 general election, ruling Justice and Development Party (AKP) lost its parliamentary majority receiving 258 seats, fewer than the bare mini-mum (276 seats) to keep the majority. Following unsuccessful coalition negotiations,
Table 1.1: Minimum wage level and its annual deviation
2004 2005 2006 2007 2008 2009 2010 2011 2012 2013 2014 2015 2016 2017 Real (2003=100)
Real Net Minimum Wage Level (TL) 288 299 296 293 317 328 329 336 348 358 359 373 467 452
Annual Change(%) 28 3 -1 0 8 3 0 2 3 2 0 3 25 -3
Real Gross Minimum Wage Level (TL) 403 418 414 409 401 416 417 427 441 453 456 474 592 572
Annual Change (%) 31 3 0 -1 -1 3 0 2 3 2 0 3 24 -3
Real Minimum Wage Cost (TL) 511 508 503 497 488 505 507 519 514 529 534 557 695 672
Annual Change (%) 19 0 0 -1 -1 3 0 2 0 2 0 4 24 -3
Nominal
Net Minimum Wage Level (TL) 310 350 380 411 492 536 587 643 720 788 868 974 1300 1404
Annual Change(%) 37 12 8 8 19 8 9 9 11 9 10 12 33 8
Gross Minimum Wage (TL) 433 488 531 573 623 679 744 816 913 999 1102 1237 1647 1777
Annual Change(%) 41 12 8 7 8 8 9 9 11 9 10 12 33 7
Minimum Wage Cost (TL) 549 593 645 696 757 825 904 991 1063 1165 1289 1453 1935 2088
Annual Change(%) 28 8 8 7 8 8 9 9 7 9 10 12 33 7
Notes: Own calculations based on Turkstat’s CPI and Labour and Social Security Ministry of Turkey’s mini mum wage data.All values reflect the annual averages for years in which more than one minimum existed.
Turkey held a second election resulting in AKP’s overhauled parliamentary majority on 1 Nov. 2015.
During the June 7 election campaigns, major parties’ election promises were mostly based on economic pledges and a dramatic increase in minimum wage was the most popular one. The minimum wage changing race started with the main opposition Republican People’s Party’s (CHP) election promise, pledging to raise the monthly minimum wage from 949TL in 2015 to 1500TL in 2016. Following the CHP, Na-tionalist Movement Party (MHP) and People’s Democratic Party (HDP) raised the bar by pledging 1400TL and 1800TL minimum wages, respectively. Although the ruling AKP did not promise an increase in the minimum wage during the June 7 election campaigns, after its unsuccessful election results on June 7, it got in the minimum wage running by promising 1300TL minimum wage during November 1 election campaigns. It regained its parliamentary majority in this election and its minimum wage promise went into e↵ect on 1 January 2016.
Table 1.1 shows that this is one of the most dramatic increase in minimum wage in Turkey during the 2000s. Although a similar increase took place in 2004, the increase in the minimum wage cost to employer, which is sum of unemployment premium,
social security tax, and net minimum wage,was less dramatic in 2004 compared to the increase in 2016. Considering significance of the increase, government thus temporarily reduced the social security premiums paid by the employers for the already employed for 2016. In other words, the total labor cost increase (nominal) accruing to the employers was less than 33% increase in net minimum wage but still significant at 26%. Moreover, this temporary reduction was only valid for the number of employees who were employed in 2015 full-time. It did not cover any increase in employment. For these reasons, the increase in 2016 can be seen as a quasi-experiment.
The exogeneity of the minimum wage increase also corroborates this argument. Because, although economic growth rose from 5.16% in 2014 to 6.08% in 2015 (see Figure A.1) , decision for the increase in minimum wage was not due to the overall performance of the economy. The government had no announced plans to increase the minimum wage. However, faced with intense electoral competition in which the rival parties all made promises to increase the minimum wage, the ruling party was forced to make a similar move. Therefore, this increase in the minimum wage originated mostly due to exogenous political competition rather than the dynamics of the economy itself.
Nonetheless, the increase coincided with another important political event. A Turk-ish F-16 attack jet shot down a Russian attack bomber on 24 November 2015, immediately before the minimum wage increase on 1 January 2016. Following the political turmoil, Russia started to impose economic sanctions on Turkey. The im-port of Turkish fruits and vegetables was banned. The permit-to-work of Turkish construction companies doing business in Russia was rescinded. Due to the sanc-tions, clothing exports to Russia slumped. A shopkeeper in Laleli, where Russians who buy clothing have a central place in the economic activity, complained for exam-ple that“It’s very difficult to work at the moment. A lot of shops are closed. There are no customers” (BBC 2016). Yet the shootdown’s actual e↵ects were mostly felt in the tourism sector, since Russia prevented Russian tour operators from organizing
tours in Turkey. The sanction resulted in 95% decrease in the number of Russian tourists who have a substantial place in the tourism sector.
It is important to note that the sectors a↵ected by this event have also a considerable share of the minimum and sub-minimum wage workers. Since both the shootdown and the sharp minimum wage increase occurred almost instantaneously, the mini-mum wage studies based on a sectoral identification strategy are incapable of dealing with such a confounder. Relying on an identification strategy based on the regional variation in the potential minimum wage workers, this study shows that the regions with a higher share of the minimum wage workers are not necessarily most a↵ected by the shootdown. It is thus able to separate the e↵ects of the minimum wage increase from that of the shootdown.
A second concern is that the minimum wage increase preceded the coup d’etat at-tempt on 15 July 2016. Following the event, government declared state of emergency. More than 150,000 state employees were discharged after the event. Trustees were appointed to the companies accused of being linked to the attempted coup. Conse-quently, the turmoil caused the contraction of the economy in the third quarter of 2016.It is thus possible to falsely attribute the e↵ects of this turmoil to the minimum wage’s e↵ects. In this study, I discuss this issue and show that my regional identi-fication strategy is robust to such observable confounders. In other words, regions with a higher fraction of the workers a↵ected by the minimum wage increase are not systematically a↵ected by coup attempt.
With these in mind, the results presented in this study document that youth (15-24) workers and less than high school educated workers are disproportionally represented among the minimum wage workers. Following the minimum wage increase in 2016, the growth in the wage of these groups positively di↵ered from that of other groups in which overwhelming majority worked at higher than minimum wage level.However, this study does not support a negative e↵ect of the minimum wage increase on employment. But, an important rise in the informality of young workers potentially
due to the minimum wage increase is illustrated. Accordingly, an additional 10 percent of workers a↵ected by the 2016 minimum wage increase rises young workers’ informality by 12 to 17 percent. Positive informality finding is in line with the
findings of G¨ursel et al. (2018) and Acar et al. (2019) who look at e↵ects of the
sharp minimum wage increase in 2016 on informal jobs.
In the chapter 2, I review the literature. I mainly focus on the U.S. literature, since the state-level variation in minimum wage regulation has allowed researchers to discuss main methodological problems in examining the e↵ects of minimum wage policy (Neumark, 2017,p.2). After showing the main methodological problems dis-cussed in the U.S. context, I discuss their relevance for other developed countries, for developing countries, and for Turkey.
In Chapter 3, I discuss the data. Drawing on the descriptive results, I also identify the minimum wage workers and show the pre-existing trends in their labor market outcomes. This enable to conduct an eyeball test to control whether a detectable change in the labor market outcomes of the mostly a↵ected groups took place fol-lowing the minimum wage increase in 2016.
In Chapter 4, I discuss the identification strategy and model. I analyze the validity of the identification strategy, and discuss the identifying assumptions. The results and their robustness analysis are also presented in this section. In Chapter 5, I conclude the study.
2. LITERATURE REVIEW
The literature on minimum wage mostly focuses on its e↵ects on employment.1 The
main reason behind this is that testable and precise predictions on the employment e↵ects of minimum wage arising from the neoclassical model of wage and employment determination encourage empirical studies which seek to test these predictions (Card & Krueger 1995a). Therefore, I begin by discussing the textbook labor market model in this section and show the roots of the ongoing debate on the employment e↵ects of minimum wage. Then, I review empirical studies for the U.S., for other developed countries, and for some developing countries. I discuss their relevance for Turkey and for this study.
In the perfectly competitive labor market model, wages (marginal cost of hiring an additional labor) must be equal to the marginal productivity of labor (marginal revenue from hiring an additional labor) (Cahuc & Zylberberg 2004) just as a firm’s marginal cost must be equal to the marginal revenue of the firm in a competitive goods market. This is because an employee who faces an employer o↵ering a wage which fall behind the employee’s marginal productivity of labor can always find an-other employer who o↵ers a higher wage, since there is an“attrition war” among employers who want to take the advantage of the additional revenue from the addi-tional production which is spawned by an addiaddi-tional labor. Under these conditions, any wage floor exceeding the equilibrium wage level decreases the employment as there is no reason for employers to hire additional labor whose marginal productivity falls behind introduced wage floor, i.e. minimum wage.
An overwhelming majority of the empirical studies for the US economy verifies
1For a detailed discussion of the literature see Neumark & Wascher (2008). Table B.2 presented in Appendix presents a brief summary of the literature.
this proposition until the 1980s. In their extensive review of the literature on the e↵ects of minimum wage on employment, Brown et al. (1982) show that the general finding of this literature is that a 10% increase in minimum wage rises teenage unemployment rates somewhere between 0 and 0.75%. Following Addison et al. (2015)’s classification of the literature, this early consensus, which generally relies on time-series evidence, can be categorized as the first stage of the minimum wage research. Studies in this circle generally construct an identification strategy based on the comparison of years in which minimum wage increased and years in which it did not. However, the problem stems from the relatively low variation in minimum wage level and employment level in time series.
Moreover, Card & Krueger (1995b) suggest that the consensus conclusion is sensi-tive to preferred specification and time period by showing that there is a negasensi-tive relationship between observation number and t-ratio in the time-series models. Fur-thermore, they maintain that to control for the other explanatory variables which can a↵ect employment over time is a monumental task in the time-series framework, because there can be important structural changes a↵ecting employment over such long-time periods.
To address these problems, a number of studies in the 1990s (Card 1992a,b, Katz & Krueger 1992, Card & Krueger 1994) adopt a new identification strategy. The novelties of these studies include finding a quasi-experiment which is engendered by a minimum wage policy shock, identification of the precise control group unaf-fected by the minimum wage shock and of treatment group a↵ected by the minimum wage shock, and use of di↵erence-in-di↵erences estimator to estimate the employ-ment di↵erences between identified control groups and treatemploy-ment groups. Using this methodology for example, Card (1992a) utilizes California’s minimum wage increase from $3.35 to $4.25 in 1988 as a quasi-experiment. He focuses on the di↵erences between California’s teenagers’ employment and employment of teenagers in other states in which state level minimum wage did not rise during the same period. He finds that although the minimum wage increase in California caused a 5-10%rise
in low-skilled workers’ wages, it did not decrease the employment of teenage work-ers. Similarly, Katz & Krueger (1992), adopting the federal minimum wage increase in 1991 as the case, design a survey for the fast-food restaurants in Texas where state-level minimum wage in 1990 was lower than new federal minimum wage in 1991. They find that employment increased relatively in the fast food restaurants experienced the sharpest increase in wages. In a more prominent case-study, Card & Krueger (1994) conduct a survey for fast-food restaurants in New Jersey, where minimum wage increased from $4.25 to $5.05 in 1992, and for the fast-food restau-rants in Pennsylvania in which there was no increase in minimum wage during the same period. By comparing the una↵ected restaurants which were paying more than new minimum wage in New Jersey, a↵ected restaurants which were paying less than new minimum wage in New Jersey, and totally una↵ected restaurants in Penn-sylvania; they conclude that there was no relative reduction in the employment of a↵ected restaurants in New Jersey. However, case studies done by this method do not always find no employment e↵ects. For example, in a more recent case study of New York minimum wage increase in 2004-2006, Sabia et al. (2012) find very large negative employment e↵ects for those aged 16-24. Taking the minimum wage hike in Seattle in 2015-2016 as a quasi-experiment, Jardim et al. (2018) show that there were considerable working hour reductions stemming from the increase.
All in all, contrary to the earlier literature which found negative employment ef-fects for minimum wage increases, these new case studies show that the impact of minimum wage increases on employment vary. However, all these studies focus on the short-run e↵ects of minimum wage increases on employment. When the long-run e↵ects of minimum wages increases on employment is considered, drawbacks of the case-study approach stand out. These studies focus on very-short time periods whereas it can take time to adjust the employment of minimum wage workers fol-lowing a minimum wage rise (see Meer & West 2016, Sorkin 2015). In this regard, there is another strand in the literature focusing on the state-level panel data, hence utilizing the state-level variation in minimum wage level, and adopting an empirical strategy based on fixed e↵ect models. Neumark & Wascher (1992),Zavodny (2000),
Neumark (2001), Couch & Wittenburg (2001), Sabia (2009), and Lordan & Neumark (2018) are important examples. All of them find that there is a negative relationship between minimum wage level and employment. Main reason for di↵erent findings in these studies is that they focus on cross-state variation in employment and min-imum wage levels over a relatively long-time period, while previously mentioned case studies utilize variation in employment and minimum wage level between two states over a short-time period. However, the panel studies’ main assumption is the absence of the state-specific trends in outcome variable. Dube et al. (2010) argue that this assumption is violated, because states in which an increase in minimum wage takes place may already have negative employment trends, and that fixed-e↵ect models without state-specific trends which cannot capture these time-varying heterogeneities across states may be biased. In order to address this problem, Dube et al. (2010) and Allegretto et al. (2011) include state-specific linear time trends. By doing so, they are able to show that pre-existing trends absorb the employment e↵ects of minimum wage increases.
In addition to the possibility of such state-specific variation in time trends, Dube et al. (2010) also point out the possibility that neighboring states may not be good control groups for each other. In order to construct more robust control groups, they generalize the case study approach using a local identification strategy based on contiguous county pairs. Their suggestion is that contiguous county pairs imitate each other better in terms of demographic factors and labor market dynamics, and that instead of comparing all states, or neighboring states such as New Jersey and Pennsylvania, it is more proper to compare contiguous county pairs. Adopting this approach, they find no employment e↵ects in line with the conclusions arising from previous case studies.
In sum, inclusion of state-specific employment trends and a generalized case study approach based on contiguous county pairs can be seen as a paradigm shift in the minimum wage-employment debate. Yet, a number of question rise on the shift. First, is there a valid reason to include state-specific linear time trends? Although
Dube et al. (2010) and Allegretto et al. (2011) argue that states in which there has been important minimum wage increases experience time-varying heterogene-ity corroborating the inclusion of state-specific time trends, Neumark et al. (2014) emphasize that a related problem lies behind order structure of the included time trends. They point out that the bias stemming from the inclusion of linear time trends can be illustrated in the deviation of time-trends’ residuals for the interested time period including two recessions. For this reason, they suggest that the higher-order time trends are more suitable for a time period including these recessions. When they correct Allegretto et al. (2011)’s specification in line with this propo-sition, they find negative employment e↵ects. In a follow-up research, Allegretto et al. (2017) pay regard to Neumark et al. (2014)’s criticisms. They expand their time period by including non-recessionary 1979 and 2014 and using high-order time trends. However, they show that insignificant employment results persist, suggest-ing that their previous results are not sensitive to order structure of the included time trends and to “end-point bias”.
Another question related to this shift, is an identification strategy based on con-tiguous county pairs more preferable than an identification relying on cross-state variation as in Neumark & Wascher (1992), or on regional variation as in the case-studies? To show that notion that geographic proximity ensures robust control and treatment regions are not plausible, Neumark et al. (2014) use synthetic control ap-proach. They maintain that if a county in which there is no minimum wage increase replicates the structural characteristics of its contiguous county, where there is a minimum wage increase, in the absence of treatment e↵ect, then synthetic control approach should bring about higher weights for this contiguous county pair. Their analysis, however, suggests that this is not the case. They thus conclude that an identification strategy based on contiguous county pairs “throws out the baby with the bathwater” by “throw[ing] away so much potential identifying information” (p. 30). Because, they propose, any county is as good control group as contiguous coun-ties, whereas Dube et al. (2010) wrongly focuses only on contiguous county pairs. But Dube et al. (2013) shows that contiguous county pairs are much more
compa-rable in terms of structural variables such as overall private-sector employment, log population, private-sector employment to population ratio, log of average private sector earnings, overall turnover rate, and teen share of population.
Overall, my review of the U.S literature suggests some methodological conclusions which are important for the empirical strategy of this study. First, traditional time series approach has serious drawbacks in analyzing the relationship between min-imum wage and employment. Second, although the case-study approach is based on a more robust identification strategy, it ignores the medium and long-run em-ployment e↵ects of minimum wage. Third, fixed-e↵ect models relying on national variation can capture the long-run e↵ects, though they can be biased if there are time-varying heterogeneities across states, which can be addressed including the state-specific time trends.
The conclusions arising from the above-mentioned studies relying generally on the identifying information coming from the variation in the cross-state minimum wage statute may be seen, on first glance, as irrelevant to discuss the employment e↵ects of minimum wages in Turkey since Turkey has a national minimum wage statute. However, for countries like Turkey, one can still adopt an identification strategy based on the regional di↵erences drawing on the geographical variation in minimum wage “bites”. Studies adopting this strategy expect that an increase in national minimum wage level should have more impact on regions with a higher share of the workers whose wages are lower than introduced minimum, but equal or surpass old minimum wage. In addition to studies used this methodology to examine the e↵ects of the United States’ federal minimum wage (e.g. Card 1992b, Currie & Fallick 1993), some examples come from other developed countries. In their analysis of the minimum wage’s employment e↵ects in Canada, Campolieti et al. (2006) use di↵erences in the fraction of a↵ected workers across provinces for a period of 1981-1997. They find substantial negative elasticities. Dolton et al. (2015), on the other hand, use an “incremental di↵erences-in-di↵erences” estimator based on variation in incremental changes in national minimum wage and on variation in national
minimum wage/regional wage averages ratio (Kaitz index). What they find is small negative employment e↵ects due to minimum wage introduction. In their analysis of the introduction of minimum wage in Germany in 2015, Caliendo et al. (2018)exploit the regional variation in the fraction of a↵ected workers whose wages lag behind the introduced minimum wage. They find small negative e↵ects on overall employment due to sharp declines in the employment of those whose monthly earnings are lower than 450 Euro.
There are also some examples for developing countries. For instance,Khamis (2013) utilizes the regional variation in the fraction of a↵ected workers for Argentina and finds no employment e↵ects. Rama (2001) uses it to detect the employment e↵ects of sharp minimum wage increases in Indonesia in 1990s and shows that there was 0-5% decrease in employment stemming from the increases. Lemos (2009) analyzes the employment e↵ects of minimum wage in Brazil using fixed-e↵ect models. In Turkey, a number of studies focusing on e↵ects of minimum wage use the regional variation in the fraction of a↵ected workers. To capture the school enrolment e↵ects of sharp minimum wage increase in 2004 in Turkey for example, Bakı¸s et al. (2015) use regional di↵erences in the proportion of a↵ected workers whose wages fall behind new minimum wage. Pelek (2015) uses a fixed-e↵ect model to detect the employment e↵ects of minimum wage making use of the regional variation in Kaitz index.
However, an empirical strategy based on the regional di↵erences in minimum wage bite is not the only way to capture the e↵ects of minimum wage in countries with a national minimum wage. Lack of representative regional data, or presence of the individual-level panel data, or more explicit variation in the fraction of a↵ected workers across demographic groups based on ages and sectors over time encourage researchers to adopt di↵erent identification strategies. For example, Machin et al. (2003) look at employment e↵ects of the introduction of minimum wage in UK in 1999 by focusing on residential home care industry in which one third of workers earned less than new minimum wage before the introduction of the new minimum. They find evidence verifying a decrease in working hours and employment due to the
introduction of minimum wage. Similarly, Bossler & Gerner (2016) assess the em-ployment e↵ects of statutory minimum wage introduced in 2015 in Germany. They use firm-level micro-data and adopt an empirical method based on the variation in the fraction of a↵ected workers with an hourly wage below the new statutory min-imum wage. Their evidence verifies a 1.9% decrease in the employment of a↵ected firms following the introduction of the statutory minimum wage. Likewise, in their analysis of the change in the minimum wage law in Spain in 1995, which closed the gap between minimum wage level for workers aged 16-17 and minimum wage level for older workers, Anton & de Bustillo (2010) show a considerable decrease in the teenage employment after the introduction of the law. Ham (2018) uses the variation stemming from the changes in the number of minimum wage categories in Honduras, and illustrates the presence of a reduction in employment. Dinkelman & Ranchhod (2012) analyze the e↵ects of labor market regulation which introduced a minimum wage for domestic workers in South Africa in 2002. Utilizing the variation in intensity of the law, they find no employment e↵ects. In their analysis of the sub-stantial increase in minimum wage in 2004 in Turkey, Y¨unc¨uler & Y¨unc¨uler (2016) exploit the variation in the fraction of a↵ected workers across industry-occupation interactions.
I have reviewed the literature in the context of the identification issue up to this point. It has turned out that the identification strategies relying on the di↵erences in regional and demographic characteristics are common in the literature, and that the importance of addressing time-varying heterogeneities across regions takes center stage. Yet another concern for a study focusing on the e↵ects of minimum wage in a developing country is informality. This is because it is known that labor market policies’ enforcement power is lower in the developing countries, and that some neoclassical models (e.g. Welch 1976, Gramlich 1976) in which there are two sectors covered and uncovered by minimum wage law predict that an increase in minimum wage causes a labor flow from covered (formal) sectors to uncovered (informal) sectors. Thus, although an overall employment e↵ect due to minimum wage may not be discerned, an increase in minimum wage can still decrease the share of formal
employment in a developing country. Indeed, some studies focusing on the minimum wage’s employment e↵ects in developing countries find corroborating evidences for this argument (e.g. see Ham, 2018 for Honduras; Comola and De Mello, 2011 for Indonesia) (for an extensive review of the relationship between informality and minimum wage in developing countries see Pelek 2014)
Contrary to other developing countries, however, the minimum wage literature in Turkey is very limited. This is surprising as Turkey has the highest national mini-mum wage/average wage ratio among OECD countries (Pelek, 2014, p.196); it has witnessed two dramatic increases in the minimum wage level within last decade (see Table 1.1), and new job formation lags behind economic growth (see Yeldan 2011, Orhangazi 2019). Minimum wage can be responsible for this weak labor market performance. But only a number of studies test this hypothesis. Using Pesaran
coin-tegreation test, G¨uven et al. (2011) examine the relationship between employment
and minimum wage in manufacturing industry for the period of 1969-2008 and find no employment e↵ects. However, their long sample period includes four recessions and a continuous structural transformation contaminating the actual employment e↵ects expected to arise from the increase in minimum wage. This validates the above-mentioned criticism of the time-series approach. Papps (2012) adopts a dif-ferent approach by exploiting the “variation over time among low-wage workers in the ratio of total labor costs to the gross wages” (p.686). His main argument is that social security system and minimum wage together bring higher cost for lower-wage workers relative to higher-wage workers. Using household-level panel data for 2002-2005, he finds a negative relationship between minimum wage and employment.
By contrast, using a region-level panel data for a longer period of 2004-2014, and focusing only on 15-29 age cohort, Pelek (2015) shows that there is no negative correlation between minimum wage and employment, but that minimum wage has a considerable positive impact on informality. Yunculer and Yunculer (2016) using the fraction of minimum wage workers across di↵erent industries and occupations as key variables find a positive relationship between minimum wage and average
wages, working hours, informality; and no relationship between minimum wage and employment. They utilize the substantial increase in minimum wage in 2004 as a quasi-experiment. It is worth noting, however, that GDP growth was as high as 8.8% in 2004. One thus can expect that the sharp increase in minimum wage in this year was endogenous to macroeconomic conditions, and that high growth rate over-rode the minimum wage’s e↵ects.
In this study, I exploit the sharp minimum wage increase in 2016 as a quasi-experiment. As I argued in Chapter 1, the minimum wage increase was an exo-geneous shock. A few studies exploits this policy experiment to detect the e↵ects of minimum wage on various outcomes. Guney et al. (2017) capture its e↵ects on
consumer loans. G¨ursel et al. (2018) focus on its e↵ects on informality. Acar et al.
(2019) examine its impacts on firms’ exit rates from the formal economy. To my knowledge, however, there is no any study focusing on its e↵ects on wage and em-ployment dynamics of the mostly a↵ected groups. In order to quantify the e↵ects of the dramatic increase in minimum wage on a↵ected individuals’ welfare, it is im-portant to examine the wage and formal- informal employment dynamics together.
Using Dolton et al. (2015) incremental di↵erence-in-di↵erences approach and follow-ing Card (1992b)’s and Caliendo et al. (2018)’s empirical methodology, this study adopts an identification strategy based on the regional variation in the mostly af-fected groups by the minimum wage increase. As distinct from the similar studies adopted the similar methodologies, it addresses the observable confounders and the unobservable heterogeneities across regions.
3. DATA AND DESCRIPTIVE ANALYSIS
3.1 DATA
I use Annual Household Labor Force Survey (HLFS) for 2004-2016. HLFS is a cross-sectional micro data gathered by Turkstat to produce official labor market indicators. It provides information about demographic characteristics, employment status, income, past work experience of households’ members.
Turkstat also provides more comprehensive cross-sectional Household Budget Sur-vey (HBS) data with additional variables related to households’ incomes in kind. Using HBS, I could detect also minimum wage’s e↵ects on these incomes, since it is reasonable to expect that an increase in wages generated by a rise in minimum wage can be compensated by a decrease in wages in kind as a discount in transportation, mass transportation, utility bills, and in travel services, dinner, kinder garden fees, cloth benefits. In other words, an increase in minimum wage can encourage employ-ers to reduce these benefits. However, HBS lacks the regional information which is essential for the empirical strategy of this study. Moreover, HBS brings about
a trade-o↵ between observation number and variable number (Tekg¨u¸c et al. 2017).
As it is vital to disaggregate data set by age, education, and regions to build an empirical strategy based on the variation in the share of the minimum wage workers by various demographic groups and regions, I prefer HLFS with higher observation number.
G¨ursel et al. (2018) emphasize that quarterly HLFS is more informative than annual
HLFS, since the latter can mislead when two or more minimum wage levels exist in a year. I discuss this issue in the following sub-section.
Last, I focus on wage employment by including only following groups unless indicated otherwise:
• Those aged 15-64
• Those who are in employment • Those who declare an earning
• Those who are wage or salaried employees, or casual workers
3.2 IDENTIFICATION OF THE MINIMUM WAGE WORKERS
Who are the minimum wage workers? This section tries to answer this question. Heterogeneous workers models predict that the minimum wages’ e↵ects on the labor market outcomes of the demographic groups with a higher share of the minimum wage workers will be more severe (Brown et al. 1982). In this respect, the most stud-ied groups in the U.S. minimum wage literature are teenagers (13-19 years), young adults (20-24 years), retail trade workers, and workers in restaurants. Studies seek-ing to discern the e↵ects of minimum wage in Turkey generally focus on youth (e.g. Bakı¸s et al. 2015, Pelek 2015), conduct an industry-occupation based analysis (e.g. Y¨unc¨uler & Y¨unc¨uler 2016), or examine manufacturing workers (e.g. G¨uven et al. 2011). But demographic characteristics in labor markets in Turkey have changed during 2000s (see Orhangazi 2019). I thus try to show the trends in the fraction of the minimum wage workers by various demographic groups and regions and to understand which groups and regions are most likely to be a↵ected by the minimum wage increases.
G¨ursel et al. (2018) emphasize that identification of minimum wage workers using
an-nual HLFS is not easy, since it requires a number of identification assumptions. The reason is that some years have two di↵erent minimum wage levels due to minimum wage changes within that year, and annual HLFS with no survey month information is simply not able to capture minimum wage workers. Take 2015 for instance, net minimum wage was 949 TL in the first half of the year, and 1,000 TL in the second
half of the year. Which observations in 2015-wave should be considered as minimum wage workers? This issue induces the determination of a general threshold capturing all possible minimum wage workers during the entire wave. Taking the minimum wage level in the first half of the year as minimum threshold and the minimum wage level in the second half of the year as maximum threshold, and allowing a 5% error margin, possible minimum wage workers are discernible. This approach yields 902TL as minimum threshold and 1050TL as maximum threshold in 2015 for example. In other words, a worker earning a wage between these thresholds can be considered as a minimum wage worker in 2015. Generalization of the approach yields the following wage condition of the minimum wage workers:
M W1t (M W1t⇤ 0.05) < Wit< M W2t+ (M W2t⇤ 0.05) (3.1)
where M W1t is the minimum wage level of the first half of the year t, M W2t is the
minimum wage level of the second half of the year t, Wit is the wage of minimum
wage worker i in year t. Indeed, the condition captures the possible minimum wage workers, and does not allow to treat individuals with wages 5% higher than minimum wage level of the second half of the interested year, and with wages 5% lower than minimum wage level of first half of the interested year as a minimum wage worker. All in all, when I refer to minimum wage worker in this section, I imply the workers whose wages satisfy this condition.
With these in mind, first, I explore which skill groups work generally at the mini-mum wage level and are potentially more a↵ected by increases in minimini-mum wage. Figure 3.1 shows the fraction of those whose wages fall behind the minimum wage (dashed line), at minimum level (solid line), and exceed minimum wage level
(two-dashed line) by education group and informality status.2
2Workers not registered in the Social Security Institution are defined as informal work-ers. Note also that in figures excluding informal workers, a minority declaring lower than minimum wage earning is always detectable. In Turkey, however, formal workers cannot work at lower than minimum wage level. Thus, this minority can be seen as a measurement error. The error is the largest among less than high school group and younger cohorts, and smallest among college-educated workers and adult cohorts. Increasing in crisis years, the error is non-randomly distributed. Although it is hard to justify, anecdotal evidence suggests that some employees are supposed to pay back a fraction of their formal earnings to their employers, as a way to circumvent minimum wage statute.
A.Overall B.Less Than High School C.High School D.Tertiary Education Excluding inf or mals Including inf or mals 2004 2005 2006 2007 2008 2009 2010 2011 2012 2013 2014 2015 2016 2004 2005 2006 2007 2008 2009 2010 2011 2012 2013 2014 2015 2016 2004 2005 2006 2007 2008 2009 2010 2011 2012 2013 2014 2015 2016 2004 2005 2006 2007 2008 2009 2010 2011 2012 2013 2014 2015 2016 0 25 50 75 100 0 25 50 75 100 Years Share in full − time w age emplo yment (%)
Wage status Higher than minimum wage Lower than minimum wage Minimum wage
Figure 3.1: Share of minimum wage workers by education group
Notes: The author’s calculations based on annual HLFS. Those who are employed, wage or salaried employees, casual workers, full time workers, whose wages satisfy the wage condition (3.1) are defined as minimum wage workers.
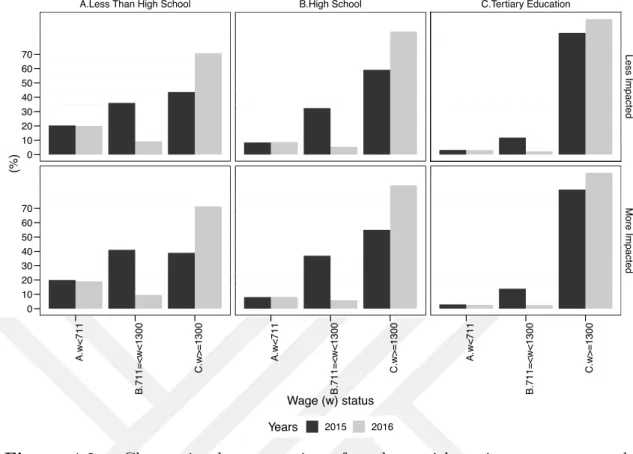
The figure displays that the share of minimum wage workers is the highest within less than high school group and the lowest among college-educated workers. Although the proportion of minimum wage workers are considerably high within high-school group either, the share of minimum wage workers among less than high school edu-cated workers noticeably di↵ers from the share of minimum wage workers within re-maining skill groups. Considering only formal workers, for example, 32% of workers with less than high school education earned minimum wage in 2015, while the same figure was 22% for high school group, and 7.6% for tertiary-education group. Also, the share of minimum wage workers has increased considerably over time among less than high school and high school educated workers worked both formally and informally. Altogether, these figures point out that an increase in minimum wage is most likely to a↵ect less than high school group.
21% for high school group) in the fraction of minimum wage workers within less than high school group and high school group took place from 2015 to 2016. This is true even if we include informal workers. This suggests that, other things being equal, dramatic increase in minimum wage in 2016 had a noticeable enforcement power.
Inclusion of informal workers increases the fraction of workers earning lower than minimum wage level. This increase is especially dramatic within less than high school group. Proportion of workers whose wages fall below minimum wage level within less than high school group was 21% in 2015, whereas it was 8% for high school group and 2.6% for college educated workers. Informality and non-compliance does not change the picture that less than high school educated workers are dispro-portionally represented among minimum wage workers.For this reason, Figure 3.1 suggests that a study focusing on the e↵ects of minimum wage increase can rely on an identification strategy based on the variation in share of minimum wage workers among various skill groups.
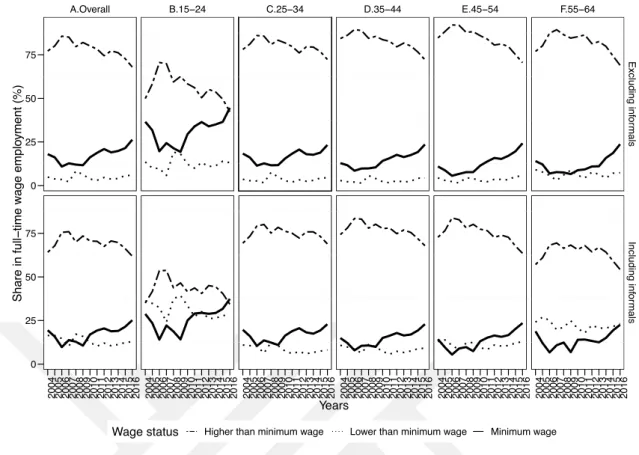
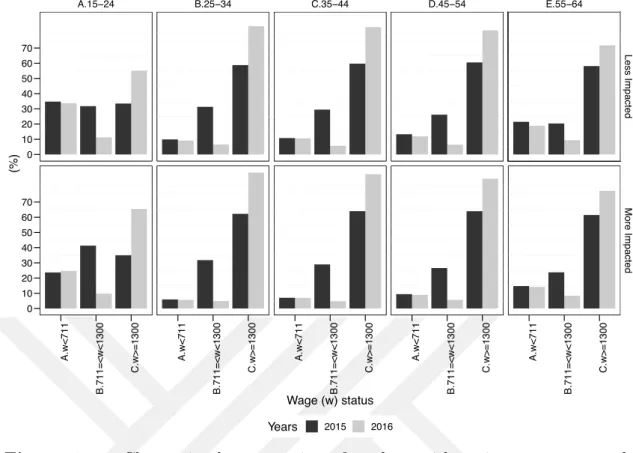
Teenagers (13-19 years old) and young adults (20-24 years old) are also prime sus-pects which are most likely to be a↵ected by an increase in minimum wage. Indeed, Neumark & Wascher (2008)’s extensive review of the literature shows that vast ma-jority of minimum wage literature studied the e↵ects of minimum wage on teenagers and young adults. I thus look at the fraction of minimum wage workers by age cohorts in Figure 3.2 considering also informality. The figure shows that, in both panel, the share of minimum wage workers within 15-24 age cohort dramatically di↵ers from that of other age cohorts. Among formal workers, the share of mini-mum wage workers within 15-24 age cohort was 36.5% in 2015. By contrast, it was around 20% within remaining cohorts.
Inclusion of informal workers increases the variation in the share of a↵ected workers between age cohorts. For instance, in 2015, nearly two third of those aged 15-24 worked at or lower than minimum wage level. Whereas the same figure was, on average, 30% within 25-34, 35-44, 45-54 cohorts, and 40% within 55-64 cohort. But
A.Overall B.15−24 C.25−34 D.35−44 E.45−54 F.55−64 Excluding inf or mals Including inf or mals 2004 2005 2006 2007 2008 2009 2010 2011 2012 2013 2014 2015 2016 2004 2005 2006 2007 2008 2009 2010 2011 2012 2013 2014 2015 2016 2004 2005 2006 2007 2008 2009 2010 2011 2012 2013 2014 2015 2016 2004 2005 2006 2007 2008 2009 2010 2011 2012 2013 2014 2015 2016 2004 2005 2006 2007 2008 2009 2010 2011 2012 2013 2014 2015 2016 2004 2005 2006 2007 2008 2009 2010 2011 2012 2013 2014 2015 2016 0 25 50 75 0 25 50 75 Years Share in full − time w age emplo yment (%)
Wage status Higher than minimum wage Lower than minimum wage Minimum wage
Figure 3.2: Share of minimum wage workers by age-cohort
Notes: The author’s calculations based on annual HLFS. Those who are employed, wage or salaried employees, casual workers, full time workers, whose wages satisfy the wage condition (3.1) are defined as minimum wage workers.
these figures increased noticeably in 2016. The increase was the sharpest among those aged 15-24 and worked formally. These figures, together, show that minimum wage is more binding for youth cohort.
To complete the picture of the minimum wage workers, I show their regional distri-bution and regional Kaitz index, namely the ratio of national minimum wage level to regional average wages. This is especially important, because the consensus in me-dia discussions about the minimum wage in Turkey is that living costs di↵er across regions and national minimum wage statute ignoring these di↵erences undermines employment in regions with a higher share of minimum wage workers.
Figure 3.3 shows that there are some regions with a higher fraction of minimum wage workers over a longer time period of the sample. For example, in TR33 region
has been persistently higher, though 2008-2009 and 2015-2016 interrupted this trend. In TRB1 (Malatya, Elazı˘g, Bing¨ol, and Tunceli) and TRC1 (Gaziantep, Adıyaman, and Kilis) regions, the fraction of minimum wage workers has been also higher. On the other hand, there are some regions, such as Istanbul (TR10) and Ankara (TR51), where fraction of minimum wage workers has been consistently lower. In addition to fraction of minimum wage workers, Figure 3.3 also shows the ratio of the national minimum wage level to regional averages of wages, i.e. Kaitz ratio. Its trend across regions over time shows that South Eastern region as a whole have generally higher Kaitz ratio. And regions with the higher fraction of minimum wage workers have generally higher regional Kaitz ratio.
In conclusion, analysis in this section trying to identify the minimum wage workers indicates that i) majority of minimum wage workers are less educated or younger than average; ii) the share of minimum wage workers in regions such as TR33
(Manisa, Afyonkarahisar, K¨utahya, and U¸sak), TRB1 (Malatya, Elazı˘g, Bing¨ol,
and Tunceli) and TRC1 (Gaziantep, Adıyaman, and Kilis) has been persistently higher. Although di↵erences in the fraction of minimum wage workers across these groups are only “noisy proxies” (see Jardim et al., 2018; Cengiz, 2019), consider-able di↵erences in the share of minimum wage workers across demographical groups and regions suggest that a study trying to detect minimum wage’s labor market outcomes can exploit the variation in the fraction of minimum wage workers across regions, skill groups, and age cohorts over time.
Figure 3.3: Share of minimum wage workers by regions (NUTS-2)
3.3 PRE-EXISTING TRENDS IN LABOR MARKET OUTCOMES
I show in this section how wage, employment, and informality dynamics of the mostly a↵ected groups has changed during the period of 2004-2016. I illustrate the pre-existing trends in these variables, which are likely to absorb the e↵ects of mini-mum wage increase in 2016, providing a useful information for econometric analysis. Moreover, I especially focus on years in which real minimum wage level increased sig-nificantly, then conduct an eyeball test to understand whether considerable changes in outcome variables in these years took place.
3.3.1 Wages
In Figure 3.4, I look at growth in the various skill groups’ monthly wages. Both panels reveals that one of the most dramatic increases in wages within all education groups took place in 2016, and that this increase was the sharpest within less than high school group in which nearly one third of workers worked at minimum wage level in 2015.
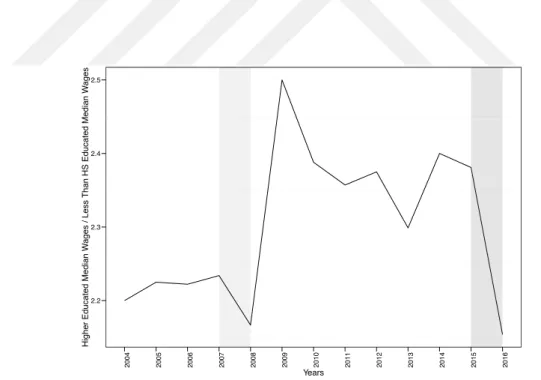
Figure 3.5 confirms this relative increase by showing that there was a sharp decline in 2016 in the relative wages of college educated workers measured as the ratio of college educated workers’ median wages to less than school educated workers’ median wages. It is thus possible to contend that, other things being equal, minimum wage policy is capable of influencing the wage growth. Light-shaded region in Figure 3.5 shows the year (2008) in which the other considerable increase (8%) in real minimum wage level took place support the argument, because it shows that there was a considerable decrease in the relative wages of college educated workers following the noticeable
minimum wage increase in 2008.3
3I present an additional evidence in Figure A.6 showing changes in wage distribution from 2013 to 2016. We observe that the density of workers earning new minimum wage (vertical lines) is higher within less than high school group. More importantly, the most dramatic shift to right in the wage distribution of this group occured from 2015 to 2016. The right column of the figure indicates that informal workers’ wages were also a↵ected by the minimum wage increase, because the second hump in the wage distribution is at the minimum wage level in 2016 (vertical line). This supports the ”lighthouse e↵ect” implying
Excluding informals Including informals 2005 2006 2007 2008 2009 2010 2011 2012 2013 2014 2015 2016 2005 2006 2007 2008 2009 2010 2011 2012 2013 2014 2015 2016 0 10 20 Years Gro wth in monthly w ages (%)
A.Less Than High School B.High School C.Tertiary Education
Figure 3.4: Average wage (nominal) growth by education
Notes: The author’s calculations based on annual HLFS. Those who are employed, wage or salaried employees, casual workers, full time workers, and declare an earning are included. Sharp fluctuations in the wage growth in 2009-2010 may be due to selection bias. It is likely that increasing unemployment in 2009 financial crisis caused the selection of higher skilled workers, rising wage growth in this year.
2.2 2.3 2.4 2.5 2004 2005 2006 2007 2008 2009 2010 2011 2012 2013 2014 2015 2016 Years
Higher Educated Median W
ages / Less Than HS Educated Median W
ages
Figure 3.5: Median wage (nominal) of college educated workers / median wage (nominal) of less than high school educated workers
Notes: The author’s calculations based on annual HLFS. Those who are employed, wage or salaried employees, casual workers, full time workers, and declare an earning are included. The college educated workers’ median wages are divided by the less than high-school educated workers’ median wage. Medians are weighted.
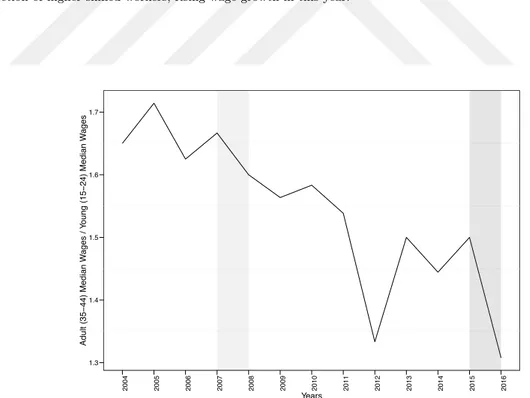
Variation in the share of minimum wage workers across di↵erent age groups can strength this result. In this respect, I show how wage growth di↵ers across age cohorts over time. Figure 3.6 displays that, on average, the growth in wages of 15-24 group is similar to that of other age cohorts during the sample period. But, in both panel, the wage growth of 15-24 group in which about two third of workers earned at typically minimum wage level or at lower than minimum wage level in 2015 was steeper in 2016, which support the argument that minimum wage increase in 2016 had a positive impact on wages of these more a↵ected workers.Figure 3.7 shows the same picture from a di↵erent perspective. In years experiencing the noticeable real increases in minimum wage, there were declines in relative wages of adult workers measured as ratio of median wages of 35-44 age group to median wages of 15-24 age group.4 5
3.3.2 Employment
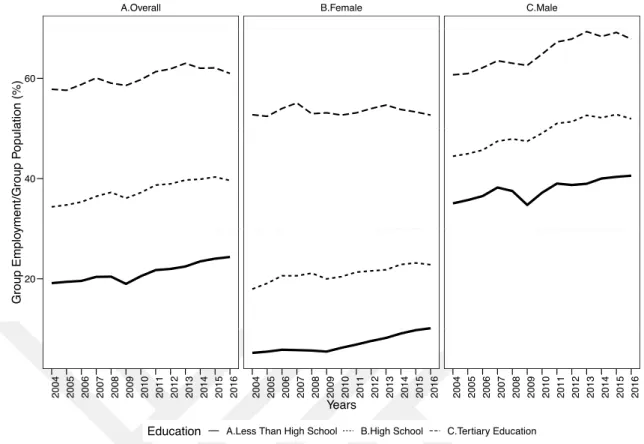
Since nearly one third of less than high school group worked at minimum wage level in 2015 (Figure 3.1) and wage growth in 2016 was more noticeable (Figure 3.4, Figure 3.5), employment e↵ects of the minimum wage increase is expected to be evident for this skill group. To investigate this argument, I present the employment
that minimum wage has also positive impact on informal workers’ wages.
4The evidence presented in Figure A.7 to Figure A.9 supports this positive wage e↵ect, because it illustrates that there is a hump in formal young workers’ wage distribution at the minimum wage level in 2016. We also observe that the most dramatic shift to right in the wage distribution of this group occured from 2015 to 2016. The right column of the figure indicates that there was a lighthouse e↵ect, since informal young workers’ wages were also a↵ected by the minimum wage increase in 2016. This is because there was a second hump in wage distribution at the minimum wage level in 2016 (vertical line).
5We can also expect that regions with a higher fraction of minimum wage workers experience more noticeable wage growth following considerable minimum wage increases. In this regard, Figure A.2 shows the wage growth figures by region. It illustrates that regions such as TR21 (Edirne, Tekirda˘g, and Kırklareli), TR62 (Adana and Mersin), TR33 (Manisa, Afyonkarahisar, K¨utahya, and U¸sak), TRB1 (Malatya, Elazı˘g, Bing¨ol, and Tunceli) and TRC1 (Gaziantep, Adıyaman, and Kilis) with higher fraction of the minimum wage workers in 2015 witnessed steeper increase in wages in 2016. But a steeper increase in monthly wages was not limited to regions with a higher fraction of minimum wage workers. For example, regions such as Istanbul (TR10) and Ankara (TR51) which had lower fraction of minimum wage workers also experienced noticeable increases in wage growth in 2016.
Excluding informals Including informals 2005 2006 2007 2008 2009 2010 2011 2012 2013 2014 2015 2016 2005 2006 2007 2008 2009 2010 2011 2012 2013 2014 2015 2016 −10 0 10 20 30 Years Gro wth in monthly w ages (%)
Age A.15−24 B.25−34 C.35−44 D.45−54 E.55−64
Figure 3.6: Average wage growth by age
Notes: The author’s calculations based on annual HLFS. Those who are employed, wage or salaried employees, casual workers, full time workers, and declare an earning are included. Sharp fluctuations in the wage growth in 2009-2010 may be due to selection bias. It is likely that increasing unemployment in 2009 financial crisis caused the selection of higher skilled workers, rising wage growth in this year.
1.3 1.4 1.5 1.6 1.7 2004 2005 2006 2007 2008 2009 2010 2011 2012 2013 2014 2015 2016 Years Adult (35 − 44) Median W ages / Y oung (15 − 24) Median W ages
Figure 3.7: Median wage within 35-44 group/ median wage within 15-24 group
Notes: The author’s calculations based on annual HLFS. Those who are employed, wage or salaried employees, casual workers, full time workers, and declare an earning are included. The adult (35-44 ages) workers’ median wages are divided by the young (15-24 ages) workers’ median wage.
A.Overall B.Female C.Male 2004 2005 2006 2007 2008 2009 2010 2011 2012 2013 2014 2015 2016 2004 2005 2006 2007 2008 2009 2010 2011 2012 2013 2014 2015 2016 2004 2005 2006 2007 2008 2009 2010 2011 2012 2013 2014 2015 2016 20 40 60 Years Group Emplo yment/Group P opulation (%)
Education A.Less Than High School B.High School C.Tertiary Education
Figure 3.8: Full time wage employment/population ratio by education and gender
Notes: The author’s calculations based on annual HLFS. Observations are grouped by gender, year, and education. Number of workers who are full time wage, salaried, or casual workers is divided by population.
trends by education groups and gender in Figure 3.8. In all three panels, however, there is no evidence suggesting a decrease in less than high school group’s employ-ment following the sharp minimum wage increase in 2016. Although the high school group experienced a decrease in employment, college-educated group in which over-whelming majority earned higher than minimum wage also faced a significant decline in employment in 2016. These figures show that the most a↵ected group did not experience a relative decrease in employment in 2016.
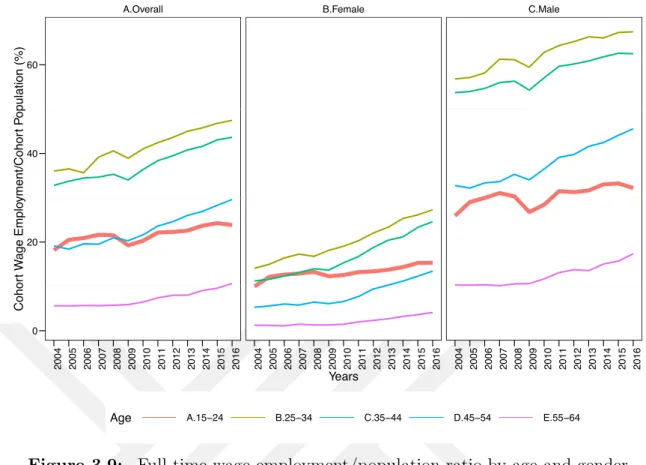
Was there a relative decline in youth employment following the steeper increase in youth wage in 2016? Figure 3.9 indicates that upward trend in youth employment stopped in 2016 and that there was a noticeable relative decrease in young females’ and young males’ employment. Meanwhile, overall employment of those aged 45-54 and 55-64 followed upward trend, while 25-34 and 35-44 age groups’ positive employment trend also stopped in 2016.
A.Overall B.Female C.Male 2004 2005 2006 2007 2008 2009 2010 2011 2012 2013 2014 2015 2016 2004 2005 2006 2007 2008 2009 2010 2011 2012 2013 2014 2015 2016 2004 2005 2006 2007 2008 2009 2010 2011 2012 2013 2014 2015 2016 0 20 40 60 Years Cohor t W age Emplo yment/Cohor t P opulation (%)
Age A.15−24 B.25−34 C.35−44 D.45−54 E.55−64
Figure 3.9: Full time wage employment/population ratio by age and gender
Notes: The author’s calculations based on annual HLFS. Observations are grouped by gender, year, and age-cohort. Number of workers who are full time wage, salaried, or casual workers is divided by population.
Before interpreting these indicators, it is important to consider that there was a slowdown in the economy in the third quarter of 2016, confounding “pure” minimum wage e↵ects. However, overall employment in the economy sustained its growth from 2015 to 2016 (see Figure A.1). Thus, other things being equal, significant decrease in youth employment in 2016 may be interpreted as negative employment e↵ects of
minimum wage on youths.6
6Figure A.3 shows the full-time wage employment/population ratio by region for the pe-riod of 2004-2016. Employment in high impacted regions such as TR21 (Edirne, Tekirda˘g, and Kırklareli), TR62 (Adana and Mersin), TRB1 (Malatya, Elazı˘g, Bing¨ol, and Tunceli), in which fraction of minimum wage workers was around 30% in 2015, decreased in 2016. However, since the other high impacted regions such as TR33 (Manisa,Afyonkarahisar, K¨utahya, and U¸sak), and TRC1 (Gaziantep, Adıyaman, and Kilis) experienced an in-crease in employment in the same year, such a dein-crease does not identify the an e↵ect of the minimum wage increase on employment.
3.3.3 Informality
Welch (1976)’s and Gramlich (1976)’s two sector models predict that there will be a labor flow from covered (formal) sectors to uncovered sectors (informal) following the minimum wage increase. This is because, according to these models, individuals not employed in formal sectors due to minimum wage increase can have a reservation wage lower than formal wages. To investigate this prediction, an analysis of informal employment trends of the various skill groups is illustrated in Figure 3.10. The figure suggests that negative trends in informality among less than high school and high school educated workers came to stop in 2016. For example, the share of informal workers within high school group increased from 27.73% to 27.77% in 2016, whereas it had declined from 29.06% in 2014 to 27.73% in 2015. Similarly, the share of informal workers among less than high school educated workers rose from 8.92% to 9.08% in 2016, while there had been consistent decrease in the share of informal workers within this group until this year.
By contrast, tertiary education group maintained its decrease in informality in 2016. In short, one might tempted to argue that, other things being equal, presence of a 2016 reversion in negative informality trends for most a↵ected groups is due to minimum wage increase.
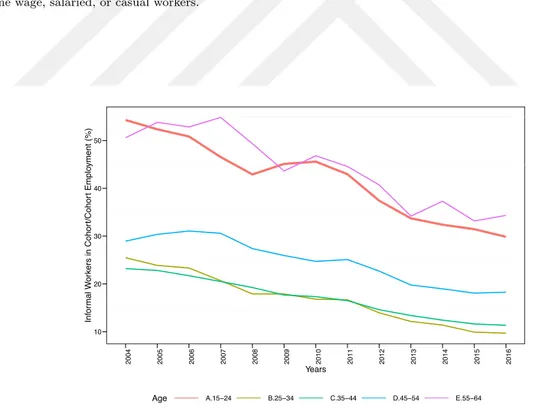
We see informality trends by age in Figure 3.11. To confirm the positive e↵ects of minimum wage on informality shown in Figure 3.10, Figure 3.11 should illustrate an increase in the share of informal workers within 15-24 age cohort. This is because the share of minimum wage workers in 2015 was the highest within this age group. However, the figure shows mixed results. There was no relative increase in the share of informal workers within 15-24 age group, but 55-64 group experienced noticeable rise in informality. Recall that (Figure 3.2) the share of workers earning minimum wage or lower than minimum wage level was 40% in 2015 within 55-64 group, while
it was nearly 60% within 15-24 group.7
7Figure A.4 indicates the share of informal workers by region. There are high impacted regions such as TR21 (Edirne, Tekirda˘g, and Kırklareli), TR33 (Manisa, Afyonkarahisar,
5 10 15 10 20 30 40 2004 2005 2006 2007 2008 2009 2010 2011 2012 2013 2014 2015 2016 Years Inf or
mality in High School and T
er
tiar
y Education Groups (%)
Inf
or
mality in Less Than School Group (%)
Education A.Less Than High School B.High School C.Tertiary Education
Figure 3.10: Informal workers/Employment ratio by education
Notes: The author’s calculations based on annual HLFS. Observations are grouped by education. Number of full-time informal workers who are full full-time wage, salaried, or casual workers is divided by the number of employed full time wage, salaried, or casual workers.
10 20 30 40 50 2004 2005 2006 2007 2008 2009 2010 2011 2012 2013 2014 2015 2016 Years Inf or mal W or kers in Cohor t/Cohor t Emplo yment (%)
Age A.15−24 B.25−34 C.35−44 D.45−54 E.55−64
Figure 3.11: Informal workers/Employment ratio by age
Notes: The author’s calculations based on annual HLFS. Observations are grouped by age-cohorts. Number of full-time informal workers who are full time wage, salaried, or casual workers is divided by the number of employed full time wage, salaried, or casual workers.