Integrated analysis of energy-economic development-environmental
sustainability nexus: Case study of MENA countries
Mustapha D. Ibrahim
a, Andrew Adewale Alola
b,c,⁎
aFaculty of Engineering, Industrial Engineering Technology, Higher Colleges of Technology, Sharjah, United Arab Emirates bFaculty of Economics Administrative and Social sciences, Istanbul Gelisim University, Istanbul, Turkey
c
Department of Financial Technologies, South Ural State University, Chelyabinsk, Russia
H I G H L I G H T S
• An Energy-economic-environmental sustainability analysis of MENA coun-tries.
• Data Envelopment Analysis (DEA) and ARDL Pooled Mean Group are employed.
• Efficiency nexus of conventional energy is significant and higher (98%) than re-newable energy (69.5%).
• Energy efficiency of the panel of MENA countries worsen the environmental quality.
• There is a significant environmental ad-verse effect of economic growth.
G R A P H I C A L A B S T R A C T
a b s t r a c t
a r t i c l e i n f o
Article history: Received 17 March 2020
Received in revised form 25 May 2020 Accepted 26 May 2020
Available online 29 May 2020 Editor: Huu Hao Ngo Keywords:
Data envelopment analysis Energy efficiency ARDL PMG
Economic development Renewable energy Environmental sustainability
The new industrialization necessitates the integration of energy efficiency, economic development, and environ-mental sustainability. However, quantifying the efficiency of renewable energy towards economic development is an ongoing debate. On this basis, this study presents a multi net-put efficiency and conventional efficiency ap-proach to analyze non-renewable energy and renewable energy efficiency towards economic development and environmental sustainability nexus. Data Envelopment Analysis (DEA) is utilized to estimate multi net-put con-ventional and renewable energy efficiency. Likewise, the Autoregressive Distributed Lag (ARDL) Pooled Mean Group (PMG) approach is applied to examine the impact of non-renewable efficiency on economic growth, total natural resource rent and environmental quality. Results show that the efficiency nexus of conventional en-ergy is significant and higher (98%) than renewable energy (69.5%) for the evaluated period (2006–2016). None-theless, conventional energy efficiency of the panel of MENA countries worsen the environmental quality, thus does not enhance environmental sustainability especially in the long-run. The results also posit that economic growth in the panel of MENA countries is detrimental to the region's environmental sustainability. Further anal-ysis indicates that the inefficiency of renewable energy nexus has more to do with scale size inadequacy rather than operational deficiency. Therefore, resources and policies must be targeted towards up scaling renewable en-ergy capacity accompanied with cautious and target oriented strategy.
© 2020 Elsevier B.V. All rights reserved.
⁎ Corresponding author at: Faculty of Economics Administrative and Social sciences, Istanbul Gelisim University, Istanbul, Turkey. E-mail addresses:[email protected](M.D. Ibrahim),[email protected](A.A. Alola).
https://doi.org/10.1016/j.scitotenv.2020.139768
0048-9697/© 2020 Elsevier B.V. All rights reserved.
Contents lists available atScienceDirect
Science of the Total Environment
j o u r n a l h o m e p a g e :w w w . e l s e v i e r . c o m / l o c a t e / s c i t o t e n v1. Introduction
The international Energy Agency has consistently predicted a severe implication from depletion of traditional (non-renewable) energy sources (International Energy Agency(iea), 2019). In recent time, the expected depletion has mainly been associated with unbalance avail-ability of limited energy sources and other economic activities that in-clude rapid population growth, and industrial development (Alola and Alola, 2018;Adedoyin et al., 2020c). The intergovernmental agencies, governments and other related stakeholders have shown concern not only about the depletion of energy sources, but also about the effects of non-renewable energy on biodiversity extinction, forest destruction, global heating, population health, and natural disaster (Intergovernmental Panel on Climate Change (IPCC), 2020;Energy Information Administration, 2018). The recent report of the Intergov-ernmental Panel on Climate Change (IPCC) (Intergovernmental Panel on Climate Change (IPCC), 2020) indicated that global trend of industri-alization has moved past pure economic development which requires substantial traditional energy consumption. The new industrialization necessitates environmental sustainability, coupled with economic growth, both of which can be linked to an efficient, environmental friendly energy production/consumption system.
The Middle East and North African (MENA) region have shown con-cern about the effect of non-renewable energy on the environment and its impact on future economic growth. Despite the growing interest of MENA about the importance of renewable energy, limited attention has been given to its role in economic growth. In recent years, studies on environmental within the context of the MENA countries have ex-plored the related factors and the potential of renewable energy sources such as solar and wind which are substitutes to the traditional energy utilization (International Energy Agency(iea), 2019;El-Katiri, 2014;
IRENA, 2019;Kahia et al., 2016). As such, the development of alternative low carbon energy sources is believed to be motivated by rapid increase in energy demand arising from population growth, economic growth, urbanization, and industrial diversity []. In addition to the role of the po-tential of renewable energy to ensuring energy security, the drive to-wards attaining energy efficiency through the development of the renewable energy is now significantly observed in achieving more em-ployment, sustainability, and industrialization (Adedoyin et al., 2020b;
Etokakpan et al., 2020;Alola et al., 2019b;Alola, 2019b;Saint Akadiri et al., 2019).
The economic activities in many countries and regional bloc such as the tourism sector and agricultural sector in the coastline Mediterra-nean countries are continued are strongly linked to the replacement of conventional energy sources with renewable energy, thus suggesting the regions energy and social development drive towards sustainable energy (Alola and Alola, 2018). The transition to smart grid (Farhangi, 2009) electric power industry of which maximizing utilization of re-newable energy is an important component is gaining strides. The MENA region is a major consumer of energy alongside Asia, with its growth projections well into the 2030s (El-Katiri, 2014). Only 6% of the electricity installed capacity constitute renewable energy in the re-gion (IRENA, 2019). However, according to the International Renewable Energy Agency (IRENA) (IRENA, 2019), countries like Saudi Arabia, United Arab Emirates, and Morocco are making efforts in transitioning to renewable energy. This implores the question of renewable energy efficiency in supporting economic development.
The nexus of energy consumption and economic growth is a well-studied topic in energy economics. An overview of the relationship shows connections between economic growth and energy consumption (Kahia et al., 2016;Ozturk, 2010;Rashid and Kandemir, 2016). How-ever, empirical analysis of this relationship sometimes show inconsis-tent results (Tugcu et al., 2012). Some studies outline the reason to be methodological differences, data variation, regional trends, and differ-ent characteristics of countries. The aim to attain a sustainable develop-ment largely motivates this pattern of research especially those that
integrate sustainable development into the nexus of energy consumption-economic growth. The environmental impact of energy consumption is evident, hence the need for more environmental friendly sources (Ibrahim et al., 2019). The main goal of Eco-efficiency is to optimize resources, value of goods, while minimizing environmen-tal impact (OECD, Organization for Economic Co-operation and Devel-opment, 1998). Studies analyzing regional energy consumption-economic growth-environmental impact have been conducted: EU (Moutinho et al., 2017), OECD (Ibrahim et al., 2019) and China (Li et al., 2019).
However, minimal documentation of such studies is recorded for the MENA region despite its ranking in global energy production and con-sumption. In this study, two approach to energy efficiency towards eco-nomic development and environmental sustainability is implemented. Thefirst approach uses a linear programming technique capable of ac-commodating multiple inputs and outputs to estimate efficiency. Thus, this approach is aimed at mitigating the complexities that arise from a multi net-put energy efficiency definition. The second approach imple-mented for analyzing energy efficiency uses the conventional efficiency definition (input/output). Then, this is followed by an illustration of the nexus of energy-economic output-environmental sustainability by using a regression analysis of environmental factors. In this case, carbon dioxide is being employed as a dependent variable and energy ef fi-ciency, economic development and total resources rents as explanatory variables. Therefore, the contribution of the current study to the body of knowledge considering the analysis techniques is believed to be a novel concept.
This study follows an outlined order. The conceptual framework is outlined in section two. In section three, the employed variables, exper-imental model, and regression techniques are presented. The results of the series of empirical methods employed in the investigation are discussed in section four, a concluding remark with policy recommen-dations are both presented in sectionfive.
2. Efficiency of energy-economic development-environmental sus-tainability nexus
Higher energy efficiency in the context of economic development translates to more economic output with minimal energy consumption. By incorporating environmental sustainability to the energy-economic development nexus efficiency definition, implies that the negative im-pact of energy consumption must be minimal in the system (Ibrahim et al., 2019). The complexity crated by this nexus definition requires a robust efficiency technique that identifies the tradeoffs and balances the composition of the nexus. Data Envelopment Analysis (DEA) is a nonparametric efficiency estimation technique that solves relative effi-ciency problems of systems known as decision making units (DMUs) with multi-input and multi-outputs systems (Ibrahim et al., 2019). DEA was introduced by Charnes, Cooper, & Rhodes (CCR) (Charnes et al., 1978) under constant return scale based on the work of Farrel (Farrell, 1957). It was extended by Banker, Charnes, & Cooper (BCC) (Banker et al., 1984) to include variable return to scale. DEA has shown to be one of the most effective techniques for efficiency evalua-tion of systems (DMUs). In this study, the DMUs are the nexus of energy-economic development-environmental sustainability of MENA countries. It calculates the maximal output (economic) attainable by every input (energy) while attaining maximum sustainability (Environ-mental sustainability). The score of one (100%) is assigned for efficient DMUs and less than one for inefficient DMUs. Due to its robustness, DEA has been used to evaluate efficiency in many industries such as health (Ibrahim and Daneshvar, 2018), transportation and supply chain (Martín and Roman, 2001;Yanpirat and Choatheitmanut, 2014;
Olfat, 2018), Military (Li et al., 2014) and energy (Zhou et al., 2014). The DEA decomposes Overall Technical Efficiency into: Pure techni-cal efficiency and Scale efficiency. This gives an insight into the source of inefficiency. Pure technical efficiency is obtained by estimating the
frontier under variable return to scale, this is known as technical ef fi-ciency without scale efficiency, and it reflects performance towards or-ganizing the inputs in the production process. Performance indexed by scale efficiency is the ratio of Overall Technical Efficiency and Pure Tech-nical Efficiency. It provides policy makers with the ability to propose op-timum size of resources, i.e. to decide the scale size that will give the best production level. Inappropriate size of production can lead to tech-nical inefficiency.
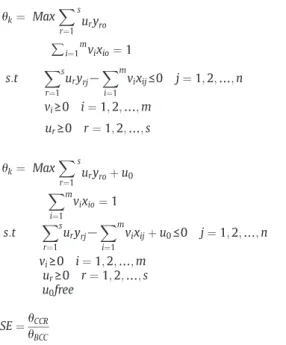
Therefore model (1) illustrates the constant return to scale CCR overall technical efficiency model (Charnes et al., 1985), while model (2) presents the variable return to scale BCC pure technical efficiency model (Banker et al., 1984). The mathematical model composition is as follow:
θk: Efficiency score of DMUK
yr0: output of the under evaluated DMU
xi0: input of the under evaluated DMU
urand vi: Assigned weights for the outputs and inputs
n: number of DMUs under evaluation
θk¼ Max X r¼1 s uryro ∑i¼1mvixio¼ 1 s:t X r¼1 s uryrj− X i¼1 m vixij≤0 j ¼ 1; 2; …; n vi≥0 i ¼ 1; 2; …; m ur≥0 r ¼ 1; 2; …; s ð1Þ θk¼ Max X r¼1 s uryroþ u0 X i¼1 m vixio¼ 1 s:t X r¼1 s uryrj− X i¼1 m vixijþ u0≤0 j ¼ 1; 2; …; n vi≥0 i ¼ 1; 2; …; m ur≥0 r ¼ 1; 2; …; s u0free ð2Þ SE¼ θCCR θBCC ð3Þ
3. Material description and research methods 3.1. Material description
The choices of inputs and outputs must be decided based on the con-text of efficiency and the purpose of the efficiency evaluation. The vari-ables should represent the managerial/policy interest of the system (Cooper et al., 2004). Two models are adopted to estimate efficiency of the Energy- Environmental sustainability-Economic Development nexus. The first model utilizes traditional energy consumption as input. The second model adopts renewable energy as the inputs to-wards economic development and environmental sustainability. This will create a viable benchmark of comparison for renewable energy.
Fig. 1illustrates the index system for the analysis.
Renewable energy consumption (% of totalfinal energy consumption): Renewable energy consumption is the share of renewable energy in totalfinal energy consumption.
Electricity production from renewable sources (% of total): This refers to the percentage of electricity generated from renewable energy sources.
Gross Domestic Product GDP (constant 2010 US$): It is an interna-tional standard economic indicator. It refers to the gross value added by resident producers in an economy plus any product taxes and minus any subsidies not included in the value of the products.
GDP growth (annual %): Annual percentage growth rate of GDP at market prices based on constant local currency. Aggregates are based on constant 2010 U.S. dollars.
Environment Performance Index (EPI): EPI is considered to be one of the most robust sustainable development indictor. It covers two dimen-sions of sustainable development- environmental health and ecosystem vitality. It is estimated using 24 indicators in ten categories.Fig. 2 illus-trates the composition of EPI and the indicators.
3.2. Variable selection, model and regression analysis 3.2.1. Variable selection
In illustrating the nexus of energy-economic output-environmental sustainability as illustrated in the aforementioned approach, a regres-sion analysis of the environmental factors is employed in this section. In this case, carbon dioxide is being employed as a dependent variable and energy efficiency, economic development and total resources rents as explanatory variables. The energy efficiency (EE), total natural resource rent (TNR), and the real income vis-à-vis the Gross Domestic Product (GROWTH) over the study period of 1990 to 2014 were re-trieved from World Bank Development Indicator. Due to data availabil-ity, there is a restriction to only thirteen (Algeria, Bahrain, Egypt, Iran, Israel, Jordan, Lebanon, Morocco, Oman, Saudi Arabia, Tunisia, United Arab Emirate, and Yemen) selected Middle East and North African re-gion (MENA) countries for the investigation period of 1990–2014. For the purpose of controlling for potential omitted variable bias in the esti-mation model, the GROWTH is being employed to control for the
Index system for Integrated analysis of RE-ES-ED Nexus Energy consumption Economic growth Renewable Energy consumption (% of Total Energy consumption) Environmental benefit Electricity production Economic benefit GDP GDP growth Environmental Sustainability Index Electricity production from Renewable energy (% of Total) Input Index Output indexes
Fig. 1. Index system for integrated analysis of Renewable Energy-Environmental Sustainability and Economic Development Nexus.
unobserved variables. Further information such as the variable code, the unit of measurement and the source of the dataset are being illustrated inTable 1.
While the series except the energy efficiency were retrieved from online source (WDI) and directly used for the estimation purpose, fur-ther computation was made for the EE. In the literature, energy ef fi-ciency has been calculated in two ways: (1) by estimating the ratio of total primary energy consumption (input) to economic growth (out-put) and (2) by estimating the total factor energy efficiency the interac-tion of capital, labor and as well using the substitute effect between other factors and energy (Pan et al., 2019). However, Pan et al. opined that thefirst method (single factor energy efficiency) is more suitable especially because of it specificity and the ease of estimation. Thus, the energy efficiency can be expressed as:
EE¼Total energy consumption=GDP ð4Þ
Fig. 2. Composition of environmental performance index.
Table 1
Variable description and measurement unit.
Indicator name Abbreviation Measurement scale Source
Carbon emissions CE Metric tons per capita WDI
Energy efficiency EE Tons of standard/million
Total natural resource rent TNR Percentage of GDP WDI
Gross domestic product GROWTH Constant 2010 US Dollars WDI
In addition to the variable description, the information inTable 2 fur-ther illustrated the statistical properties of the series. Specifically, in
Table 2, the gross domestic product and CO2are observed to exhibit
large deviation over the period of investigation, thus it is responsible for the significant value of the series kurtosis (i.e kurtosis are greater than 3) while the deviation is lowest in the total natural resource rent series. All the variables demonstrated positive skewness as well as the validity of the kurtosis which are all observed to be greater than 3 cept for that of Total natural resource rent (TNR). Additionally, the ex-planatory variables (EE, GROWTH, and TNR) all demonstrated evidence of significant correlation with CO2emissions at 1% significant
level (see Table 3). The significant evidence of the explanatory variable-CE nexus is expectedly negative, positive and positive for EE-CE, GROWTH-EE-CE, and TNR-CE respectively.
3.2.2. Model
Following the conceptual model that underpins the nexus of envi-ronmental impact (I), population (P), affluence (A) and technology (T) vis-à-vis the IPAT and then the Stochastic Impacts by Regression on Population, Affluence and Technology (STIRPAT) see (Dietz and Rosa, 1994;York et al., 2003), further modifications have been made to the environmental model. In recent studies, a few of socio-economic factors among others are being further incorporated to deter-mine dynamics of environmental quality (Salahuddin et al., 2016;
Sarkodie and Adams, 2018;Alola, 2019a;Bekun et al., 2019;Alola and Yildirim, 2019;Adedoyin et al., 2020a). In the light of this, the current study considers the study of Pan et al. (Pan et al., 2019) by incorporating energy efficiency, economic growth, and total resource rent as illus-trated in the model (see Eq.(5)).
CE¼ EE; GROWTH; TNRf g ð5Þ
where CE, EE, GROWTH and TNR are respectively the carbon emissions, energy efficiency, economic growth, and total natural resource rent. Ad-ditionally, the panel and logarithmic form of the above equation is fur-ther presented as
lCEi;t¼ β0þ βlEEi;tþ βlGROWTHi;tþ βlTNRi;tþ εi;t ð6Þ
where the i, t, andε are respectively the country-specific dimension (i.e i = Algeria, Bahrain, Egypt, Iran, Israel, Jordan, Lebanon, Morocco, Oman, Saudi Arabia, Tunisia, United Arab Emirate, and Yemen), esti-mated periods (t = 1990, 1991,…, 2014), and the error term that is in-dependently identical distributed (iiid ~ N (μ, σ)).
In understanding how the energy efficiency, economic growth and the natural resource rent of the MENA countries have affected environ-mental sustainability of the region in both the short (immediate) and long term periods, the current study use the Pooled Mean Group (PMG) of the Autoregressive Distributed Lag (ARDL) method (see
Pesaran et al., 1999). As indicated in several studies, the ARDL PMG method is found to possess a level of superiority relative to the
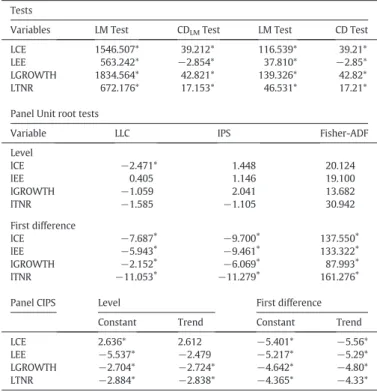
traditional cointegration methods such as the Generalized Method of Moments (GMM), Fully-modified Ordinary Least Square (FMOLS) and Dynamic Ordinary Least Square (DOLS) among others. The superiority of the ARDL PMG lies in the fact that it is potent at estimating both the short and long run impact and the cross-sectional short-run of the ex-planatory variables on the dependent (Bekun et al., 2019;Alola et al., 2019a). Among other advantages of the model is it suitability for inves-tigating a mixed order of integration dataset (i.e when dataset are either I (0) or I (1), and a mix of both). In the current context, the stationarity tests presents that the dataset is I (0) (seeTable 4). The Levin, Lin and Chu (LLC) (Levin et al., 2002), Im, Pesaran and Shin (IPS) (Im et al., 2003) and both Maddala and Wu (Maddala and Wu, 1999) and Choi (Choi, 2001) of the Fisher-ADF panel unit root techniques has been employed in the current study.
However, the aforementioned estimations cannot be performed without investigating the evidence of cross-section dependence i.e. country-specific and unobservable factors that could affect the above-named procedures (De Hoyos & Sarafidis, 2006). The level of country-specific circumstance arising from the economic, financial, social, and political is related to the degree of connectedness vis-à-vis inter-dependence in the panel of examined MENA countries. Specifically, the evidence of interdependence is expected to be more significant
Table 2 Descriptive statistics. CE EE GROWTH TNR Mean 103,853.4 0.27 1.32E+11 15.467 Median 42,790.22 0.249 6.75E+10 10.141 Maximum 649,480.7 0.589 6.52E+11 55.312 Minimum 8214.08 0.084 8.43E+09 0.001 Std. Dev. 139,139.5 0.107 1.31E+11 15.095 Skewness 2.095698 0.802 1.412 0.653 Kurtosis 6.787896 3.267 4.329 2.214 Observations 325 325 325 325
Note: CE, EE, GDP, and TNR are respectively the carbon emissions, energy efficiency, gross domestic product, and the total natural resource rent. Also, Std. Dev. is the standard deviation. Table 3 Correlation matrix. Variable CE EE GROWTH TNR CE 1 EE −0.218* 1 GROWTH 0.928* −0.274* 1 TNR 0.479* −0.150* 0.475* 1
Note: CE, EE, GDP, and TNR are respectively the carbon emissions, energy efficiency, gross domestic product, and the total natural resource rent. Also, * represent a 1% significant level.
Table 4
The cross-sectional dependence and panel unit root. Tests
Variables LM Test CDLMTest LM Test CD Test
LCE 1546.507* 39.212* 116.539* 39.21*
LEE 563.242* −2.854* 37.810* −2.85*
LGROWTH 1834.564* 42.821* 139.326* 42.82*
LTNR 672.176* 17.153* 46.531* 17.21*
Panel Unit root tests
Variable LLC IPS Fisher-ADF
Level lCE −2.471* 1.448 20.124 lEE 0.405 1.146 19.100 lGROWTH −1.059 2.041 13.682 lTNR −1.585 −1.105 30.942 First difference lCE −7.687⁎ −9.700⁎ 137.550⁎ lEE −5.943⁎ −9.461⁎ 133.322⁎ lGROWTH −2.152⁎ −6.069⁎ 87.993⁎ lTNR −11.053⁎ −11.279⁎ 161.276⁎
Panel CIPS Level First difference
Constant Trend Constant Trend
LCE 2.636* 2.612 −5.401* −5.56*
LEE −5.537* −2.479 −5.217* −5.29*
LGROWTH −2.704* −2.724* −4.642* −4.80*
LTNR −2.884* −2.838* −4.365* −4.33*
Note: Variables are stationary at * and ** which are respectively for 0.01 and 0.05 signifi-cant level. The LCE, LGROWTH, LTNR, are respective logarithmic values of carbon emis-sions, of gross domestic product and total natural resources rents.
among the countries with similar geographical, economic and other factor-related situations. In this case, and in addition to the approach of Breusch and Pagan (1980), the cross-section dependence by
Pesaran (2004)are employed without indicating the detail step-to-step procedure here for lack of space. (see result inTable 4). Subse-quently, the LLC, IPS and Fisher panel unit root tests is performed along the Cross-sectionally Im, Pesaran and Shin (CIPS) (Pesaran, 2007) unit root approach because (the CIPS) performs effectively in the presence of cross-section dependency and irrespective of the di-mensions of T and N. The results for the panel unit root tests are shown inTable 4.
3.2.3. Regression methods
3.2.3.1. The PMG ARDL procedure. Therefore, the suitability of the PMG estimator byPesaran et al. (1999)is employed for this investigation such that ΔCEit¼ ∅iECTitþ X q−1 j¼0 ΔlnX1 t− jð Þβijþ X p−1 j¼1 ψijΔlnCEi t− jð Þþ εit ð7Þ ECTit¼ CE−Xitθ ð8Þ
where, CE is the regressed variable (logarithm of carbon emissions), X is the regressors (energy efficiency (EE), economic growth (GROWTH), and the total natural resource rent (TNR)) with same number of slacks q across singular cross-sectional units i in time t,θ indicates the long term coefficient that produces β and ψ appraises the behaviour of the model after reaching convergence. Theε is the error term, while Δ andϕ denotes the denote difference operator and the adjustment coef-ficient respectively. Other step-by-step information of the ARDL PMG approach is not provided here for lack of space and because the proce-dure is readily available in the literature. Moreover, before undertaken the PMG estimation, a priori evidence of cointegration is equally pro-vided by the Johansen and Juselius (Johansen and Juselius, 1990) and Pedroni (Pedroni, 1999) tests as indicated inAppendix A(seeTable A). In view of the possible country-specific and unobservable factors in the panel, and such that could affect the implied PMG result (of
Pesaran et al (1999)), additional estimation procedure that accounts for both the endogeneity that arises from heterogeneity is applied as a robustness check. As such, the cointegration techniques of the Mean Group Estimator (MG) and the Augmented Mean Group Esti-mator (AMG) of Pesaran and Smith (Pesaran and Smith (1995)), and the Common Correlated Effects Mean Group (CCEMG) by
Pesaran (2006)are applied. While the stepwise procedure for these indicated techniques are not outlined in this study because of space constraint, the results are indicated inTable BofAppendix A. Indica-tively, the implied results from the MG, AMG, and the CCEMG are ev-idently observed to have provided a significant conformity to the PMG estimator.
3.2.3.2. Granger causality procedure. Considering the statistical evidence of cointegration in the estimated model, a robustness check is per-formed by using the Dumitrescu and Hurlin (Dumitrescu and Hurlin, 2012) Granger non-causality approach. This panel heterogeneity cau-sality test proposed by Dumitrescu and Hurlin is employed to examine the direction of causality among the variables. Due to space constraint, the step-by-step procedure is not provided here, rather the details of the test is available in the literatureDumitrescu and Hurlin (2012). However, the result of the directional causality among the estimated variables is provided inTable CofAppendix A.
4. Results and discussion
4.1. Energy-economic development-environmental sustainability Efficiency evaluation is carried out using DEA models 1 & 2. The units on the frontier are considered to be relatively efficient, while those enveloped by the frontier are inefficient. The regional average efficiency is illustrated inFig. 3. Results of the analysis shows that on average, the nexus of conventional energy-economic development-environmental sustainability (CE-ED-ES) is significantly higher than the RE-ED-ES nexus from 2006 to 2016. The highest average efficiency was recorded in 2008 for both conventional energy and RE-ED-ES nexus efficiency.
The efficiency estimate for CE-ED-ES nexus is presented inFig. 4. UAE showed an efficient nexus throughout the evaluated period. Morocco, Saudi Arabia, Jordan and Israel showed initial CE-ED-ES nexus efficiency, but became inefficient later on.
Fig. 5illustrates the RE-ED-ES nexus efficiency. Result shows a signif-icant 40% boost in 2008 compared to 2006, with countries like Tunisia, Jordan, Israel, Morocco, and Saudi Arabia leading the way. However, the efficiency dropped in 2010, 2012 and 2014, with only Saudi Arabia still maintaining its relative efficiency. In 2016, Israel, Iraq and Morocco became efficient. The drop RE-ED-ES nexus efficiency can be attributed to increase in energy consumption and economic expansion (which are potentially the intermediate causes) without significant in-crease in renewable energy contribution to the energy consumption.
DEA categorizes inefficiency in two groups - operational inefficiency (technical inefficiency) and scale inefficiency. Operational inefficiency translates to managerial and technical underperformance of the sys-tems which may require comprehensive analysis of the system, and can be identified through the variable return to scale model (2) effi-ciency score. The scale inefficiency on the other hand, represents the un-derutilization or inappropriate size of the system.Fig. 6illustrates the scale efficiency of RE-ED-ES Nexus. The results show a significant scale inefficiency for most countries in the MENA region. Inferring that ineffi-ciency of RE-ED-ES nexus has more to do with the scale size of the re-newable energy system than its operational function. Therefore, resources and policies must be targeted towards renewable energy ex-pansion. However, due to the relatively low RE-ED-ES Nexus technical efficiency compared to the traditional energy nexus, expansion must be accompanied with cautious and target oriented strategy.
4.2. Autoregressive Distributed Lag (ARDL) Pooled Mean Group (PMG) results
Following the aforementioned PMG method that evaluates the short and long-run relationship between carbon emissions, energy efficiency, economic growth and total natural resource rent, the result of the esti-mation is provided inTables 5andTable 6. Importantly, the result indi-cate that energy efficiency of the panel of MENA countries worsen the environmental quality (considering that it increases carbon emissions),
thus does not enhance environmental sustainability especially in the long-run. Specifically, it is observed that a 1% increase in the energy ef-ficiency yields about 0.97% increase in carbon emissions in the panel of estimated countries in the long-run. Also, the immediate impact (short-run) indicates the energy efficiency does not improve the environmen-tal quality. Although this result is not desirable, it actually illustrates that the most of the MENA countries have continued to stick to the conven-tional energy source (the fossil fuel) for their energy need, thus causing
larger share of the fossil fuel in the region's energy portfolio. While many factors such as energy prices, government spending, research and development e.t.c could be responsible for the undesirable effect of energy efficiency (Yang and Wei, 2019), by employing a total energy efficiency instead of the scale efficiency or pure energy efficiency as a disintegrated energy efficiency could also be responsible (Zhao et al., 2019). Moreso, the country-specific short-run result indicate that en-ergy efficiency cause a significant improvement of the environmental
Fig. 4. Efficiency of conventional energy - economic development- environmental sustainability nexus.
quality (considering that there is reduction of carbon emissions) only in Tunisia and Yemen, while such impacts are also desirable but insigni fi-cant in Algeria, Egypt, Morocco, and United Arab Emirate (seeTable 6). However, the impact of energy efficiency in the other countries are un-desirable because it does not lead to the enhancement of environmental sustainability at least in the short-run.
Furthermore, the result posit that economic growth in the panel of MENA countries is detrimental to the region's environmental sustain-ability. As indicated inTable 5, the long-run impact of GROWTH on en-vironmental degradation is positive and significant i.e. a 1% increase in GROWTH will cause about 0.95% increase in CE in the panel. Similarly, the short-run impact of GROWTH in the panel is undesirable but insig-nificant. Considering the economic circumstance of most of the MENA countries, most of the countries are still years away from the economic independence and development attainments experienced by the devel-oped countries. So, large number of the MENA countries mostly de-pends on fossil fuel consumption especially towards increasing economic output and development, thus causing more environmental degradation. In the literature, such as presented in the current case of
the MENA countries, economic growth has been shown to cause grave environmental hazards in similar regional studies (Al-Mulali et al., 2016;Nathaniel and Iheonu, 2019;Sharif et al., 2019). However, with respective elasticities of 1.548 and 0.212 for Oman and Yemen, it is only in the two countries that economic growth accounts for a signi fi-cant improvement of environmental quality at least in the short-run (seeTable 6).
Additionally, the contribution of total natural rent to environmental degradation is positive in the run but negative (desirable) in the short-run as indicated inTable 5. This implies that the value added by the re-source rent of the panel MENA countries is a potential cause of environ-mental hazard especially in the long-run, thus leaving a huge gap for the environmental sustainability goals of the regional states. In the litera-ture, a similar result has also been put forward in the case of the sixteen (16) European Union countries by (Bekun et al., 2019). However, the short-run and country-specific results as indicated inTable 6further posits a desirable picture for the estimated countries. The result found that the total natural resource rent in Algeria, Israel, Jordan, Morocco, Tunisia, and Yemen is a catalyst for the countries environmental sus-tainability drive.
Fig. 6. Scale efficiency renewable energy - economic development - environmental sustainability nexus.
Table 5
Result of PMG-ARDL (1, 1, 1, 1). Source: author computation.
Model: LCE = F(LEE, LGROWTH, LTNR)
Variable Coefficient Std. Error T-stat. P-value
Long run LEE 0.972⁎ 0.047 20.616 0.000 LGROWTH 0.952⁎ 0.016 59.873 0.000 LTNR 0.020⁎ 0.006 3.139 0.000 Short run ECT(-1) −0.528⁎ 0.093 −5.698 0.000 ΔLEE 0.144 0.153 0.943 0.347 ΔLGROWTH 0.415 0.267 1.550 0.122 ΔLTNR −0.006 0.021 −0.305 0.761 Constant −6.147⁎ 1.078 −5.705 0.000
Note: The asterisk (⁎) is the statistical rejection level of null of no co-integration test statis-tics at 1% significance level. Additionally, the fitted model is based on maximum lag 1 as unanimously suggested by three of the lag selection criteria Akaike information criterion (AIC), Final prediction error (FPE), Schwarz information criterion (SC), and Hannan-Quinn information criterion (HQ).
Table 6
Countries short-run estimations.
Countries LEE LGROWTH LTNR ECT (-1)
Algeria −0.348 0.839 −0.191* −0.214* Bahrain 0.192 1.514 0.034*** −0.393* Egypt −0.052 0.989 0.072* −0.474* Iran 0.043 0.037 0.027* −0.605* Israel 1.112* 1.103* −0.008* −0.018* Jordan 0.495* 1.074* −0.011* −0.257* Lebanon 0.146** 0.257* 0.021* −0.636* Morocco −0.075 −0.056 −0.003* −0.898* Oman 0.159* −1.548** 0.107* −0.408* Saudi Arabia 1.318* 2.031* 0.053* −0.313 Tunisia −0.468* −0.000 −0.071* −0.919*
United Arab Emirate −0.484 −0.639 −0.048 −0.480*
Yemen −0.165* −0.212** −0.066* −1.247*
Note: The asterisk (⁎), (**), and (***) are the statistical rejection level of null of no co-inte-gration test statistics at 1%, 5%, and 10% significance level.
5. Conclusion and policy directive
The strategic importance of the Middle East and North African region (MENA) countries especially in regard to the global energy needs and the prevailing global effects of climate change has necessitated the rel-evance of the current study. In response to one of 21st century's man greatest challenge, the global warming, many countries have signi fi-cantly succeeded in implementing the road map to attaining the Sus-tainable Development Goals (SDGs) 2030. As encouraged by the United Nations Framework Convention on Climate Change (UNFCCC), the attainment of the SDGs 2030 is primarily linked to energy efficiency, energy portfolio diversification, and other climate actions
(UnitedNationsDevelopmentProgramme, 2020;
UnitedNationsEconomicCommissionforEurope, 2020).
In respect to the above motivation, the current study employed the ARDL PMG approach and the second generation cointegration tech-niques of MG, AMG and CCEMG (that accounts for the heterogeneity is-sues as a robustness approach) to examine the impact of energy efficiency, economic growth and total natural resource rent on the envi-ronmental quality of the selected 13 MENA countries over the period of 1990 to 2014. The study found that these factors (energy efficiency, eco-nomic growth and total natural resource rent) exerts environmental hazard in the panel countries in the long-run. Although the short-run panel estimate does not present a different situation, the country-specific situation for a few country is however different. Giving the pro-found result of this investigation, relevant policy directives are presented.
5.1. Increasing renewable energy scale size: a policy mechanism
MENA is well endowed with the right amount of solar irradiation all year round, as well as sufficient wind energy in some areas. For the most part, a lot of effort has been channeled towards harnessing solar energy while wind energy, not so much. It is also worthy to note that wastes generation is high in MENA. The UAE for example generates 1.86 kg of solid wastes per capita per day, close to 2.02 kg in the US (Li et al., 2014). Saudi Arabia generates about 13million tons per annum. The population in the UAE continues to grow vis-à-vis the waste generated, most of which can be properly utilized for energy generation. The tech-nological productivity of Municipal waste to energy conversion has in-creased significantly. According to the US energy information administration, about 14 billion kilowatt-hours of electricity was gener-ated in the US from burning 25.9 million tons of combustible municipal waste (EIA, 2019). Geothermal energy is also feasible for the region. Global geothermal potential is estimated to be within 200 gigawatts. Countries in MENA are tipped to have great potential in energy diversi-fication using low enthalpy geothermal plants. This is recommended to power desalination plants and other direct energy application (Ghaffour et al., 2015).
The combination of solar energy, wind energy, biomass, and geo-thermal energy will create a robust smart hybrid renewable energy sys-tem which is strategically convenient for most MENA countries and relatively cost effective. Structural improvement can also contribute to energy efficiency. Energy efficient buildings are mostly focused on resi-dential buildings, further concentration on energy efficient industrial developments will improve overall efficiency of energy consumption and minimize the amount of energy required for industrialization and economic development. To buttress the proposal of a robust smart hy-brid renewable energy system, a feasibility study of 100% renewable electricity system by 2030 showed solar and wind energy to be the most attractive sources for MENA (Aghahosseini et al., 2020). The addi-tion of geothermal for large industrial purpose and establishment of waste-to-energy plants will curtail energy inefficiency, increase renew-able energy scale size and foster economic development.
In a clear term, the current study suggest a renewed, urgent and more effective energy efficiency mechanism that is capable of
mitigating carbon emissions in the MENA countries. In the light of this, a disintegrated energy efficiency approach (such as the scale effi-ciency and pure energy efficiency) could be more effective for the MENA countries. Also, the significant amount of revenue earned by the key oil producing MENA countries could be further utilized to de-velop the renewable energy source capacity. Importantly, the MENA countries could further deplore economy diversification strategy such that has been embedded in the components of the Sustainable Develop-ment Goals (SDGs) 2030.
5.2. Study limitation
Considering that thefirst approach adopted in the study incorpo-rated environmental sustainability amidst the energy-economic devel-opment nexus as against the use of carbon emissions as a proxy for environmental degradation in the second approach, this posit a limita-tion to the study. As such, in lieu of carbon dioxide, future study could consider environmental diversity, key species and/or biomarkers in sen-tinel organisms, and a wide panel of anthropogenic and pollutants such the PCBs, PAHs and heavy metals. Similarly, in regard to the measure of energy efficiency, future studies could consider the efficiency of disintegrated energy sources as against the measure of energy efficiency approach that is being employed in the current study.
CRediT authorship contribution statement
Mustapha D. Ibrahim: Data curation, Writing - original draft, Meth-odology, Supervision. Andrew Adewale Alola: Writing - review & editing, Conceptualization, Formal analysis, Investigation, Methodology, Supervision, Validation, Visualization.
Declaration of competing interest
The authors declare that they have no known competingfinancial interests or personal relationships that could have appeared to in flu-ence the work reported in this paper.
Acknowledgments
Authors have not recieve funding of any type. However, authors commend the professionalism of the editing services of AVIOLA Consult Ltd ([email protected]).
Appendix A
Table A
Panel cointegration tests.
Regression model CE =ƒ(lEE, lgdpc, lTNR)
Fisher-type Johansen
Number of cointegrating equations Trace test Maximum-eigenvalue test
None 126.4* 98.62*
At most 1 50.90* 41.81**
At most 2 292.76 24.97
At most 3 35.43 35.43
Pedroni Residual Cointegration Test Null hypothesis: No cointegration
Alternative hypothesis: common autoregression coefficients (within-dimension) Statistic Weighted Statistic
Panel v-Statistic 0.978 1.681
Panel rho-Statistic −0.763 −1.931**
Panel PP-Statistic −2.865* −4.621*
Panel ADF-Statistic −2.845* −1.610***
Table A (continued)
Regression model CE =ƒ(lEE, lgdpc, lTNR)
Fisher-type Johansen
Number of cointegrating equations Trace test Maximum-eigenvalue test Alternative hypothesis: Common Autoregression coefficients
(between-dimension)
Statistic
Panel rho-Statistic −1.207
Panel PP-Statistic −5.670*
Panel ADF-Statistic −1.056
Note: The p-value for rejecting the null hypothesis of no cointegration is at * for 0.01 sig-nificant level.
Table B
The MG, AMG, CCEMG Tests.
Variables MG Test AMG Test CCEMG Test
LEE 0.628* 0.747* 0.801* LGROWTH 0.770* 0.922* 1.246* LTNR 0.036 0.020 0.027 Wald 15.95* 65.14* 51.64* RMSE 0.073 0.058 0.052 C −7.669 −11.281** 7.392 T 0.008 −0.007 0.014 No. T 5 3 4
Note: The LCE, LGROWTH, LTNR, are respective logarithmic values of carbon emissions, of gross domestic product and total natural resources rents. Also, * indicates the 1% statistical significance level. The RMES, C, T, and No.T are respectively the root mean squared error, intercept, group-specific linear trend, and the share of group-specific trends at 5% signifi-cant level. MG, AMG, and CCEMG are respectively the Mean Group, Augmented Mean Group and Common Correlated Effects Mean Group.
Table C
Dumitrescu & Hurlin (2012) Granger non-causality.
Null hypothesis W-Stat. Zbar-Stat. Prob.
LEE does not Granger cause LCE 1.84042 1.56343 0.118
LCE does not Granger cause LEE 3.10537* 4.25358 2.00E-05
LGROWTH does not Granger cause LCE 7.74371* 14.1178 0
LCE does not Granger cause LGROWTH 3.91184* 5.96866 2.00E-09
LTNR does not Granger cause LCE 0.83031 −0.58579 0.558
LCE does not Granger cause LTNR 4.93463* 8.12836 4.00E-16
LGROWTH does not Granger cause LEE 3.83293* 5.80086 7.00E-09
LEE does not Granger cause LGROWTH 3.89731* 5.93776 3.00E-09
LTNR does not Granger cause LEE 2.56727* 3.10207 0.0019
LEE does not Granger cause LTNR 3.59627* 5.2868 1.00E-07
LTNR does not Granger cause LGROWTH 1.71385 1.29011 0.197
LGROWTH does not Granger cause LTNR 4.99512* 8.25679 2.00E-16
Note: The asterisk (⁎) is the statistical rejection level of null of no co-integration test statis-tics at 1% significance level.
References
Adedoyin, F.F., Alola, A.A., Bekun, F.V., 2020a.An assessment of environmental sustainabil-ity corridor: the role of economic expansion and research and development in EU countries. Sci. Total Environ., 136726
Adedoyin, F., Ozturk, I., Abubakar, I., Kumeka, T., Folarin, O., Bekun, F.V., 2020b.Structural breaks in CO2 emissions: are they caused by climate change protests or other factors? J. Environ. Manag. 266, 110628.
Adedoyin, F.F., Gumede, M.I., Bekun, F.V., Etokakpan, M.U., Balsalobre-lorente, D., 2020c.
Modelling coal rent, economic growth and CO2 emissions: does regulatory quality matter in BRICS economies? Sci. Total Environ. 710, 136284.
Aghahosseini, A., Bogdanov, D., Breyer, C., 2020.Towards sustainable development in the MENA region: analysing the feasibility of a 100% renewable electricity system in 2030. Energy Strategy Reviews 28, 100466.
Al-Mulali, U., Ozturk, I., Solarin, S.A., 2016.Investigating the environmental Kuznets curve hypothesis in seven regions: the role of renewable energy. Ecol. Indic. 67, 267–282.
Alola, A.A., 2019a.The trilemma of trade, monetary and immigration policies in the United States: accounting for environmental sustainability. Sci. Total Environ. 658, 260–267.
Alola, A.A., 2019b.Carbon emissions and the trilemma of trade policy, migration policy and health care in the US. Carbon Management 10 (2), 209–218.
Alola, A.A., Alola, U.V., 2018.Agricultural land usage and tourism impact on renewable en-ergy consumption among Coastline Mediterranean Countries. Enen-ergy & Environment 29 (8), 1438–1454.
Alola, A.A., Yildirim, H., 2019.The renewable energy consumption by sectors and house-hold income growth in the United States. International Journal of Green Energy 16 (15), 1414–1421.
Alola, A.A., Bekun, F.V., Sarkodie, S.A., 2019a.Dynamic impact of trade policy, economic growth, fertility rate, renewable and non-renewable energy consumption on ecolog-ical footprint in Europe. Sci. Total Environ. 685, 702–709.
Alola, A.A., Yalçiner, K., Alola, U.V., Saint Akadiri, S., 2019b.The role of renewable energy, immigration and real income in environmental sustainability target. Evidence from Europe largest states. Sci. Total Environ. 674, 307–315.
Banker, R.D., Charnes, A., Cooper, W.W., 1984.Some models for estimating technical and scale inefficiencies in data envelopment analysis. Manag. Sci. 30 (9), 1078–1092.
Bekun, F.V., Alola, A.A., Sarkodie, S.A., 2019.Toward a sustainable environment: Nexus be-tween CO2 emissions, resource rent, renewable and nonrenewable energy in 16-EU countries. Sci. Total Environ. 657, 1023–1029.
Breusch, T.S., Pagan, A.R., 1980.The Lagrange multiplier test and its applications to model specification in econometrics. Rev. Econ. Stud. 47 (1), 239–253.
Charnes, A., Cooper, W.W., Rhodes, E., 1978.Measuring the efficiency of decision making units. Eur. J. Oper. Res. 2 (6), 429–444.
Charnes, A., et al., 1985.Foundations of data envelopment analysis for Pareto-Koopmans efficient empirical production functions. J. Econ. 30 (1–2), 91–107.
Choi, I., 2001.Unit root tests for panel data. J. Int. Money Financ. 20 (2), 249–272.
Cooper, W.W., Seiford, L.M., Zhu, J., 2004.Data envelopment analysis. Handbook on Data Envelopment Analysis. Springer, pp. 1–39.
De Hoyos, R.E., Sarafidis, V., 2006.Testing for cross-sectional dependence in panel-data models. Stata J. 6 (4), 482–496.
Dietz, T., Rosa, E.A., 1994.Rethinking the environmental impacts of population, affluence and technology. Hum. Ecol. Rev. 1 (2), 277–300.
Dumitrescu, E.-I., Hurlin, C., 2012.Testing for Granger non-causality in heterogeneous panels. Econ. Model. 29 (4), 1450–1460.
EIA, 2019. Biomass explained:waste-to-energy (municipal solid waste). [cited 2020 March 9th]; Available from. https://www.eia.gov/energyexplained/biomass/waste-to-energy.php.
El-Katiri, L., 2014.A Roadmap for Renewable Energy in the Middle East and North Africa. Oxford institute for energy studies.
Energy Information Administration, 2018. U.S. energy-related carbon dioxide emissions, 2018.https://www.eia.gov/environment/emissions/carbon/index.php.
Etokakpan, M.U., Adedoyin, F.F., Vedat, Y., Bekun, F.V., 2020.Does globalization in Turkey induce increased energy consumption: insights into its environmental pros and cons. Environ. Sci. Pollut. Res. Int.
Farhangi, H., 2009.The path of the smart grid. IEEE power and energy magazine 8 (1), 18–28.
Farrell, M.J., 1957.The measurement of productive efficiency. Journal of the Royal Statis-tical Society. Series A (General) 120 (3), 253–290.
Ghaffour, N., et al., 2015.Renewable energy-driven desalination technologies: a compre-hensive review on challenges and potential applications of integrated systems. Desa-lination 356, 94–114.
Ibrahim, M.D., Daneshvar, S., 2018.Efficiency analysis of healthcare system in Lebanon using modified data envelopment analysis. Journal of healthcare engineering 2018.
Ibrahim, M.D., et al., 2019.Transnational resource generativity: efficiency analysis and target setting of water, energy, land, and food nexus for OECD countries. Sci. Total En-viron. 697, 134017.
Im, K.S., Pesaran, M.H., Shin, Y., 2003.Testing for unit roots in heterogeneous panels. J. Econ. 115 (1), 53–74.
Intergovernmental Panel on Climate Change (IPCC), 2020. Renewable energy sources and climate change mitigation. https://www.ipcc.ch/report/renewable-energy-sources-and-climate-change-mitigation/.
International Energy Agency(iea), 2019.Renewables Information 2019:Comprehensive Historical Review and Current Market Trends in Renewable Energy (cited 2020 17 March).
IRENA, 2019. Middle East and North Africa. 2019 [cited 2019 11 November]; Available from.https://www.irena.org/mena.
Johansen, S., Juselius, K., 1990.Maximum likelihood estimation and inference on cointegration—with applications to the demand for money. Oxf. Bull. Econ. Stat. 52 (2), 169–210.
Kahia, M., Aïssa, M.S.B., Charfeddine, L., 2016.Impact of renewable and non-renewable energy consumption on economic growth: new evidence from the MENA Net Oil Exporting Countries (NOECs). Energy 116, 102–115.
Levin, A., Lin, C.-F., Chu, C.-S.J., 2002.Unit root tests in panel data: asymptotic and finite-sample properties. J. Econ. 108 (1), 1–24.
Li, H., Dong, S., Liu, T., 2014.Relative efficiency and productivity: a preliminary explora-tion of public hospitals in Beijing, China. BMC Health Serv. Res. 14 (1), 158.
Li, Y., Chiu, Y.-h., Lin, T.-Y., 2019.Energy and environmental efficiency in different Chinese regions. Sustainability 11 (4), 1216.
Maddala, G.S., Wu, S., 1999.A comparative study of unit root tests with panel data and a new simple test. Oxf. Bull. Econ. Stat. 61 (S1), 631–652.
Martín, J.C., Roman, C., 2001.An application of DEA to measure the efficiency of Spanish airports prior to privatization. J. Air Transp. Manag. 7 (3), 149–157.
Moutinho, V., Madaleno, M., Robaina, M., 2017.The economic and environmental effi-ciency assessment in EU cross-country: evidence from DEA and quantile regression approach. Ecol. Indic. 78, 85–97.
Nathaniel, S.P., Iheonu, C.O., 2019.Carbon dioxide abatement in Africa: the role of renew-able and non-renewrenew-able energy consumption. Sci. Total Environ. 679, 337–345.
OECD, Organization for Economic Co-operation and Development, 1998.Ecoefficiency. OECD, Paris (1998).
Olfat, L., 2018.Interval type-2 fuzzy dynamic network data envelopment analysis with undesirable outputs considering double frontiers: an application to Iran airports’
sustainability evaluation. International Journal of Industrial Engineering: Theory, Ap-plications and Practice 24 (6).
Ozturk, I., 2010.A literature survey on energy–growth nexus. Energy Policy 38 (1), 340–349.
Pan, X., et al., 2019.Dynamic relationship among environmental regulation, technological innovation and energy efficiency based on large scale provincial panel data in China. Technol. Forecast. Soc. Chang. 144, 428–435.
Pedroni, P., 1999.Critical values for cointegration tests in heterogeneous panels with mul-tiple regressors. Oxf. Bull. Econ. Stat. 61 (S1), 653–670.
Pesaran, M.H., 2004.General Diagnostic Tests for Cross Section Dependence in Panels.
Pesaran, M.H., 2006.Estimation and inference in large heterogeneous panels with a mul-tifactor error structure. Econometrica 74 (4), 967–1012.
Pesaran, M.H., 2007.A simple panel unit root test in the presence of cross-section depen-dence. J. Appl. Econ. 22 (2), 265–312.
Pesaran, M.H., Smith, R., 1995.Estimating long-run relationships from dynamic heteroge-neous panels. J. Econ. 68 (1), 79–113.
Pesaran, M.H., Shin, Y., Smith, R.P., 1999.Pooled mean group estimation of dynamic het-erogeneous panels. J. Am. Stat. Assoc. 94 (446), 621–634.
Rashid, A., Kandemir,Ӧ., 2016.Variations in energy use and output growth dynamics: an assessment for intertemporal and contemporaneous relationship. Energy 102, 388–396.
Saint Akadiri, S., Alola, A.A., Akadiri, A.C., Alola, U.V., 2019.Renewable energy consump-tion in EU-28 countries: policy toward polluconsump-tion mitigaconsump-tion and economic sustain-ability. Energy Policy 132, 803–810.
Salahuddin, M., Alam, K., Ozturk, I., 2016.Is rapid growth in Internet usage environmen-tally sustainable for Australia? An empirical investigation. Environ. Sci. Pollut. Res. 23 (5), 4700–4713.
Sarkodie, S.A., Adams, S., 2018.Renewable energy, nuclear energy, and environmental pollution: accounting for political institutional quality in South Africa. Sci. Total Envi-ron. 643, 1590–1601.
Sharif, A., et al., 2019.The dynamic relationship of renewable and nonrenewable energy consumption with carbon emission: a global study with the application of heteroge-neous panel estimations. Renew. Energy 133, 685–691.
Tugcu, C.T., Ozturk, I., Aslan, A., 2012.Renewable and non-renewable energy consumption and economic growth relationship revisited: evidence from G7 countries. Energy Econ. 34 (6), 1942–1950.
UnitedNationsDevelopmentProgramme, 2020. Energy efficiency. [cited 2020 15 March]; Available from. https://www.undp.org/content/undp/en/home/2030-agenda-for-sustainable-development/planet/sustainable-energy/energy-efficiency.html. UnitedNationsEconomicCommissionforEurope, 2020. Energy efficiency. [cited 2020 15
March]; Available from.https://www.unece.org/energyefficiency.html.
Yang, Z., Wei, X., 2019.The measurement and influences of China’s urban total factor en-ergy efficiency under environmental pollution: based on the game cross-efficiency DEA. J. Clean. Prod. 209, 439–450.
Yanpirat, P., Choatheitmanut, A., 2014.Supply chain cost reduction by implementing in-tegrated activity based costing and data envelopment analysis: a case study. Engi-neering, Technology and Innovation (ICE), 2014 International ICE Conference on. IEEE.
York, R., Rosa, E.A., Dietz, T., 2003.STIRPAT, IPAT and ImPACT: analytic tools for unpacking the driving forces of environmental impacts. Ecol. Econ. 46 (3), 351–365.
Zhao, H., Guo, S., Zhao, H., 2019.Provincial energy efficiency of China quantified by three-stage data envelopment analysis. Energy 166, 96–107.
Zhou, G., Chung, W., Zhang, Y., 2014.Measuring energy efficiency performance of China’s transport sector: a data envelopment analysis approach. Expert Syst. Appl. 41 (2), 709–722.