Volume 60, Number 2, Pages 27-40 (2018) DOI: 10.1501/commua1-2_0000000113 ISSN 1303-6009 E-ISSN 2618-6462
http://communications.science.ankara.edu.tr/index.php?series=A2A3
Received by the editors: July 10, 2018; Accepted: October 30, 2018.
Key word and phrases: V960 Tau, β Cephei variables, Emission line, Be stars, Data analysis, STEREO satellite. © 2018 Ankara University Communications Faculty of Sciences University of Ankara Series A2-A3: Physical Sciences and Engineering PHOTOMETRIC AND SPECTROSCOPIC VARIABILITY OF A
POSSIBLE β CEPHEI STAR; V960 TAU
DOGUS OZUYAR
Abstract.In this study, high-precision photometric data of V960 Tau are presented in order to reveal the pulsation characteristics of the star. The data are taken from the HI-1A instrument of the STEREO satellite between 2007 and 2011. The results of the photometric analysis are compared with the findings derived from spectroscopic line measurements (equivalent width and line intensity) to have a better understanding of the relation between light curve variabilities and circumstellar disk structure. As a result of the photometric and spectroscopic analyses, it’s been found that frequency distribution and amplitude intensities are in close agreement with that expected from a typical Be star. The star has at least 14 independent pulsation frequencies, most of which are accumulated around the peaks at 1.01 and 1.95 cycle per day (c/d). With this configuration, the star exhibits 2:1 frequency distribution. Even though the frequency distribution is quite similar to a Slowly Pulsating B type star, V960 Tau may be considered as a β Cephei type variable based on its temperature and luminosity values. Additionally, the equivalent width and line intensity values of the emission lines appear to be correlated with the light curve variations. This may be an indication of photometric variations, related to the environmental disk structure.
1. Introduction
Classical Be stars are single, non-supergiant B type stars having line emissions in the Balmer series, especially in the Hα line, in their spectra [1]. These stars are located together with β Cephei and Slowly Pulsating B stars (SPB) on the H-R diagram, but can be distinguished from these variables by their relatively higher rotational velocities between 250 and 500 km/s [2]. Be stars exhibit both photometric and spectroscopic variabilities. The multi-periodic variations seen in their light curves (LCs) are related to the non-radial pulsations (NRPs). The periods of these variations are from a few minutes to several years. On the other hand, spectroscopic changes are known to be related to a dense disk structure surrounding the star ([3]; [4]).
In this study, photometric and spectroscopic data of V960 Tau have been collected between 2007 and 2011. By analyzing the data, it is aimed to have a better understanding of the pulsation characteristics and the connection between the circumstellar disk structure and NRPs of the star.
V960 Tau (HD 36576, Sp = B2IV/V, V = 5.67 mag) is a rarely studied bright Be star. The last specific study related to the star is conducted by [5]. They report that the LC of the star shows five peaks in Strömgren y and β filters [5], which are given to be 1.085, 0.093, 2.156, 3.131, 0.775 c/d in the y-filter and 1.094, 0.104, 2.143, 3.122, 0.772 c/d in the β-filter.
2. Material And Method
The photometric data of the star are obtained from the HI-1A camera of the STEREO satellite between 2007 and 2011. The seasonal data sets consist of about 20 days of continuous observations, and have 40 minutes of cadence. The Nyquist frequency of each set is around 18 c/d. The details about the satellite, instruments and data preparation can be accessed from [6] and [7].
The light curves obtained were decontaminated from internal and external effects caused by the circumstances mentioned by [7], using an IDL pipeline coded in house. Thus, it was aimed to identify as many oscillation frequencies as possible in the photometric data and to catch potential correlations with the spectroscopic observations. The seasonal and five-year combined time series were then analyzed with the Lomb-Scargle (LS) algorithm. For each periodogram, noise profiles were determined by averaging the noise values in every 0.5 c/d. Based on the noise characteristic, a significance level was calculated with 99% probability. During the analyses, a recursive method was applied to the light curves to detect every significant frequency. First, the frequency with the highest amplitude was identified from the Fourier spectrum of the original data. If this peak was higher than the significance level, it was subtracted from the time series by using a least-squares fit. Secondly, the same procedure was applied to the pre-whitened data. The next significant frequency with the highest amplitude was removed, and this routine was carried on until the last significant frequency was found. The details of the procedure can be found in [8].
The spectroscopic data consist of 10 high-resolution observations taken from the Be Star Spectra Database1. The spectra include the Hα line and have a resolution between 6 000 – 17 000. Before the analysis, heliocentric velocity corrections have
1http://basebe.obspm.fr/basebe/
been applied to the data, and telluric lines have also been removed by using a reference spectrum. The margin of error is considered to be 3% for the continuum normalization [9]. The SPLOT package of the IRAF2 (noao – onedspec - splot) and IDL (continuum-line equivalent width procedure) has been used for the equivalent width and the line intensity measurements.
3. Results 3.1. Photometric Results
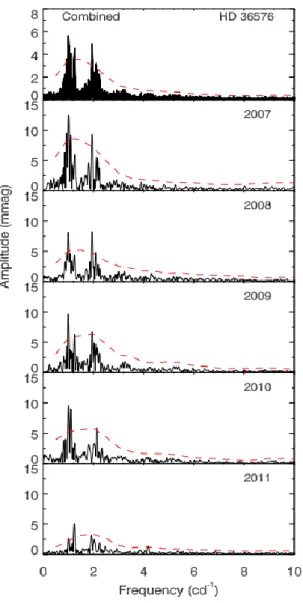
Frequency analysis of five years of data revealed that the combined LC comprised at least 14 frequencies. Since the long-term variations were removed from the data, it was not possible to detect any frequency smaller than 0.9 c/d (Table 1). However, some frequencies quite close to the archival results, given as 1.09 and 2.15 c/d [5] were determined. The combined periodogram had two distinct frequency groupings at around 1.01 and 1.95 c/d (Figure 1).
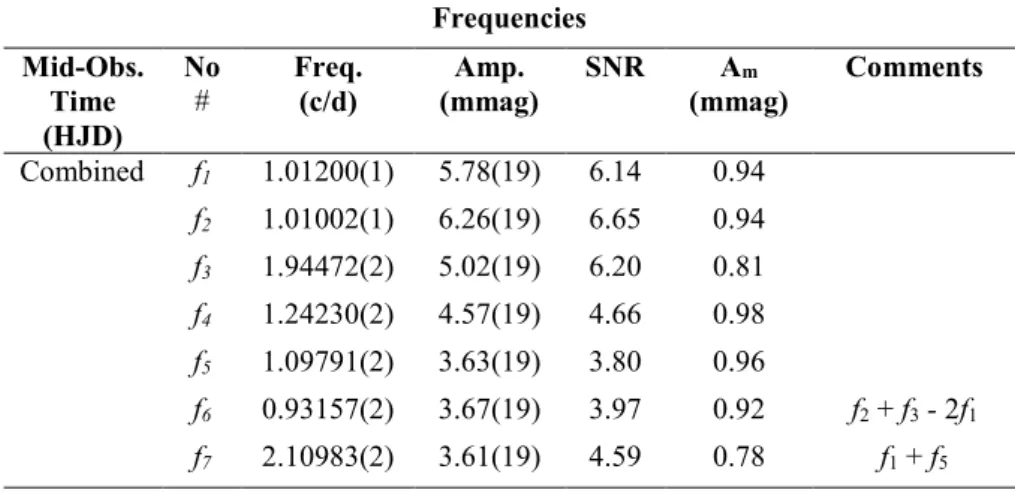
Table 1. Frequency analysis results for the five-year combined and seasonal data. The
mid-observation times in Heliocentric JD (HJD-2450000) are given in the first column. Frequencies, their amplitudes, signal-to-noise (SNR) values and mean amplitude levels for each frequency are presented in the third, fourth, fifth and the sixth columns, respectively. In the last column, there are comments related to the nature of the corresponding frequency. The errors for the frequencies and their amplitudes are given in the parenthesis.
Frequencies Mid-Obs. Time (HJD) No # Freq. (c/d) Amp. (mmag) SNR Am (mmag) Comments Combined f1 1.01200(1) 5.78(19) 6.14 0.94 f2 1.01002(1) 6.26(19) 6.65 0.94 f3 1.94472(2) 5.02(19) 6.20 0.81 f4 1.24230(2) 4.57(19) 4.66 0.98 f5 1.09791(2) 3.63(19) 3.80 0.96 f6 0.93157(2) 3.67(19) 3.97 0.92 f2 + f3 - 2f1 f7 2.10983(2) 3.61(19) 4.59 0.78 f1 + f5
2 IRAF is distributed by the National Optical Astronomy Observatories, which are operated by the Association of
Universities for Research in Astronomy, Inc., under cooperative agreement with the National Science Foundation. More information can be found from http://iraf.net/.
f8 1.01357(2) 3.23(19) 3.43 0.94 f3 - f6 f9 1.94712(2) 3.06(19) 3.78 0.81 f1 + f3 - f2 f10 0.93107(3) 2.94(19) 3.18 0.92 f6 f11 2.15476(3) 2.86(19) 3.71 0.77 2f3 + 2f4 - 2f7 f12 1.10755(3) 2.85(19) 2.98 0.96 f4 + 2f2 - f11 f13 2.24956(3) 2.53(19) 3.42 0.74 f11 + f12 - f1 f14 1.00551(3) 2.28(19) 2.43 0.94 2f2 - f8 2007 Frequencies 4246 f1 1.017(1) 13.59(58) 5.33 2.55 f2 0.929(2) 10.92(58) 4.33 2.52 f3 1.946(2) 9.53(58) 4.47 2.13 f1 + f2 2008 Frequencies 4590 f1 1.949(1) 8.06(38) 5.86 1.38 f2 1.004(1) 8.22(38) 5.48 1.50 f3 2.092(3) 3.80(38) 2.87 1.33 2009 Frequencies 4935 f1 1.003(1) 9.58(46) 5.76 1.66 f2 1.951(2) 7.15(46) 3.76 1.90 2f1 f3 1.245(2) 6.08(46) 3.34 1.82 2010 Frequencies 5279 f1 1.016(1) 9.43(45) 6.15 1.53 f2 1.112(2) 8.14(45) 4.96 1.64 f3 2.141(2) 6.48(45) 4.06 1.60 f1 + f2 2011 Frequencies 5624 f1 1.236(1) 5.01(21) 7.13 0.70 f2 1.917(2) 3.30(21) 3.81 0.87 f3 1.012(3) 2.30(21) 3.63 0.63
Similar configurations were also seen in the seasonal spectra. Even though the most dominant peak was the one at around 1.01 c/d during the five-year time period, its intensity decreased and 1.95 c/d became the strongest frequency in 2008 (Figure 2; the second panel from top). These rapid amplitude changes were also observed in other peaks below or above the significance levels (probability (p) < 0.01 or confidence level of 99%) (Figure 1).
Figure 1. The combined and seasonal amplitude spectra of V960 Tau. The significance level is given with dashed red lines that represent 99% probability.
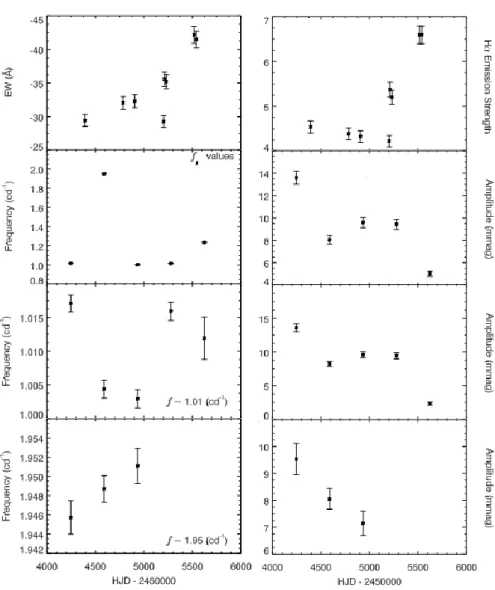
Figure 2. Comparison of photometric and spectroscopic result. The variations in the Hα
line are given in the first row and the potential changes in both frequencies and amplitudes are presented in the following rows.
The variations in the two dominant frequencies and their amplitudes are presented in Figure 2. The frequency at 1.01 c/d exhibited a sinusoidal variation over five years. It decreased from 1.017 to 1.003 c/d between HJD4246 and HJD4935. Subsequently, it shifted to around 1.016 c/d on HJD5279 and decreased to 1.012 c/d on HJD5624. The intensity of its amplitude dropped from 14 to 2 mmag. Similar to the amplitude change of the main frequencies, it showed an abnormal increase
between HJD4590 and HJD5279. On the other hand, the frequencies at 1.95 c/d displayed an increasing trend in frequency while its amplitude decreased from 9.5 mmag on HJD4246 to 7.1 mmag on HJD4935. In the following years (in 2010 and 2011), the frequency was not detected (Figure 2).
3.2. Spectroscopic Results
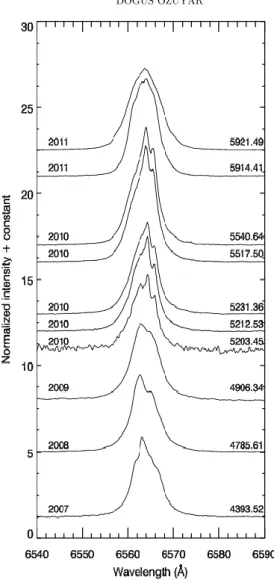
The spectroscopic data of V960 Tau, taken between 2007 and 2011 have also been analyzed (Figure 3). The Hα line was formed of a single-peaked profile with an extra emission, which causes distorting effects on the wings. To have a better understanding of the possible changes in the emission profile, the EW values of the Hα at the full width at half maximum were measured. Since its resolution is quite low (R = 800), the spectrum obtained on HJD5921.49 was not used in the calculations.
Based on nine measurements, a clear increasing trend in EW values with a variation degree of F = 23.13 and a confidence level of C > 99% in EW values were detected (Figure 2; the first row). This change was correlated with the increase in the frequency at 1.95 c/d, and inversely proportional to its amplitude variation. Moreover, emission strength had one of the most spectacular changes, as seen in Figure 2. The intensity slightly decreased between HJD4400 -HJD5200 and became considerably stronger in the following years. This decrease observed in emission strength showed similarity with the peculiar amplitude changes of the main frequencies and the 1.01 c/d in the same time period.
The radius (𝑅⋆ in solar radius) and the rotational period (𝑃𝑟𝑜𝑡) in days of the star were estimated from the relation given by [10] as;
𝑀
𝑀⊙
=
𝑣𝑐𝑟2×𝑅⋆×6.96×108
𝐺×1.99×1030
,
(3.1) and the equation of𝑃𝑟𝑜𝑡= 50.6 × 𝑅⋆
𝑉𝑒𝑞=
1
Figure 3. The Hα emission profiles obtained in the same time interval with the photometric data. The numbers given on the right-hand side are the mid-observation times in Heliocentric JD (HJD-2450000).
taken from the [11] by assuming the mass M = 10.1(7) Mʘ, the rotational velocity v sini = 266(13) km/s, and the critical velocity vcr = 487 km/s [12]. Accordingly, the
radius and rotational frequency (frot) of the star were calculated from the Eqn. 3.1
and Eqn. 3.2 to be R = 8.12(61) Rʘ and frot = 0.65(6) c/d, respectively. This frequency
could not be observed in the periodograms since the long-term variations were removed from the data sets.
4. Conclusion And Comments
This study unveils several oscillations taking place in V960 Tau. Since these variations have not previously been observed in detail, they provide valuable information to reveal the pulsation characteristics of the star.
The most important feature seen in both seasonal and combined periodograms is the explicit frequency groupings. This frequency configuration manifests itself as a 2:1 group in the power spectra, and can be clearly noticed in Figure 1. There are several ground- and space-based studies reporting frequency groupings similar to frequency configuration of V960 Tau. Rather than surface or circumstellar inhomogeneity, these frequencies are generally attributed to NRPs in these studies. For instance, Rivinius et al. [13] have detected two frequency groups at around 1.98 and 3.57 c/d in µ Cen, and identified these to be retrograde g-modes with l = |m| = 2. For the MOST objects HD 127756 and HD 217543, the frequency peaks have been predominantly around 1.0 - 2.0 c/d and 2.0 - 4.0 c/d, respectively. These groups have been modeled as prograde g-modes with |m| = 1 and |m| = 2 [14]. In addition to these, Hipparcos data of HD 217675 have showed that the star has pulsated around two dominant frequencies, 0.79 and 1.57 c/d [15]. These examples can be extended with KIC 6954726 [16] and several CoRoT stars studied by [17], [18], [19], and [20]. Be-variables share the same region with SPB and β Cephei stars on the H-R diagram. It is therefore expected that the heat mechanism triggers p- and g-modes in Be-stars [21]. However, most of the well-studied early-type Be-stars have pulsation periods between 0.5 and 3.5 c/d, which are also observed in SPB-type oscillations [15]. In SPB stars, the source of the oscillations is the heat mechanism near the Fe opacity bump (also called the Z bump), which initiates high-order, non-radial g-mode pulsations. Unlike SPB stars, the prograde modes are dominantly excited among the high-order g-modes in Be-types due to their rotation rate. These modes have frequencies of around |m|Ω in the observer’s frame. Here, |m| is the azimuthal order and Ω is the rotation frequency [14]. In a rapidly rotating star, frequencies in the co-rotating frame (fg) of high-order g-modes are smaller than |m|Ω. Therefore, the frequencies in the observer’s frame are fg − mΩ ≈ -mΩ, and they generate a group close to ≈ |m|Ω or separated from other groups by ≈ |m|Ω [22]. As a result, the period of light variation becomes close to rotational period or half of it [14].
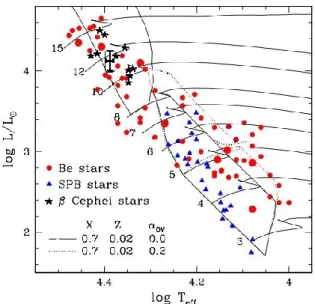
In order to understand the evolutionary state of the star, the position of the star on the H-R diagram has been investigated. Its temperature value (log Teff = 4.389(7)) has been adopted from [12] and its luminosity value (log (L/Lʘ) = 4.102(123)) has been estimated from its Hipparcos parallax (π = 2.10(32) mas) and spectral type by
following [23]. These parameters have then been used in the model produced by [24] for comparison (Figure 4). According to the Figure 4, V960 Tau is situated in the β Cephei instability strip. On the other hand, the release of the Gaia data gives a new point of view in the positions and proper motions of the stars in the sky [25]. If the parallax value obtained from the Gaia data is considered, it is seen that a much more sensitive parallax value of π = 2.28(18) mas is derived. If the luminosity of the star is recalculated by taking this new parallax into account, the luminosity value of log (L/Lʘ) = 4.030(65) is obtained. Accordingly, V960 Tau is slightly less luminous than it has been. However, the current position of the star on the H-R diagram has not changed much, and even remained within error limits.
β Cephei type stars are known to exhibit periodic light variations on time scales of 0.1 days (10 c/d) to 0.3 (3.3 c/d) days. However, the periods of the variations seen in the star vary between ~1 and 2.24 c/d, corresponding to SPB type stars. The inconsistency in the position of the star is not clear, but may be explained by the large uncertainties on its physical parameters. Balona [26] states that there are several factors that affect luminosity and temperature of Be-stars. First of all, they rotate faster than the stars used for calibrations, and thus their radii are systematically greater. Therefore, computations based on these values may lead to incorrect temperature or luminosity. Furthermore, their spectral types and luminosity classes are poorly constrained in most cases. The uncertainty in the classification can reach two or three spectral subtypes and one or two luminosity classes. In addition, spectral type depends on the degree of rotation and the inclination angle of the rotation axis with respect to the observer’s line of sight, i.e., a rapidly rotating Be-star with equator-on position can be mistaken for a later type Be-star that has a slow rotation.
As previously mentioned, Be stars are characterized by high rotation and are believed to rotate close to their critical velocities. However, the actual equatorial rotation velocities can be difficult to estimate due to the effects of gravity darkening. Also, most of the sample stars rotate below the critical limits [27]. Since pulsations are excited even in late-type Be stars, as in β CMi [28], it is believed that they probably play an important role in mass ejection and are the additional mechanism required for disk formation.
Figure 4. Position of V960 Tau on the H-R diagram. Triangle and star symbols are the samples of SPB and β Cephei type stars. Archival Be-stars and V960 Tau are given with red filled circles and black plus symbol enclosed with a black straight line, respectively. The Be-stars with NRPs found by MOST and CoRoT satellites are represented with large filled circles. The Be-stars with NRPs found by MOST and CoRoT satellites are represented with large filled circles. Theoretical models are generated based on X = 0.7 and Z = 0.02. Solid lines are evolutionary tracks and instability boundaries for p- and g-modes produced from models without core overshooting, and dotted lines are from models with core overshooting of 0.2 Hp (adapted from Figure 1 of [24]).
In order to confirm such a suggestion, several spectroscopic and photometric investigations have been conducted. Rivinius et al. [13] indicate that the beating of pulsating modes can be the cause of the mass-loss episodes in µ Cen in a spectroscopic study. Goss et al. [29] report that α Eri shows correlations between the pulsation amplitude and disk activity. Also, CoRoT 102719279 exhibits a strong pulsational amplitude increase, coincident with a general fading, believed to be caused by the newly ejected matter [20]. For HD 49 330, the observed strength of the short-period p-modes decreases while those of longer transient periods arise during outbursts [17]. From the studies given above and several others, the presence of pulsational variability and disk structure are highly likely to be strongly entwined. Therefore, we expect that changes in the pulsational characteristics of a Be star might result in consistent changes in disk structure (as measured by Hα line profile changes).
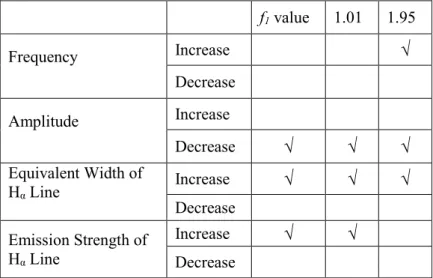
Table 2. The correlation between the changes in the photometric frequencies, their
amplitudes, the equivalent width (EW) and emission strength values of the Hα line.
f1 value 1.01 1.95 Frequency Increase
√
Decrease Amplitude Increase Decrease√
√
√
Equivalent Width of Hα Line Increase√
√
√
Decrease Emission Strength of Hα Line Increase√
√
DecreaseFor this reason, in this study, the variations in both light curves and Hα profiles over five years have been traced in order to find a connection between NRPs and disk evolution. The star has been found to be displaying significantly similar variation patterns in different observables. For example; the frequency at 1.95 c/d linearly increases, as do the EW values (Table 2). In contrast to this, the amplitude of this frequency exhibits an inversely proportional change compared to EWs. Moreover, the amplitudes of f1 values and 1.01 c/d also have a decreasing profile in contrast to those seen in the EW and the intensity of the Hα line. The abnormal decrease in emission strength between HJD4400 - HJD5200 takes place in the same time interval with those detected in the amplitudes of f1 values and 1.01 c/d.
Since there is not enough observational data available for V960 Tau, it is not possible to make a final decision related to the connection between NRPs and circumstellar material around the star. Therefore, more photometric and spectroscopic observations with better quality, time-coverage and resolution are needed to confirm such a relationship.
Acknowledgements. I acknowledge assistance from Prof. Dr. Ian R. Stevens, Dr. Vino
Sangaralingam and Dr. Gemma Whittaker in the production of the data used in this study.
References
[1] M. Jaschek, C. Jaschek, A. M. Hubert-Delplace, and H. Hubert, A classification of Be stars, Astronomy and Astrophysics Supplement Series, vol. 42, pp.103-114, October 1980.
[2] O. Struve, On the Origin of Bright Lines in Spectra of Stars of Class B, Astrophysical Journal, vol. 73, pp. 94, March 1931.
[3] J. M. Porter and T. Rivinius, Classical Be Stars, The Publications of the Astronomical Society of the Pacific, vol. 115, pp. 1153-1170, October 2003. [4] A. C. Carciofi, A. T. Okazaki, J. B. Le Bouquin, S. Stefl, T. Rivinius, D. Baade,
J. E. Bjorkman, and C. A. Hummel, Cyclic variability of the circumstellar disk of the Be star ζ Tauri. II. Testing the 2D global disk oscillation model, Astronomy and Astrophysics, vol. 504, pp. 915-927, September 2009.
[5] M. Bossi, G. Guerrero, and G. Bianchini, Photometric Multiperiodicity of the Be Star 120 Tauri, Information Bulletin on Variable Stars, vol. 3348, pp. 1, July 1989.
[6] C. J. Eyles, R. A. Harrison, C. J. Davis, N. R. Waltham, B. M. Shaughnessy, H. C. A. Mapson-Menard, D. Bewsher, S. R. Crothers, J. A. Davies, G. M. Simnett, R. A. Howard, J. D. Moses, J. S. Newmark, D. G. Socker, J.-P. Halain, J.-M. Defise, E. Mazy, and P. Rochus, The Heliospheric Imagers Onboard the STEREO Mission, Solar Physics, vol. 254, pp. 387-445, February 2009. [7] V. Sangaralingam and I. R. Stevens, STEREO Transiting Exoplanet and Stellar
Survey (STRESS) - I. Introduction and data pipeline, Monthly Notices of the Royal Astronomical Society, vol. 418, pp. 1325-1334, December 2011.
[8] D. Ozuyar, STEREO observations of hybrid stars V775 Tau and V483 Tau, Astrophysics and Space Science, vol. 363, pp. 205, 2018.
[9] C. E. Jones, C. Tycner, and A. D. Smith, The Variability of Hα Equivalent Widths in Be Stars, The Astronomical Journal, vol. 141, pp. 150, May 2011. [10] A. Maeder, Physics, Formation and Evolution of rotating Stars, Astronomy and
Astrophysics Library, XXI, pp. 832, ISBN 978-3-540-76948-4, Springer Berlin Heidelberg, 2009.
[11] K. Stepien, Radii and space orientation of the rotational axes of AP stars, Astronomy and Astrophysics, vol. 220, pp. 105, 1989.
[12] Y. Fremat, J. Zorec, A. M. Hubert, and M. Floquet, Effects of gravitational darkening on the determination of fundamental parameters in fast-rotating B-type stars, Astronomy and Astrophysics, vol. 440, pp. 305-320, September 2005.
[13] T. Rivinius, D. Baade, S. Stefl, O. Stahl, B. Wolf, and A. Kaufer, Stellar and circumstellar activity of the Be star MU Centauri. II. Multiperiodic low-order line-profile variability, Astronomy and Astrophysics, vol. 336, pp. 177, 1998 [14] C. Cameron, H. Saio, R. Kuschnig, G. A. H. Walker, J. M. Matthews, D. B.
Guenther, A. F. J. Moffat, S. M. Rucinski, D. Sasselov, and W. W. Weiss, MOST Detects SPBe Pulsations in HD 127756 and HD 217543: Asteroseismic Rotation Rates Independent of vsini, The Astrophysical Journal, vol. 685, pp. 489-507, September 2008.
[15] A. M. Hubert and M. Floquet, Investigation of the variability of bright Be stars using HIPPARCOS photometry, Astronomy and Astrophysics, vol. 335, pp. 565-572, July 1998.
[16] L. A. Balona et al., Kepler observations of the variability in B-type stars, Monthly Notices of the Royal Astronomical Society, vol. 413, pp. 2403, 2011. [17] A. L. Huat et al., The B0.5IVe CoRoT target HD 49330. I. Photometric analysis
from CoRoT data, Astronomy and Astrophysics, vol. 506, pp. 95, 2009. [18] P. D. Diago et al., Pulsations in the late-type Be star HD 50 209 detected by
CoRoT, Astronomy and Astrophysics, vol. 506, pp. 125, 2009.
[19]C. Neiner et al., The pulsations of the B5IVe star HD 181231 observed with CoRoT and ground-based spectroscopy, Astronomy and Astrophysics, vol. 506, pp. 143, 2009.
[20] J. Gutierrez-Soto, T. Semaan, R. Garrido, F. Baudin, A. Hubert, C. Neiner, Amplitude variations of the CoRoT Be star 102719279, arXiv, arXiv:1010.1910, 2010.
[21] C. Neiner and A.-M. Hubert, The pulsations of Be stars, Communications in Asteroseismology, vol. 158, pp. 194, July 2009.
[22] H. Saio, A- and B-type star pulsations in the Kepler and CoRoT era: theoretical considerations, In G. Mathys, E. R. Griffin, O. Kochukhov, R. Monier, and G. M. Wahlgren, editors, Putting A Stars into Context: Evolution, Environment, and Related Stars, pp. 305-313, November 2014
[23] P. J. Flower, Transformations from Theoretical H-R Diagrams to C-M Diagrams, Astronomy and Astrophysics, vol. 54, pp. 31, January 1977.
[24] H. Saio, Prospects for Asteroseismology of Rapidly Rotating B-Type Stars. In M. Goupil, K. Belkacem, C. Neiner, F. Ligni`eres, and J. J. Green, editors, Lecture Notes in Physics, Berlin Springer Verlag, vol. 865 of Lecture Notes in Physics, Berlin Springer Verlag, pp. 159, 2013.
[25] Gaia Collaboration, VizieR Online Data Catalog, 1345, 2018.
[26] L. A. Balona, Short-period variability in Be stars, Monthly Notices of the Royal Astronomical Society, vol. 245, pp. 92-100, July 1990.
[27] S. R. Cranmer, “A Statistical Study of Threshold Rotation Rates for the Formation of Disks around Be Stars”, The Astrophysical Journal, vol. 634, pp. 585, 2005.
[28] H. Saio et al., “MOST Detects g-Modes in the Late-Type Be Star β Canis Minoris (B8 Ve)”, Astrophysical Journal, vol. 654, pp. 544, 2007.
[29] K. J. F. Goss, C. Karoff, W. J. Chaplin, Y. Elsworth, I. R. Stevens, “Variations of the amplitudes of oscillation of the Be star Achernar”, Monthly Notices of the Royal Astronomical Society, vol. 411, pp. 162, 2011
Current Address: DOGUS OZUYAR: Ankara University, Astronomy and Space Sci. Dept., Tandogan, Ankara, 06100, Turkey
E-mail: [email protected]