Tar. Bil. Der. Dergi web sayfası:
www.agri.ankara.edu.tr/dergi www.agri.ankara.edu.tr/journalJournal homepage:
TARIM BİLİMLERİ DERGİSİ
—
JOURNAL OF AGRICUL
TURAL SCIENCES
18 (2012) 177-186
Salinity Impact on Yield, Water Use, Mineral and Essential Oil Content
of Fennel (Foeniculum vulgare Mill.)
Gülüzar Duygu SEMİZa, Ali ÜNLÜKARAb, Engin YURTSEVENa, Donald L. SUAREZc, İsa TELCİd
aAnkara University, Faculty of Agriculture, Department of Farm Structure and Irrigation, Diskapi, Ankara, TURKEY bErciyes University, Faculty of Agriculture, Department of Biosystem Engineering, Develi, Kayseri, TURKEY cLaboratory Director, USDA-ARS U.S. Salinity Laboratory 450 W. Big Springs Rd. Riverside, USA dGaziosmanpaşa University, Faculty of Agriculture, Department of Crop Science, Tokat, TURKEY
ARTICLE INFO
Research Article ‒ Crop Production
Corresponding Author: Gülüzar Duygu Semiz,E-mail: [email protected], Tel: +90(312) 596 1752
Received: 16 July 2012, Received in Revised Form: 10 August 2012, Accepted: 19 December 2012
ABSTRACT
The experimental study was carried out to determine the effects of salinity on water consumption, plant height, fresh and seed yields, biomass production, ion accumulation and essential oil content of fennel (Foeniculum vulgare Mill.) under greenhouse conditions. The experiment was conducted with a fully randomized factorial design with five replications. Saline waters (0.25, 1, 2, 4, 6, 8, 10 and 12 dSm-1) were composed using NaCl and CaCl
2 salts keeping SAR value under than 1. Increasing salinity levels led to a decrease in water consumption, plant height, fresh yield, biomass production, seed yield, 1000-grain (seed) yield and Mg accumulations in leaves. We calculated a threshold soil salinity for fennel (Foeniculum vulgare Mill.) of 2.64 dSm-1 (salinity at which yield starts to decrease) with slope of 4.5% (yield decline per unit increase in EC). These results suggest that fennel is moderately sensitive to salinity.
Keywords: Essential oil; Fennel (Foeniculum vulgare Mill.); Fresh yield; Salinity; Water consumption
Tuzluluğun Rezene Bitkisinin (Foeniculum vulgare Mill.) Verim, Su
Kullanımı, Mineral ve Uçucu Yağ İçeriğine Etkisi
ESER BİLGİSİ
Araştırma Makalesi ‒ Bitkisel Üretim
Sorumlu Yazar: Gülüzar Duygu Semiz, E-posta: [email protected] , Tel: +90(312) 596 1752 Geliş Tarihi: 16 Temmuz 2012, Düzeltmelerin Gelişi: 10 Ağustos 2012, Kabul: 19 Aralık 2012
ÖZET
Bu çalışmada tuzluluğun rezene (Foeniculum vulgare Mill.) bitkisinde su kullanımı, bitki boyu, yeşil aksam ve tohum verimi, biyokütle üretimi, mineral madde birikimi ve uçucu yağ içeriği üzerine etkisi sera koşullarında araştırılmıştır. Deneme tam tesadüfi faktöriyel deneme deseninde beş tekrarlı olarak kurulmuştur. Tuzlu sular (0.25, 1, 2, 4, 6, 8, 10 ve 12 dSm-1) NaCl ve CaCl
Ta r ı m B i l i m l e r i D e r g i s i – J o u r n a l o f A g r i c u l t u r a l S c i e n c e s 18 (2012) 177-186
178
1. Introduction
Fennel (Foeniculum vulgare Mill., belonging Apiaceae Family) is an important medicinal and aromatic plant. Mature fennel fruits (seeds) contain essential oil and are used as flavoring agents in food products such as liqueurs, bread, pickles, pastries, and cheese. They are also used as a constituent of cosmetic and pharmaceutical products. Fennel is one of the major essential oil plants cultivated and the essential oil concentration in the plants is between 3-6% in the mature fruit (Telci et al 2009).
Fennel is widely grown in arid and semi-arid regions where soils often contain a high concentration of salts (Ashraf 2002; Munns 2002; Qasim et al 2003). Fennel is also grown on a commercial scale in many regions including Europe (England, Austria, Finland, France, Germany and Tyrol), Asia (China, and Vietnam), South America, and Middle East (Turkey) for the production of specialty products (Brender et al 1997). The present world market for fennel is valued at approximately US$ 80 million (Masood et al 2004; Khorshidi et al 2009). Fennel, indigenous to the Mediterranean, is a member of the Apiaceae (Umbelliferae) family largely used to impart flavor to a number of foods, such as soups, sauces, pickles, breads, cakes, etc. Diuretic, analgesic and antipyretic activity has also been found in fennel fruit as has antioxidant activity. The essential oil has antioxidant, antimicrobial and hepatoprotective activity (Lucinewton et al 2005).
Depending upon the composition of the saline solution, ion toxicities or nutritional deficiencies may arise because of a predominance of a specific ion or competition effects among cations or anions
(Bernstein et al 1974). Ionic effects are manifested more generally in leaf and meristem damage or as symptoms typical of nutritional disorders. Thus, high concentrations of Na or Cl may accumulate in leaves or portions thereof and result in `scorching’ or `firing’ of leaves; whereas, nutritional deficiency symptoms are generally similar to those that occur in the absence of salinity. Calcium deficiency symptoms are common when Na/Ca ratio is high in soil water (Shannon & Grieve 1999). Most salt tolerance data was, and is still, obtained from experiments in either sand culture where the soil water salinity is essentially equal to the irrigation water salinity, or else at high leaching fractions where plant uptake weighted salinity is at most 50 % greater than the irrigation water salinity (Suarez 2010a). Although few studies were conducted to investigate the effects of salinity on fennel, most studies examined the effects of NaCl (Graifenberg et al 1996; Ashraf & Akhtar 2004) or diluted see water (Zaki et al 2009) under sandy soils (>85% sand) which may result in Ca deficiency.
The impact of ion concentration and possible deficiencies can be seen by examination of reported salt tolerance. For example, Graifenberg et al. (1996) rated fennel, based on the response of two fennel cultivars, `Monte Blanco’ and `Everest’, as sensitive to NaCl-salinity. The relative yields
were reduced 18.9% and 17.8% for ECi and 15.7%
and 14.3% for ECe for each unit increase above
the threshold in ‘Monte Bianco’ and ‘Everest’, respectively. Zaki et al (2009) investigated the effect of diluted see water (1000 to 5000 ppm) on fennel. They reported a gradual decrease in fresh yield, with increasing irrigation water salinity, but did not report Tuz seviyesindeki artışa bağlı olarak su tüketimi, bitki boyu, yeşil aksam verimi, biyokütle üretimi, tohum verimi, 1000 dane ağırlığı ve yaprakta magnezyum içeriği bakımından azalma meydana gelmiştir. Çalışma sonucunda, rezene bitkisinin (Foeniculum vulgare Mill.) %4.5 eğimle (artan her bir birim EC değeri için verim kaybı) eşik tuzluluk değeri (verimin düşmeye başladığı tuzluluk düzeyi) 2.64 dSm-1 bulunmuştur. Bu sonuçlar rezene bitkisinin tuzluluğa ‘orta derecede hassas’ olduğunu göstermektedir.
Anahtar Kelimeler: Uçucu yağ; Rezene (Foeniculum vulgare Mill.); Yeşil aksam verimi; Tuzluluk; Su tüketimi © Ankara Üniversitesi Ziraat Fakültesi
Ta r ı m B i l i m l e r i D e r g i s i – J o u r n a l o f A g r i c u l t u r a l S c i e n c e s 18 (2012) 177-186
179
salinity threshold or slope value nor the soil salinity corresponding to that irrigation water. Under these conditions the salinity of the soil water is not known as it depends on the volume of applied water and the actual crop ET in addition to the irrigation water salinity.
The available literature is thus not sufficient to predict the effect of salinity on fennel yield under conditions related to natural environments. The aim of the study is to examine the effect of saline irrigation water with low SAR and at realistic leaching fractions, on fresh weight and seed yield, water consumption, drainage water quality, mineral and essential oil content of fennel (Foeniculum
vulgare Mill.) in soil under greenhouse conditions.
2. Material and Methods
The experiment was conducted in a greenhouse, located at the Experimental Station of Ankara University, in lysimeters which were 500 mm
in depth and 400 mm in diameter. Eight salinity
levels were examined, 0.25 1, 2, 4, 6, 8, 10 and 12 dSm-1 with five replications of each treatment.
Saline waters were prepared by mixing CaCl2+NaCl salts with tap water. SAR (sodium adsorption ratio, defined as Na/((Ca+Mg)/2)0.5 where concentrations
are expressed in m molc L-1) values of all treatments
were less than 1. Irrigation waters were stored in 220 L containers.
Irrigation water requirements were determined following the procedures of Ünlükara et al (2010). At the beginning of the experiment, lysimeters were initially saturated with tap water and covered in order to prevent evaporation. The water content of the lysimeters after drainage stopped was assumed
to be that at field capacity (WFC). Each lysimeter was
weighed before each irrigation event. The amount of irrigation water to be applied was determined by weighing the lysimeters just before irrigation. The amount of applied irrigation water (I) was calculated by the following equation:
LF
W
W
I
FC
1
113
Where LF is leaching fraction (volume of water drained/volume of water applied), WFC is the lysimeter
114
weight at field capacity, W is the lysimeter weight just before irrigation. A drain pan was placed
115
underneath each lysimeter to collect leachate. Collected drainage water volume and EC was measured
116
after irrigation. The plants were irrigated at 3– 4 day intervals throughout the experiment. To determine
117
leaf ion composition, undamaged leaves were collected at harvest. These samples were washed with tap
118
water and then deionized water in turn, then oven dried at 60 C and ground. The 0.500 g ground samples
119
were dry-ashed in a muffle furnace at 500 oC for 5 h, dissolved in 5 mL of 2 M HNO
3, and finally diluted
120
to 25 mL with deionized water. Extracts were filtered and stored in plastic containers until analyzed.
121
Potassium and Na were analyzed by flame photometry, Ca and Mg by EDTA titration, and Cl by AgNO3
122
titration (U. S. Salinity Laboratory Staff, 1954). The plant biomass was determined by weighing the
123
plants after being oven-dried at 65 °C (weights recording when they reached a constant weight). When
124
plants were at the mature stage, they were harvested and, fresh weights (g plant-1), seed yields (g plant-1),
125
1000 fruit weigh (g) and plant heights (cm) were recorded for each treatment.
126
Essential oil isolation: Distillation of oil was carried out using the Clevenger apparatus. Deionized water
127
(100 mL) was added to 10 g of crushed fruit (1:10). Distillation was for approximately 5 h, boiling at 100
128
oC. The oil phase was separated, dried over anhydrous sodium sulfate, and kept in a dark glass bottle at 4
129
°C for the GC analyses.
130
Determination of t-anethole in essential oils by GC: Gas chromatographic analysis of the essential oils
131
was performed using an Agilent 6890 N chromatograph equipped with flame-ionization detection (GC–
132
FID). Compounds were separated in DB-Wax capillary column (30 m, 0.25 mm and 0.25 µm film
133
thickness) with helium as carrier gas at a constant flow rate of 1 mL/min.
134
The oven temperature program was 45 oC (2 min), 45– 250 oC (3 min), 250 oC (34 min), the injector and
135
detector temperatures were 250 oC. Major components were identified and identification of the
136
component was based on comparison of their relative retention times (RT) with those of standards from
137
our laboratory. Concentrations given are averages from four replicate analyses.
138
Physical and chemical characteristics of the experimental soil are presented in Table 1.
139
Statistical analyses of the results were conducted with SPSS 9.05 . One way ANOVA test for variance
140
analyses and Duncan Multiple Range Test for mean separations were performed.
141
Where LF is leaching fraction (volume of water drained/volume of water applied), WFC is the
lysimeter weight at field capacity, W is the lysimeter
weight just before irrigation. A drain pan was placed underneath each lysimeter to collect leachate. Collected drainage water volume and EC was measured after irrigation. The plants were irrigated at 3– 4 day intervals throughout the experiment. To determine leaf ion composition, undamaged leaves were collected at harvest. These samples were washed with tap water and then deionized water in turn, then oven dried at 60 °C and ground. The 0.500 g ground samples were dry-ashed in a muffle furnace at 500 oC for 5 h, dissolved in 5 mL of 2 M
HNO3, and finally diluted to 25 mL with deionized
water. Extracts were filtered and stored in plastic containers until analyzed. Potassium and Na were analyzed by flame photometry, Ca and Mg by EDTA titration, and Cl by AgNO3 titration (U. S. Salinity Laboratory Staff, 1954). The plant biomass was determined by weighing the plants after being oven-dried at 65 °C (weights recording when they reached a constant weight). When plants were at the mature stage, they were harvested and, fresh weights (g plant-1), seed yields (g plant-1), 1000 fruit
weigh (g) and plant heights (cm) were recorded for each treatment.
Essential oil isolation: Distillation of oil was carried out using the Clevenger apparatus. Deionized water (100 mL) was added to 10 g of crushed fruit (1:10). Distillation was for approximately 5 h,
boiling at 100 oC. The oil phase was separated, dried
over anhydrous sodium sulfate, and kept in a dark glass bottle at 4 °C for the GC analyses.
Determination of t-anethole in essential oils by GC: Gas chromatographic analysis of the essential oils was performed using an Agilent 6890 N chromatograph equipped with flame-ionization detection (GC–FID). Compounds were separated in DB-Wax capillary column (30 m, 0.25 mm and 0.25 µm film thickness) with helium as carrier gas at a
constant flow rate of 1 mL min-1.
The oven temperature program was 45 oC (2
Ta r ı m B i l i m l e r i D e r g i s i – J o u r n a l o f A g r i c u l t u r a l S c i e n c e s 18 (2012) 177-186
180
injector and detector temperatures were 250 oC.
Major components were identified and identification of the component was based on comparison of their relative retention times (RT) with those of standards from our laboratory. Concentrations given are averages from four replicate analyses.
Physical and chemical characteristics of the experimental soil are presented in Table 1.
Statistical analyses of the results were conducted with SPSS 9.05 . One way ANOVA test for variance analyses and Duncan Multiple Range Test for mean separations were performed.
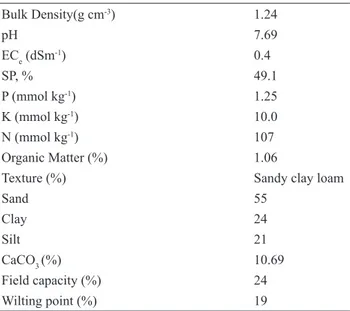
Table 1- Initial chemical and physical characteristics of the experimental soil
Çizelge 1- Deneme toprağının başlangıç kimyasal ve fiziksel özellikleri
Bulk Density(g cm-3) pH ECe (dSm-1) SP, % P (mmol kg-1) K (mmol kg-1) N (mmol kg-1) Organic Matter (%) Texture (%) Sand Clay Silt CaCO3 (%) Field capacity (%) Wilting point (%) 1.24 7.69 0.4 49.1 1.25 10.0 107 1.06
Sandy clay loam 55 24 21 10.69 24 19
3. Results and Discussion
3.1. Soil and drainage water salinity
Most salt tolerance data was, and is still at this time, collected either in sand culture where the soil water salinity is essentially equal to the irrigation water salinity, or else at high leaching fractions where plant uptake weighted salinity is at most 50% greater than the irrigation water salinity (Suarez 2010b). Plants response to salinity is traditionally expressed in terms of electrical conductivity of saturated soil extract (Ayers & Westcot 1989), which is usually sampled at the end of the irrigation season in order not to disturb the soil media or plant roots. Plant salt tolerance data has to reflect the actual soil water salinity that the plants experience,
which means that neither soil extract (ECe) nor
can irrigation (ECi) water salinities alone be the defining factor for salt tolerance of plants. Ayers & Westcot (1989) proposed a method to calculate average root zone salinity using the average of five soil points assuming that leaching fractions of 4 quarters differentiate with a water uptake pattern (0.4, 0.3, 0.2 and 0.1). Based on the method, each quarter has own equivalent of a leaching fraction and ECsw value, then average root zone salinity
is calculated simply taking the average of those 4 ECsw values. We determined the leaching fractions
and soil water salinities of each quarter using Ayers & Westcot (1989) method but then also calculate a weighted root zone salinity using the same water uptake factors used to calculate the salinity values
Ta r ı m B i l i m l e r i D e r g i s i – J o u r n a l o f A g r i c u l t u r a l S c i e n c e s 18 (2012) 177-186
181
in each quarter to create a weighted average salinity(Table 2). Thus, salinity experienced by the plant is estimated “water uptake weighted salinity”. We consider this water uptake weighted soil salinity method to be most representative for salt tolerance response.
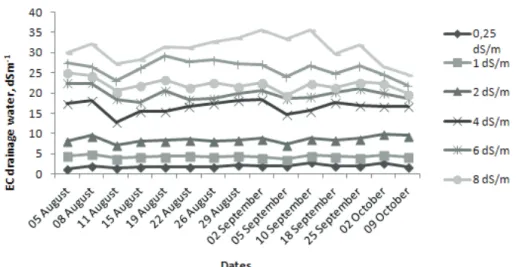
During the experiment, drainage waters were collected after each irrigation event and the EC of these waters were measured. The changes in drainage water salinity with time are shown in Figure 1.
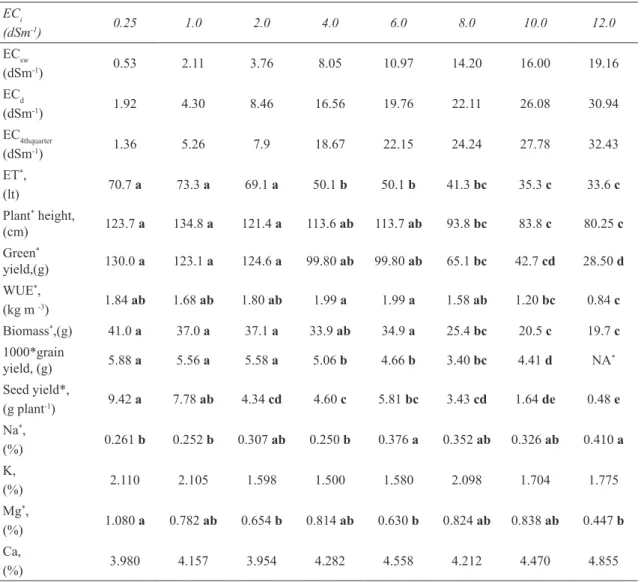
Table 2- Experimental results including Duncan group at P<0.01 statistical importance level for fennel (Foeniculum vulgare Mill.)
Çizelge 2- Rezene (Foeniculum vulgare Mill.) için P<0.01 önemlilik düzeyindeki Duncan grupları ile birlikte deneme sonuçları ECi (dSm-1) 0.25 1.0 2.0 4.0 6.0 8.0 10.0 12.0 ECsw (dSm-1) 0.53 2.11 3.76 8.05 10.97 14.20 16.00 19.16 ECd (dSm-1) 1.92 4.30 8.46 16.56 19.76 22.11 26.08 30.94 EC4thquarter (dSm-1) 1.36 5.26 7.9 18.67 22.15 24.24 27.78 32.43 ET*, (lt) 70.7 a 73.3 a 69.1 a 50.1 b 50.1 b 41.3 bc 35.3 c 33.6 c Plant* height, (cm) 123.7 a 134.8 a 121.4 a 113.6 ab 113.7 ab 93.8 bc 83.8 c 80.25 c Green* yield,(g) 130.0 a 123.1 a 124.6 a 99.80 ab 99.80 ab 65.1 bc 42.7 cd 28.50 d WUE*, (kg m -3) 1.84 ab 1.68 ab 1.80 ab 1.99 a 1.99 a 1.58 ab 1.20 bc 0.84 c Biomass*,(g) 41.0 a 37.0 a 37.1 a 33.9 ab 34.9 a 25.4 bc 20.5 c 19.7 c 1000*grain yield, (g) 5.88 a 5.56 a 5.58 a 5.06 b 4.66 b 3.40 bc 4.41 d NA* Seed yield*, (g plant-1) 9.42 a 7.78 ab 4.34 cd 4.60 c 5.81 bc 3.43 cd 1.64 de 0.48 e Na*, (%) 0.261 b 0.252 b 0.307 ab 0.250 b 0.376 a 0.352 ab 0.326 ab 0.410 a K, (%) 2.110 2.105 1.598 1.500 1.580 2.098 1.704 1.775 Mg*, (%) 1.080 a 0.782 ab 0.654 b 0.814 ab 0.630 b 0.824 ab 0.838 ab 0.447 b Ca, (%) 3.980 4.157 3.954 4.282 4.558 4.212 4.470 4.855
* p<0.01 indicates statistical importance level **NA indicates no available data.
Ta r ı m B i l i m l e r i D e r g i s i – J o u r n a l o f A g r i c u l t u r a l S c i e n c e s 18 (2012) 177-186
182
Average of drainage water salinities are shown in Table 2. We also demonstrated 4th quarter (the
bottom quarter) of the root zone salinities in Table 2 which are relatively equal to measured drainage water salinities. Salinities of the drainage waters increased with increasing salinity of the irrigation water. The study made by Yurtseven et al (2005) is in agreement with our current study, where we determined an increase in drainage water salinity with increasing irrigation water salinity. Salinity increases in drainage water relative to irrigation water are inevitable. Plants extract water preferentially, thus concentrating these salts in the remaining soil water. Typically, plants extract only 5–10% of the salt associated with the volume of water that they extract (Suarez 2010a).
3.2. Yield and plant growth
Yields and plant growth parameters including plant height, fresh weight yield, biomass, 1000-fruit yield and seed yield were affected significantly by irrigation water salinities at 0.01 probability level. All parameters related yield and growth were affected adversely by increasing salinity in irrigation water.
Maximum fresh weight (130 g plant-1) and
biomass (dry weight, 41 g plant-1) were obtained
from the control treatment with ECi= 0.25 dSm-1
(corresponding to ECsw=0.534 dSm-1). Duncan test
results indicated that the treatments including control
(0.25), 1 and 2 dSm-1 irrigation water salinities were
in the same group but the rest of the treatments were statistically different. Similar results were obtained for plant height but the tallest plant was from the
ECsw=2.11 dSm-1 treatment. Seed yield per plant was
greatest for the control treatment (9.42 g plant-1); at
salinities above ECsw=2.11 dSm-1 treatment (7.78
g plant-1), the seed yield was significantly reduced.
To be useful to the farmer, salt tolerance must be defined in terms of the reduction in growth or yield caused by a specified concentration of salts. Maas & Hoffman (1977) proposed a salinity response function that is represented by two linear lines, one a tolerance plateau with a slope of zero and the other a concentration-dependent line whose slope represents the yield reduction per unit increase in salinity (Maas in Tanji et al 1996). We utilized the fresh weight yield of fennel to characterize the relative yield response to soil salinity. We found a strong negative relation between soil salinity and relative yield (Figure 2). The determination
coefficient of the slope was R2=0.9364. The
threshold value of fennel is calculated as 2.64 dSm-1
(ECsw) with a slope of 4.50. Figures
419
420 421
Figure 1- Change in drainage water salinities with time as a function of irrigation water salinities.
422
Şekil 1- Sulama suyu tuzluluğuna gore drenaj suyu tuzluluklarındaki zamansal değişimler. 423 424 425 426 427
Figure 2- Relative yield of fennel as function of soil water salinity (P<0.01).
428
Şekil -. Rezene bitkisinin toprak suyu tuzluluğuna göre nispi verim tepkisi, P<0.01. 429 430 431 432 y = -4,5033x + 111,89 R² = 0,94 0 20 40 60 80 100 120 0 5 10 15 20 25 Relat ive fresh yie ld (% ) ECsw dSm-1
Figure 1- Change in drainage water salinities with time as a function of irrigation water salinities
Tuzluluğun Rezene Bitkisinin (Foeniculum vulgare Mill.) Verim, Su Kullanımı, Mineral ve Uçucu Yağ İçeriğine Etkisi, Semiz et al Ta r ı m B i l i m l e r i D e r g i s i – J o u r n a l o f A g r i c u l t u r a l S c i e n c e s 18 (2012) 177-186
183
418 Figures 419 420 421Figure 1- Change in drainage water salinities with time as a function of irrigation water salinities.
422
Şekil 1- Sulama suyu tuzluluğuna gore drenaj suyu tuzluluklarındaki zamansal değişimler.
423 424 425 426 427
Figure 2- Relative yield of fennel as function of soil water salinity (P<0.01).
428
Şekil -. Rezene bitkisinin toprak suyu tuzluluğuna göre nispi verim tepkisi, P<0.01.
429 430 431 432 y = -4,5033x + 111,89 R² = 0,94 0 20 40 60 80 100 120 0 5 10 15 20 25 Relat ive fresh yie ld (% ) ECsw dSm-1
Figure 2- Relative yield of fennel as function of soil water salinity (P<0.01)
Şekil 2- Rezene bitkisinin toprak suyu tuzluluğuna göre nispi verim tepkisi, P<0.01
3.3. Water consumption
Water consumption of fennel (Foeniculum vulgare Mill.) decreased with increasing salinity (Figure 3 and Table 2).
433
Figure 3- Relationship between relative yield and relative evapotranspiration (P<0.01).
434
Şekil 3- Nispi verim ve nispi bitki su tüketimi arasındaki ilişki (P<0.01)
435 436 437 438 439 440
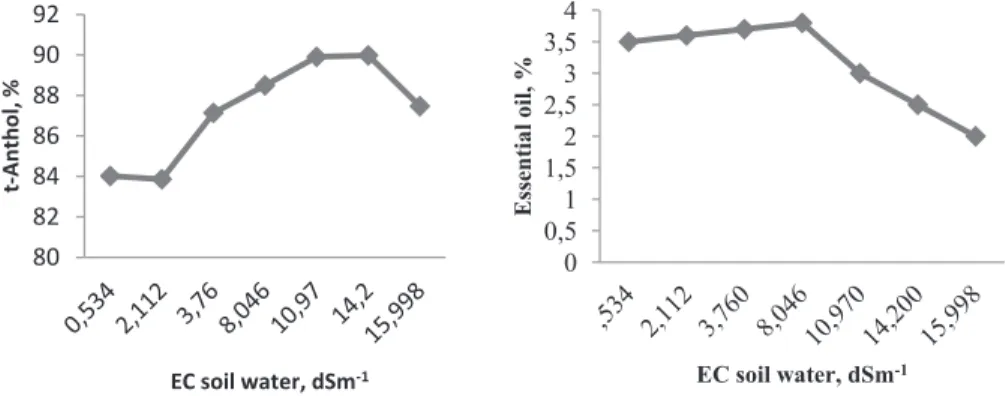
Figure 4- Variation of essential oil and t-anthole content of seeds with respect to soil water salinities.
441
Şekil 4- Rezene tohumlarındaki uçucu yağ ve t-Anthol içeriklerinin toprak suyu tuzluluğu karşısındaki
442 değişimleri. 443 444 y = 1,1589x R² = 0,9021 0 0,1 0,2 0,3 0,4 0,5 0,6 0,7 0,8 0,9 0 0,1 0,2 0,3 0,4 0,5 0,6 0,7 (Y m -Y a) /Y m (ETm-ETa)/ETm 80 82 84 86 88 90 92 t-Ant ho l, % EC soil water, dSm-1 0 0,5 1 1,5 2 2,5 3 3,5 4 Es sentia l o il, % EC soil water, dSm-1
Figure 3- Relationship between relative yield and relative evapotranspiration (P<0.01)
Şekil 3- Nispi verim ve nispi bitki su tüketimi arasındaki ilişki (P<0.01)
The greatest water consumption value was
observed at 2.11 dSm-1 soil water salinity with 73.3 L
(corresponding 145 mm) which was not statistically different (in the same Duncan group) from 0.534
dSm-1 (70.7 L) and 3.76 dSm-1 (69.1 L) soil water
salinities (Table 2), however the rest of the treatments had reduced water consumption. Comparing water
consumption of the saline treatments to the control treatment the decreases were 34%, 37%, 50%, 61% and 66%, for 8.05, 10.97, 14.20, 16.00 and 19.16 dSm-1 soil water salinity levels, respectively.
Decreases in plant water consumption due to salinity should be taken into account for irrigation practices in order to prevent excess water applications and excess leaching (Ünlükara et al 2010). Doorenbos and Kassam (1986) and many others (Stewart et al 1977; Shalhevet 1994; Katerji et al 1998; Ünlükara et al 2010) referenced a model proposed by Stewart & Hagan (1973). The model is to used to predict crop yield from evapotranspration during the plant growing season. The relation between relative evapotranspration and relative yield decreases for water or salinity stress with
a yield response factor (Ky) that has been used to
evaluate plant tolerance to water stress (Doorenbos & Kassam 1986). If Ky ≤ 1, plant is tolerant and if Ky > 1, plant is sensitive to water stress.
The model is
calculated as 2.64 dSm-1 (EC
sw) with a slope of 4.50.
204
Figure 2- Relative yield of fennel as function of soil water salinity (P<0.01).
205
Şekil -. Rezene bitkisinin toprak suyu tuzluluğuna göre nispi verim tepkisi, P<0.01.
206
207
208
3.3. Water consumption
209
Water consumption of fennel (Foeniculum vulgare Mill.) decreased with increasing salinity (Figure 3 and
210
Table 2).
211
Figure 3- Relationship between relative yield and relative evapotranspiration (P<0.01).
212
Şekil 3- Nispi verim ve nispi bitki su tüketimi arasındaki ilişki (P<0.01)
213
214
The greatest water consumption value was observed at 2.11 dSm-1 soil water salinity with 73.3 L
215
(corresponding 145 mm) which was not statistically different (in the same Duncan group) from 0.534
216
dSm-1 (70.7 L) and 3.76 dSm-1 (69.1 L) soil water salinities (Table 2), however the rest of the treatments
217
had reduced water consumption. Comparing water consumption of the saline treatments to the control
218
treatment the decreases were 34%, 37%, 50%, 61% and 66%, for 8.05, 10.97, 14.20, 16.00 and 19.16
219
dSm-1 soil water salinity levels, respectively.
220
Decreases in plant water consumption due to salinity should be taken into account for irrigation practices
221
in order to prevent excess water applications and excess leaching (Ünlükara et al 2010). Doorenbers and
222
Kassam (1986) and many others (Stewart et al 1977; Shalhevet 1994; Katerji et al 1998; Ünlükara et al
223
2010) referenced a model proposed by Stewart & Hagan (1973). The model is to used to predict crop
224
yield from evapotranspration during the plant growing season. The relation between relative
225
evapotranspration and relative yield decreases for water or salinity stress with a yield response factor (Ky)
226
that has been used to evaluate plant tolerance to water stress (Doorenbos & Kassam, 1986). If Ky ≤ 1,
227
plant is tolerant and if Ky > 1, plant is sensitive to water stress.
228
The model is229
230
m a m y m a mET
ET
ET
K
Y
Y
Y
231
where; Ya and ETa are actual crop yield and evapotranspration respectively for saline treatments, Ym and
232
ETm are maximum crop yield and evapotranspration, Ky is crop yield coefficient. Figure 3 demonstrates
233
where; Ya and ETa are actual crop yield and
evapotranspration respectively for saline treatments, Ym and ETm are maximum crop yield and evapotranspration, Ky is crop yield coefficient. Figure 3 demonstrates the model and Ky value.
From the figure strong linear relationship (R2=0.91)
was observed with a slope of 1.161. Since Ky value
is close to 1, we may conclude that fennel plant is moderately tolerant to water stress lead by salinity.
The water use efficiency (WUE) is defined as fresh yield production per unit of water consumed
(kg m-3 =g l-1). The highest WUE value was observed
at 8.05 and 10.97 dSm-1 soil water salinities with
a value of 1.99 kg m-3 then WUE decreased with
further increase in salinity. For the lower salinity
levels, WUEs were lower than 8.05 and 10.97 dSm-1
soil water salinities. These results correspond with the ET results where we determined a reduction
due to increasing salinity for 8.05 and 10.97 dSm-1
Ta r ı m B i l i m l e r i D e r g i s i – J o u r n a l o f A g r i c u l t u r a l S c i e n c e s 18 (2012) 177-186
184
agreement with results from our previous study with okra. Ünlükara et al (2008) observed WUE of okra under increasing salinities of irrigation water. The
highest WUE was obtained from the ECi=3.5 dSm-1
treatment, but further increases in salinity resulted in a gradual decrease in WUE.
3.4. Mineral content in leaves
The changes of Na and Mg content in the leaves were found statistically significant (P<0.01). The highest Na content was obtained from the highest salinity level (0.41%). Salinity levels greater than ECi=4 dSm-1 (corresponding ECsw=8.046 dSm-1) lead
to an increase in Na content in the leaves. Although the highest Mg content was observed in the lowest salinity treatment and the lowest Mg from the highest salinity treatment, we did not observe a trend related to salinity. The changes in K and Ca content in leaves was not found statistically significant (P<0.05). Shannon & Grieve (1999) stated that ionic effects are manifested more generally in leaf and meristem damage or as symptoms typical of nutritional disorders. Thus, high concentrations of Na or Cl may accumulate in leaves or portions thereof and result in `scorching’ or `firing’ of leaves; whereas, nutritional deficiency symptoms are generally similar to those that occur in the absence of salinity.
3.5. Essential oil contents
Essential oil content was 3.5% at the lowest salinity level (0.25 dSm-1) and increased linearly
(3.8%) up to the 4.0 dSm-1 salinity level (Figure 4). However, concentrations above 4.0 dSm-1caused a
regular decrease and the lowest oil content (2.0%) was obtained at the highest salinity concentration. Neffati & Marzouk (2009) recorded similar result for coriander. The authors reported that under moderate NaCl concentration essential oil content increased while under high NaCl concentration essential oil content decreased.
Major component is t-anethole in the genotypes and varied between 83.8 and 89.9%. Salinity affected the contents of the components and the contents
increased regularly from EC 1.0 to 8.0 dSm-1 salinity
treatments. Salinities above EC 8 dSm-1 resulted in
decreasing in anethole contents, although the lowest contents were obtained in the lowest EC treatments
(84.02% in 0.25 EC dSm-1 and 83.86% in 1.00 EC
dSm-1 treatment).
Based upon recent studies on the essential oil composition of fennel, trans-anethole and methyl chavicol are often the main components (Barazani et al 2002; Telci et al 2009), although there are different chemo types. Trans-anethole is an isomer of methyl chavicol with only position of the double bound of the propenyl chain. The genotype used in the research was a chemotype with rich t-anethole.
433
Figure 3- Relationship between relative yield and relative evapotranspiration (P<0.01). 434
Şekil 3- Nispi verim ve nispi bitki su tüketimi arasındaki ilişki (P<0.01)
435 436 437 438 439 440
Figure 4- Variation of essential oil and t-anthole content of seeds with respect to soil water salinities. 441
Şekil 4- Rezene tohumlarındaki uçucu yağ ve t-Anthol içeriklerinin toprak suyu tuzluluğu karşısındaki
442 değişimleri. 443 444 y = 1,1589x R² = 0,9021 0 0,1 0,2 0,3 0,4 0,5 0,6 0,7 0,8 0,9 0 0,1 0,2 0,3 0,4 0,5 0,6 0,7 (Y m -Y a) /Y m (ETm-ETa)/ETm 80 82 84 86 88 90 92 t-Ant ho l, % EC soil water, dSm-1 0 0,5 1 1,5 2 2,5 3 3,5 4 Es sentia l o il, % EC soil water, dSm-1
Figure 4- Variation of essential oil and t-anthole content of seeds with respect to soil water salinities
Ta r ı m B i l i m l e r i D e r g i s i – J o u r n a l o f A g r i c u l t u r a l S c i e n c e s 18 (2012) 177-186
185
T-anethole contents of the genotypes are similar to that reported by Telci at al (2009). There are limited reports about the effect of salinity on essential oil compositions. While Bourgou et al (2010) recorded a large variation in essential oil causing different chemo types in black cumin, the variation of linalool content in coriander oil was similar to data in all treatments, although high concentrations caused different statistical group.
4. Conclusions
The aim of the study was to determine the effect of saline irrigation water with low SAR and at realistic leaching fractions, on fresh weight and seed yield, water consumption, drainage water quality, mineral and essential oil content of fennel (Foeniculum vulgare Mill.) in soil under greenhouse conditions. Calculated, ET weighted salinities for 4th quarter of
root zone showed correspondence to drainage water salinities. All parameters related yield and growth were affected adversely by increasing salinity in irrigation water. Based on these results, a unit increase in salinity of soil water results in a 4.5% reduction in fennel fresh weight where the irrigation water salinity is higher than 2.64 dSm-1 (EC
sw).
Our results suggested that fennel is ‘moderately sensitive’ to salinity. Yield response factor (Ky) is found 1.161 which suggests to rate the fennel plant as ‘moderately tolerant to water stress’ lead by salinity.
References
Ashraf M (2002). Salt tolerance of cotton: Some new advances. Critical Reviews in Plant Sciences 21: 1-30 Ashraf M & Akhtar N (2004). Influence of salt stress on
growth ion accumulation and seed oil content in sweet fennel. Biologia Plantarum 48 (3): 461-464
Ayers R S & Wescot D W (1989). Water quality for agriculture. FAO Irrigation and Drainage Paper 29 Rev. 1. FAO. Rome, Italy
Barazani O, Cohen Y, Fait A, Diminshtein S, Dudai N, Ravid U, Putievsky E & Friedman J (2002). Chemotypic differentiation in indigenous population of Foeniculum vulgare var. vulgare in Israel.
Biochemical Systematics and Ecology 30, 721–731
Bernstein L, Francois L E & Clark R A (1974). Interactive effects of salinity and fertility on yields of grains and vegetables. Agronomy Journal 66, 412
Bourgou S, Bettaieb I, Saidani M & Marzouk B (2010). Fatty acids, essential oil, and phenolics modifications of black cumin fruit under NaCl stress conditions.
Journal of Agricultural and Food Chemistry 58:
12399–12406
Brender T, Gruenwald J & Jaenicke C (1997). Herbal remedies. Phytopharm Consulting Institute for
Phytopharmaceuticals. Second ed. Schaper &
Brummer GmbH & Co. Salzgitter. Berlin. Germany. CD Rom
Doorenbos J & Kassam A H (1986). Yield response to water. FAO Irrigation and Drainage Paper No: 33, Rome
Graifenberg A, Botrini L, Giustiniani L & Lipucci di Paola M (1996). Salinity affects growth yield and elemental concentration of fennel. Horticulture Science 31: 1131-1134
Katerji N, van Hoorn J W, Hamdy A, Mastrorilli M & Karam F (1998). Salinity and drought, a comparison of their effects on the relationship between yield and evapotranspiration. Agricultural Water Management 36: 45-54
Khorshidi J, Tabatabaei M F, Omidbaigi R & Sefidkon F (2009). The effect of different densities of planting on morphological characters, yield and yield components of fennel (Foeniculum Vulgare Mill cv. Soroksary).
Journal of Agricultural Science 1 (2)
Lucinewton S, Raul N, Carvalho J, Mirian B, Lin C, & Angela A (2005). Supercritical fluid extraction from fennel (Foeniculum vulgare) global yield, composition and kinetic data. Journal of Supercritical
Fluids 35: 212-219
Maas E V (1996). Crop salt tolerance. Edit: Tanji, K.K.
Agricultural Salinity Assessment and Management.
ASCE Manuals and Reports on Engineering Practice No:71
Maas E V& Hoffman G J (1977). Crop salt tolerance: current assessment. ASCE Journal of Irrigation and
Drainage Division 103 (1): 15-34
Masood A, Syed Asghar H, Mohammad Z & Abdur R. (2004). Effect of different sowing season and row spacing on seed production of fennel (Foeniculum vulgare). Journal of Biosciences 7(7): 1144-1147 Munns R (2002). Comparative physiology of salt and
Ta r ı m B i l i m l e r i D e r g i s i – J o u r n a l o f A g r i c u l t u r a l S c i e n c e s 18 (2012) 177-186
186
Neffati M & Marzouk B (2009). Roots volatiles and fatty acids of coriander (Corundum sativum L.) grown in saline medium. Acta physiologiae Plantarum 31: 455–461
Qasim M, Ashraf M, Ashraf MY, Rehman S U & Rha E S (2003). Salt-induced changes in two canola cultivars differing in salt tolerance. Biologia Plantarum 46: 629-632
Shalhevet J (1994). Using water of marginal quality for crop production: major issues. Agricultural Water
Management 25: 233-269
Shannon M C & Grieve CM (1999). Tolerance of vegetable crops to salinity. Scientia Horticulturae 78: 5-38
Stewart J L, Danielson R E., Hanks R J, Jackson E B, Hagon R M, Pruit W O, Franklin W T & Riley J P (1977). Optimizing crop production through control of water and salinity levels in the soil. Utah Water
Research Lab. PR. 151-1, Logan, Utah
Stewart J I & Hagan R M (1973). Functions to predict effects of crop water deficits. Journal of Irrigation
and Drainage Engineering 99(4): 421-439
Suarez D L (2010a). Use of marginal quality waters for sustainable crop production. In: Proceedings of
the International Conference on Soil Classification and Reclamation of Degraded Lands in Arid Environments. May 17-19, Abu Dhabi. UAE
Suarez D L (2010b). Extent of global salinization and management options for sustainable crop. In:
Proceedings of the International Conference on Soil
Classification and Reclamation of Degraded Lands in Arid Environments. May 17-19, Abu Dhabi, UAE
Telci İ, Demirtaş İ & Şahin A (2009) Variation in plant properties and essential oil composition of sweet fennel (Foeniculum vulgare Mill.) fruits during stages of maturity. Industrial Crops and Products 30:126– 130
Ünlükara A, Kurunç A, Kesmez G D, Yurtseven E & Suarez D L (2010). Effects of salinity on eggplant (Solanum
Melongena L.) growth and evapotranspiration. Journal of Irrigation and Drainage 59: 203–214
Ünlükara A, Kurunç A, Kesmez G D & Yurtseven E (2008). Growth and evapotranspiration of okra
(Abelmoschus Esculentus L.) as influenced by salinity
of irrigation water. Journal of Irrigation and Drainage
Engineering 134 (2): 160-166
US Salinity Laboratory Staff (1954). Diagnosis and improvement of saline and alkali soils. USDA Handbook 60, U.S. Government Printing Office, Washington, D. C.
Yurtseven E, Kesmez G D & Ünlükara A (2005) The effects of water salinity and potassium levels on yield, fruit quality and water consumption of a native central Anatolian tomato species (Lycopersicon esculantum).
Agricultural Water Management 78 (1-2): 128-135.
Zaki M F, Aboul-Hussein S D, Abou Magd M M & El-Abagy H M H (2009). Evaluation of some sweet fennel cultivars under saline irrigation. Water European