SPATIOTEMPORAL CHANGE DETECTION USING LANDSAT IMAGERY: THE CASE
STUDY OF KARACABEY FLOODED FOREST, BURSA, TURKEY
A.E. Akay1,*, B. Gencal, İ. Taş1
1Forest Engineering Department, Faculty of Forestry, Bursa Technical University 16330 Yıldırım Bursa, Turkey (abdullah.akay, burhan.gencal, inanc.tas)@btu.edu.tr
KEY WORDS: Spatiotemporal change, Land use/Land cover, Protected areas, Karacabey flooded forest
ABSTRACT:
This short paper aims to detect spatiotemporal detection of land use/land cover change within Karacabey Flooded Forest region. Change detection analysis applied to Landsat 5 TM images representing July 2000 and a Landsat 8 OLI representing June 2017. Various image processing tools were implemented using ERDAS 9.2, ArcGIS 10.4.1, and ENVI programs to conduct spatiotemporal change detection over these two images such as band selection, corrections, subset, classification, recoding, accuracy assessment, and change detection analysis. Image classification revealed that there are five significant land use/land cover types, including forest, flooded forest, swamp, water, and other lands (i.e. agriculture, sand, roads, settlement, and open areas). The results indicated that there was increase in flooded forest, water, and other lands, while the cover of forest and swamp decreased.
1. INTRODUCTION
Wetlands are defined by the Ramsar Convention as the areas of natural or artificial marsh lands with water that is static or flowing, including areas of marine water with the depth of which does not exceed six meters at low tides (Scarano, 2009). The flooded forests and swamps account for the largest proportion of wetland areas (Aselmann and Crutzen, 1989). Flooded forest is “priority forest habitat type” which is listed as one of Europe's most threatened natural ecosystems (Hughes, 2003). The sustainability of the flooded forests mostly depends on flood regimes since tree species in these forests need newly deposited sediment for regeneration.
In the flooded forests, there are diversity plant species, trees, shrubs, and they provide habitats for a very wide range of wild animals. However, about 90% of the flooded forests in Europe are disappeared and remaining fragmented areas are in critical condition (Hughes, 2003). In order to maintain important features of these forests, it is crucial to develop distinctive
strategies for the restoration of flooded forest and integrated these strategies within the land/forest management plans.
In the first stage of restoration studies, it is necessary to delineate the borders of the flooded forest. On the other hand, it can be very difficult task to detect exact borders of flooded forests because they are highly dynamic ecosystems and subject to seasonal and long-term changes (Scarano, 2009). Therefore, spatiotemporal change detection analysis covering a long period of time should be performed for flooded forests. Advanced features of Geographical Information System (GIS) and Remote Sensing (RS) technologies has been effectively used to assess and monitor land use/land cover changes at low cost and in short time (Desai et al. 2009; Akay et al. 2014).
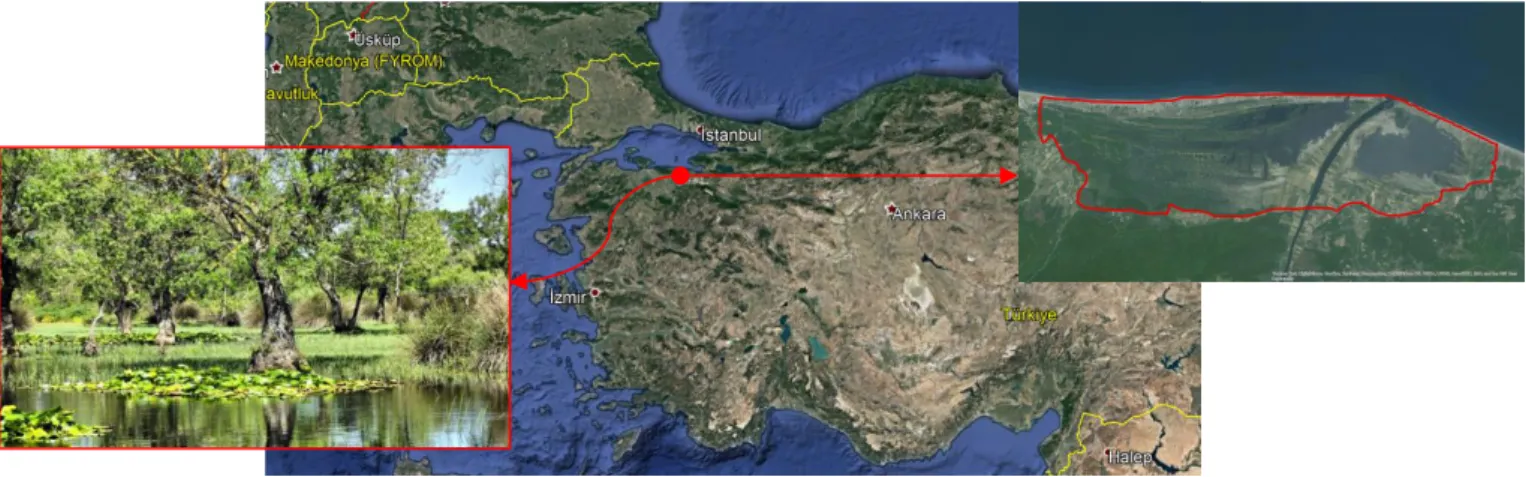
In this study, spatiotemporal changes of land use/land cover in the Karacabey Flooded Forest region were detected based on series of Landsat images. Karacabey Flooded Forest is one of the distinguished flooded forests in Turkey (Figure 1).
Figure 1. Karacabey Flooded Forest
* Corresponding author
ISPRS Annals of the Photogrammetry, Remote Sensing and Spatial Information Sciences, Volume IV-4/W4, 2017 4th International GeoAdvances Workshop, 14–15 October 2017, Safranbolu, Karabuk, Turkey
2. MATERIAL AND METHODS 2.1 Study Area
The spatiotemporal change detection study was performed in Karacabey Flooded Forests. The total area was about 3800 ha. The geographical location of the study area was 40º23’38” - 40º21’43”N latitudes and 28º23’02”-28º52’21”- 28º34’01” longitudes. The main land use classes in the flooded forest include forest, flooded forest, swamp, water bodies, agriculture, sand, roads, and open areas. The dominant trees in the region are alder, oak, ashen, poplar, stone pine, and black pine.
2.2 Digital Image Process
In order to run image processing techniques, firstly, a digital database was generated for the study area. The database images were forest management maps (1/25000), Landsat 5 Thematic Mapper (TM) and Landsat 8 Operational Land Imager (OLI) images. Landsat 5 TM and Landsat 8 OLI images with 30 m spatial resolution were acquired in the year of 2000 (July) and 2017 (June), respectively. The digital image processing included following main stages 1) pre-processing, 2) classification, 3) post-processing, and 4) change detection. The image processing applications were performed by using ERDAS 9.2, ArcGIS 10.4.1, and ENVI programs.
2.2.1 Pre-processing
In the first step, the appropriate band combinations were implemented to generate color infrared (CIR) images using Landsat 5 TM and Landsat 8 OLI. “Layer Stack” function under “Utilities” tool menu of ERDAS 9.2 was used to combine bands 4, 3, and 2 for Landsat 5 TM and bands 5, 4, and 3 for Landsat 8 OLI.
Geometric correction of satellite images were performed by the references of forest management maps and ground control points. After geometric correction, radiometric correction was implemented using “Radiometric Calibration” tool under ENVI program to eliminate systematic errors and to improve the quality of remote sensed data. Then, atmospheric correction was used to remove the scattering and absorption effects of the atmosphere. “FLAASH Atmospheric Correction” tool working in ENVI was used to estimate the true surface reflectance. In the final stage of pre-processing, the border of the study area obtained from forest management map was used to subset flooded forest region from Landsat images (Figure 2).
Figure 2. Study area subsets of 2000 (upper) and 2017 (lower) images
ISPRS Annals of the Photogrammetry, Remote Sensing and Spatial Information Sciences, Volume IV-4/W4, 2017 4th International GeoAdvances Workshop, 14–15 October 2017, Safranbolu, Karabuk, Turkey
2.2.2 Image Classification
In the mage classification stage, unsupervised classification was used to extract land use/land cover information from Landsat images. ERDAS 9.2 unsupervised classification is performed using an algorithm called the “Iterative Self-Organizing Data Analysis Technique (ISODATA)”. In classification process, the number of clusters (classes), number of iterations, and a confidence threshold should be determined by the user. Then, ERDAS 9.2 builds clusters iteratively by refining the clusters with each new iteration and stop the process when the confidence level is reached.
In this study, unsupervised classification using ISODATA was implemented to perform classification. In order to extract optimum land use/land cover information, unsupervised classification was run several times for various numbers of classes. Evaluating less than optimum classes for classification may result in high number of misclassified pixels, while choosing too many classes may cause problems of handling excessive number of classes during recoding stage of the classification. After evaluating alternative number of classes (i.e. 30, 40, 50), finally, total of 40 classes were preferred with six iterations at 95% confidence threshold. There were five significant land use/land cover types, including forest, flooded forest, swamp, water, and other lands.
2.2.3 Post-processing
After the classification process, “Recode” function in ERDAS 9.2 was applied to combine the classes into five main classes. Due to very close reflectance values received from bare ground surface feature such as agriculture, sand, roads, settlement, and open areas, they were merged into single class called other lands (Table 1).
Classes Description
Forest Coniferous, deciduous, and mixed-forest types with plantation areas
Flooded forest Flooded forest vegetation Swamp Swamp area within the region Water Water bodies (lakes, stream channels) Other lands Agriculture, sand, roads, settlement, and
open areas
Table 1. The classes used in classification process Classification was followed by accuracy assessment analysis using “Accuracy Assessment” tool in ERDAS 9.2. In accuracy assessment, total of 255 control points automatically selected (i.e. 51 points for each class). A random sampling approach was preferred to assess the accuracy of land use/land cover change classification. The referenced values were recorded on the “Accuracy Assessment Table” based on forest management maps and field observations. Figure 3 indicates land use type map generated based on the current forest management map. The overall accuracy and kappa values were computed by using user’s accuracy (a measure of commission error) and producer’s accuracy (a measure of omission error) for land use classes. Kappa analysis is defined as a discrete multivariate technique employed in accuracy assessments (Moller-Jensen, 1997). 2.2.4 Change Detection
Change detection was used to detect spatiotemporal changes of land use/land cover in the Karacabey Flooded Forest based on series of Landsat images. Change detection analysis is widely preferred method for identifying and quantifying differences between images at different times (Lillesand and Kiefer, 2000). After accuracy assessment analysis, change detection method was used to compare the 2000 and 2017 classification images.
Figure 3. Forest management map based land use type
ISPRS Annals of the Photogrammetry, Remote Sensing and Spatial Information Sciences, Volume IV-4/W4, 2017 4th International GeoAdvances Workshop, 14–15 October 2017, Safranbolu, Karabuk, Turkey
3. RESULTS AND DISCUSSION
Spatiotemporal land use/land cover change was analyzed within Karacabey Flooded Forest region (Figure 4, Figure 5). The results of classification procedures implemented on both image obtained in 2000 and 2017 indicated that the most common land use class within the study area was other lands (including agriculture, sand, roads, settlement, and open areas), followed by water and flooded forest areas (Table 2).
Land Use Types Area (%) Areal Change (%) 2000 Image 2017 Image Forest 12.72 8.11 -4.61 Flooded forest 13.30 16.65 3.35 Swamp 14.85 14.20 -0.65 Water 19.60 20.25 0.64 Other lands 39.53 40.79 1.25
Table 2. The classes used in classification process
Land use maps of the study area were used to evaluate spatiotemporal changes of land use for 17 years period. It was found that the areal distribution (%) of flooded forest, water, and other lands increased, while there was a reduction in forest and swamp between the year of 2000 and 2017.
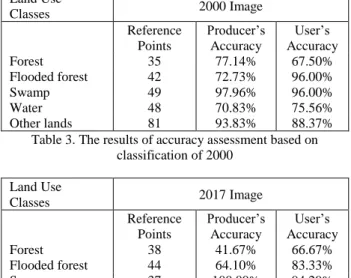
The accuracy of the classified image was assessed by using randomly selected 255 points based on referenced forest management maps. The results indicated that classification process applied on 2000 and 2017 images provided overall accuracy of 84.96% and 81.47%, respectively (Table 3, 4). Classification of 2000 image provided satisfactory results in terms of distinguishing flooded forest, swamp, and other lands; however, accuracy of forest and water were relatively low. The highest producers and users accuracy was reached in classification of swamp. The lowest producers and users accuracy was for water and forest, respectively.
Figure 4. Classified of 2000 image
ISPRS Annals of the Photogrammetry, Remote Sensing and Spatial Information Sciences, Volume IV-4/W4, 2017 4th International GeoAdvances Workshop, 14–15 October 2017, Safranbolu, Karabuk, Turkey
Land Use Classes 2000 Image Reference Points Producer’s Accuracy User’s Accuracy Forest 35 77.14% 67.50% Flooded forest 42 72.73% 96.00% Swamp 49 97.96% 96.00% Water 48 70.83% 75.56% Other lands 81 93.83% 88.37%
Table 3. The results of accuracy assessment based on classification of 2000 Land Use Classes 2017 Image Reference Points Producer’s Accuracy User’s Accuracy Forest 38 41.67% 66.67% Flooded forest 44 64.10% 83.33% Swamp 37 100.00% 94.29% Water 41 75.61% 59.62% Other lands 95 94.74% 90.00%
Table 4. The results of accuracy assessment based on classification of 2017
Classification of 2017 image provided satisfactory results in terms of distinguishing swamp and other lands; however, accuracy of other land use types were relatively low. The highest producers and users accuracy was for swamp. The lowest producers and users accuracy was for forest and water, respectively.
4. CONCLUSION
The flooded forests are very important ecosystems that are rich in terms of divers flora and fauna. However, flooded forests are mostly degraded in many parts of the world. In order to restore flooded forests, the border of these forests should be carefully delineated, and special strategies should be developed for these areas. In this study, spatiotemporal changes of land use/land cover in the Karacabey Flooded Forest region were detected
based on series of Landsat images. The results indicated that the area of the flooded forest increased about 3% for 17 years periods.
REFERENCES
Akay, A.E., Sivrikaya, F., Gulci, S., 2014. Analyzing riparian forest cover changes along the Firniz River in the Mediterranean City of Kahramanmaras in Turkey. Environmental Monitoring
and Assessment. 186(5), pp.2741-2747.
Aselmann, I., Crutzen, P.J., 1989. Global distribution of natural freshwater wetlands and rice paddies, their net primary productivity, seasonality and possible methane emission. Journal
of Atmospheric Chemistry 8: pp. 307-358.
Desai, C.G., Patil, M.B., Mahale, V.D., Umrikar, B., 2009. Application of remote sensing and geographic information system to study land use/land cover changes: a case study of Pune Metropolis. Advances in Computational Research 1(2), pp. 10-13.
Hughes, F.M.R., 2003 The Flooded Forest: Guidance for policy makers and river managers in Europe on the restoration of floodplain forests. FLOBAR2, Department of Geography, University of Cambridge, UK. 96 p.
Lillesand, T.M., Kiefer, R.W., 2000. Remote Sensing and Image
Interpretation. 4th ed. New York: Wiley.
Scarano, F.R., 2009. Flooded Forests, Tropical Biology and Conservation Management - Volume IV: Botany, Editors: Kleber Del Claro,Paulo S. Oliveira,Victor Rico-Gray. EOLSS Publications, 406 p.
Moller-Jensen, L., 1997. Classification of Urban land cover based on expert systems, object models and texture. Computers,
Environment and Urban Systems, 21(3/4), pp. 291-302.
ISPRS Annals of the Photogrammetry, Remote Sensing and Spatial Information Sciences, Volume IV-4/W4, 2017 4th International GeoAdvances Workshop, 14–15 October 2017, Safranbolu, Karabuk, Turkey