IC
ON
A
RP
ICONARP International Journal of Architecture & Planning Received 09 March 2018; Accepted 08 April 2018 Volume 6, Issue 1, pp: 77-98/Published 25 June 2018
DOI: 10.15320/ICONARP.2018.39–E-ISSN: 2147-9380 Research Article
Abstract
The present study investigates the rank-size distribution of cities above 10,000 in Turkey for the years 2000 and 2012, and the results are compared with the findings related to 1945 and 1975. A regression analysis is employed to reveal the relationships between the slopes of city size distribution and the characteristics of provinces. The results show that despite the political and economic transformations of the last decade, there is a perfect adjustment of the city size distribution to the rank-size rule at the country level due to existence of a well-established urban system. Furthermore, when the metropolitan areas began to decentralize, urbanization levels start to increase in their surrounding areas, as observed in this study.
INTRODUCTION
During the last two decades, an extensive literature on city-size dynamics in developed and developing countries has come about through the use of Zipf’s law. According to this law, the size distribution of cities in a country, or even across the World, shows a striking regularity. If the cities of a country are ranked according to their log sizes, the slope of the line is close to -1. Zipf’s law has
A Rank-Size Rule Analysis
of The City System at The
Country and Province Level
in Turkey
Seda Kundak
*Vedia Dökmeci
**Keywords: Urbanization, City size distribution,
Economic development, Zipf’s law * Assoc. Prof. Dr. Faculty of Architecture,
Istanbul Technical University, Istanbul, Turkey. E-mail: [email protected] Orcid ID: http://orcid.org/0000-0002-6037-1749
**Prof. Dr. Faculty of Architecture, Istanbul Technical University, Istanbul, Turkey. E-mail: [email protected]
Orcid ID: http:/orcid.org/0000-0002-2945-9910
IC O N ARP. 20 18 .3 9 – E-ISSN : 21 47 -9380
been applied in economic geography as a metric to judge the rank-size distribution of the rank-sizes of cities, firms and the scales of industrial sectors (Brakman, Garretsen, & Van Marrewijk, 2001; Mu & Wang, 2006; Zipf, 1949). Although previous studies mostly applied Zipf’s law at the country level, there are also few applications at the regional level such as those of Dökmeci (1986) in Turkey and Grisen and Südekum (2010) in Germany. The present study attempts to apply Zipf’s law in even more smaller spaces such as the Turkish provinces.
A review of the literature reveals that a large portion of the application of Zipf’s law has been carried out in developed countries. Guerin-Pace (1995) illustrated the rank-size distribution and the process of urban growth by taking into consideration data on French cities’ populations over the course of almost two centuries. The development of middle-sized cities based on industrial and economic development affected the adjustment of the city system to the rank-size rule. Eaton and Eckstein (1997) compared the populations of the top 40 urban areas of France and Japan. According to their results, large cities remained very constant during these countries’ periods of industrialization and urbanization, and are described quite well by the rank-size rule. In the study by Reed (2002) an explanation for the rank-size distribution for human settlement formation is to be found in Spain, and an excellent fit lends support to the model and to the exploration for the rank-size law. In a later study, Gallo and Chasco (2008) studied the evolution of population growth among a group of 722 municipalities included in Spanish urban areas over the period 1900-2001. The application of Zipf’s law showed the existence of two main phases: divergence (1900-1980) and convergence (1980-2001). Saichev et al., (2010) found that Zipf’s Law holds for cities above 1000 people in England. Cori (Cori, 1984) stated that the initial rank-size distribution of cities in Italy was concave and that it was later adjusted to the rank-size rule distribution (Waugh, 2000) due to changes in government urbanization policies.
The rank-size distribution of US cities has been proved many times using Zipf’s law, and the power value is around 1.0 (Gabaix, 1999; Kali, 2003; Zipf, 1949). Dobkins and Ioannides (2000) investigated the dynamic evolution of U.S. cities and showed their adjustment to rank-size over time. In a study by Ioannides and Overman (2003), metropolitan areas in the United States between the years 1900-1990 were used to test the validity of Zipf’s Law for cities. According to their results, the local Zipf’s exponents are broadly consistent with Zipf’s Law. Similar results were obtained by Black and Henderson (2003), Gan et al. (2006) and Berry and
olu m e 6, Is su e 1 / Pu bli shed : Jun e 20 18
Okulicz-Kozaryn (2012). Mu and Wang (2006) verified Zipf’s law with the 2000 data by using all 273 MSA and CMSA’s to achieve a slope value of 1.15. In another study, Eeckhout (2004) delivered a rigorous work on the relationship between city rank and city size for 23,539 U.S. settlements in the year 2000. According to him, most studies built on the US city-size distribution accept the validity of Zipf’s Law because they work on truncated distributions. Similarly, Parr (1985) suggested that in many cases, the linear rank-size distribution might be only the upper part of a truncated log-normal distribution. In a more recent example, Jiang and Jia’s (2011) paper lead to the finding that Zipf’s law holds remarkably well for the entire country to explain the distribution of settlements in the U.S. This implies that cities are power-law distributed and that the Zipf value is around 1. However, this does not hold for individual states.
There are also studies about the application of rank-size rule in developing countries. Usually, primary city characteristics are observed in many developing countries such as Peru, Argentina and Uruguay (Waugh, 2000). On the other hand, there are developing countries which have a more regular distribution of cities due to their historical background such as Turkey (V. F. Dokmeci, 1986). Anderson and Ge (2005) examined the manner in which cities of different sizes grow relative to each other in China and, contrary to the common empirical finding that the relative size and rank of cities remained stable over time, it was found that the Economic Reforms and the ‘One Child Policy’ that has been in place since 1979 have delivered significant structural changes to the Chinese urban system (Fan, 1988). Another study by Schaffar and Dimou (2012) compared the rank-size Dynamics in China and India between 1981 and 2004. The evolution of these two distributions over the last twenty years differs. The Chinese rank-size distribution reveals the contrasting evolution between the 1980s, when small-sized cities grew faster, and the 1990s, which produced higher growth trends for medium-sized cities. The Indian city-size distribution, however, appears to systematically reject Zipf’s law, through a substantial presence of small cities and a small group of very large metropolises. At the same time, intra-distributional mobility is higher in China than in India, despite previous cross-region migration restrictions and anti-megacity policies. Indian urban hierarchies are much more stable, which could reveal parallel growth patterns. In a worldwide analysis, Soo (Soo, 2005) assessed the empirical validity of Zipf’s law for cities by using new data on 73 countries and two estimation methods. Zipf’s law was rejected for 53 out of 73 countries using OLS, and for 30 out of 73 countries using the Hill estimator. Variations in the value of the Pareto exponent are
79
IC O N ARP. 20 18 .3 9 – E-ISSN : 21 47 -9380
better explained by political economy variables than by economic geography variables.
Although there are numerous studies regarding the rank-size analysis of urban systems in developed countries, there have been few studies conducted in Turkey. In one of the earliest studies, Dokmeci (1986) showed that the adjustment of the city system to the rank-size rule over time (1945-75) was parallel to the economic development of the country. At the same time, this study revealed the existence of urban sub-systems and a strong regional influence in the city-size distribution which reflected regional inequalities. In a further period between 1980 and 1997, Turk and Dokmeci (2001) reported a better adaptation of city system to the rank-size rule at the country and regional level in Turkey. In a more recent study, Zeyneloğlu et al. (2005) revealed a perfect adjustment of the urban system to the rank-size distribution of Turkish cities due to the urban growth of middle size cities due to the industrial and economic development between 1975-2000. In their comprehensive study on the distribution of cities in Turkey, Deliktaş et al. (2013) found that the location of a city has a positive impact on migration and agglomeration of services as well as specialization in manufacturing industry. Kaya and Dökmeci (2017) showed that due to economic constraints and higher emigration rates, the hierarchical distribution of cities differentiates in the Eastern and Western parts of Turkey. The present study investigates the rank-size distribution of cities above 10,000 at the country and province level within changing economic and urbanization conditions in Turkey. The organization of the paper is as follows. In section 2, the dynamics of city system with respect to different city size groups is explained between 1945-1975 and 2000-2012 by looking at changes in relative city size distribution and mobility of cities in their rank order. In addition, rank-size rule applications at the country and province level are given. In section 3, the relationships between the slope of city size distribution and the characteristics of provinces such as population density, population growth rate, net migration ratio, number of physicians per 10,000 people, education level, the number of industrial and service employment, and energy consumption per capita are investigated by the use of regression analysis and their results are discussed. The final section is devoted to a conclusion and suggestions for further research.
olu m e 6, Is su e 1 / Pu bli shed : Jun e 20 18
THE URBANIZATION TREND AND THE APPLICATION OF THE RANK-SIZE RULE AT THE COUNTRY AND PROVINCIAL LEVEL IN TURKEY
Urbanization and Economic Characteristics
After the 1950s, Turkey experienced a rapid increase in urbanization due to rural migration and population growth. While Turkey’s population growth rate per year was 2.5% during the period 1965-70, it fell to 1.62% between 1995 and 2000. In 2000, the annual growth rate of urban population was 2.68% and was still higher than Turkey’s annual growth rate of population (1.82%) (Table 1). In 1927, during the early years of the Turkish Republic, the urban population consisted of 24% of the total but this ratio had reached 64.9 % according to the 2000 census. Although urbanization depends on the growth of industrial and service sectors, the ratio of agricultural employment (47%) was still higher than industrial (22%) and service employment (32%) (Statistics, 2002).
Table 1 Regional Urban and Rural Population in 1990 and 2000 and
Annual growth Rate (Statistics, 2002)
1990 2000 Annual Growth Rate (%)
Region Urban Rural Urban Rural Total Urban Rural
Marmara 10,350,307 2,945,571 13,730,962 3,634,065 2.66 2.82 2.10 Aegean 4,344,471 3,250,506 5,495,575 3,443,206 1.62 2.35 0.57 Mediterranean 4,051,596 2,974,893 5,204,203 3,501,802 2.14 2.50 1.67 C. Anatolia 6,412,910 3,500,396 8,039,036 3,569,832 1.57 2.25 0.19 Black Sea 3,373,392 4,799,321 4,137,466 4,301,747 0.36 2.14 -1.09 East Anatolia 2,285,798 3,062,714 3,255,896 2,881,518 1.37 3.53 -0.61 S.East Anatolia 2,873,801 2,283,359 4,143,136 2,465,483 2.47 3.65 0.76 TOTAL 33,656,275 22,816,710 44,006,274 23,797,653 1.82 2.68 0.42
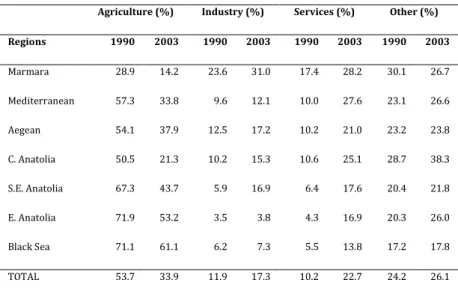
Since the beginning of the 20th century, there have been great socio-economic differences between the East and the West of the country (Gezici & Hewings, 2007; Tekeli, 2008). These differences between the East and the West have continuously stimulated migration to the West and thus while it caused the growth of the cities in the West, it has brought depopulation in the East and increased inequality. To a large extent, the out-migrants had higher incomes than those left behind, as has already been observed in some developed countries (Coulton, Chow, Wang, & Su, 1996). With respect to the characteristics of the regions, the Marmara Region was more industrialized (30.9%) and had more services (28.2%) than other regions in 2003 (Table 2), and its urbanization rate was the highest (79%) in 2000. The Aegean
81
IC O N ARP. 20 18 .3 9 – E-ISSN : 21 47 -9380
Region was the second most industrialized region (17.2%) and the fourth with respect to services (21.0%) in 2003, while its urbanization ratio was the third (61.4%) in 2000. In 2003, in the Central Anatolia Region, industrial employment was the fourth largest (15.3%), its service employment was the third largest (25.1%) and its urbanization ratio was the second largest (69.2%) in 2000. The Mediterranean Region was the fifth highest (12.1%) with respect to industrial employment, had the second largest service employment ratio (27.6%) and its urbanization ratio was the fourth largest (59.7%) in 2000. A large amount of investment in tourism played an important role for the development of service sector in this region. The East and South East Anatolian, Black Sea Regions were much less developed and had lower urbanization ratios due to the large amount of out-migration from these regions (Yazgi, Dokmeci, Koramaz, & Kiroglu, 2014).
Table 2 The ratios of Industrial, Service and Agricultural Employment
Distributions 1990-2003 (Statistics, 1994, 2003)
Agriculture (%) Industry (%) Services (%) Other (%) Regions 1990 2003 1990 2003 1990 2003 1990 2003 Marmara 28.9 14.2 23.6 31.0 17.4 28.2 30.1 26.7 Mediterranean 57.3 33.8 9.6 12.1 10.0 27.6 23.1 26.6 Aegean 54.1 37.9 12.5 17.2 10.2 21.0 23.2 23.8 C. Anatolia 50.5 21.3 10.2 15.3 10.6 25.1 28.7 38.3 S.E. Anatolia 67.3 43.7 5.9 16.9 6.4 17.6 20.4 21.8 E. Anatolia 71.9 53.2 3.5 3.8 4.3 16.9 20.3 26.0 Black Sea 71.1 61.1 6.2 7.3 5.5 13.8 17.2 17.8 TOTAL 53.7 33.9 11.9 17.3 10.2 22.7 24.2 26.1
City Size Groups and the Rank-Size Rule between 1945 and 1975
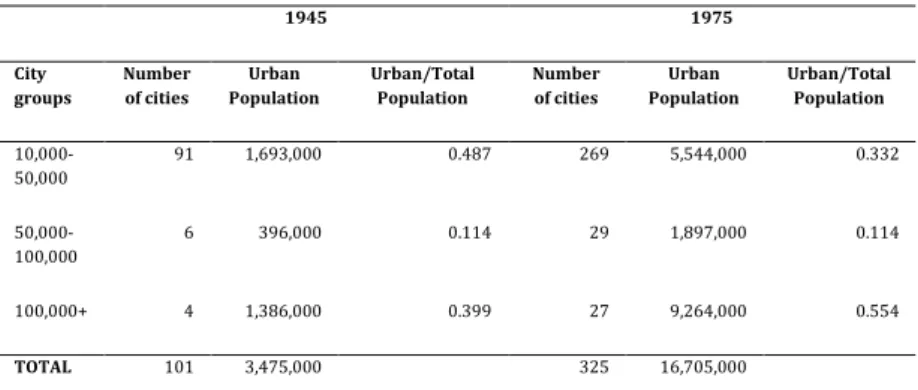
In order to show the evolution of the distribution of different city size groups over time, the number and size of cities has been investigated by dividing cities into three groups by population (10,000-50,000; 50,000-100,000; and 100,000+) for 1945 and 1975 (Dökmeci, 1981). Between 1945 and 1975, the number and population of the first group of cities having a population of 10,000 to 50,000 rose almost threefold. Although their number and population increased, their ratio to the total urban population decreased from 48.7% to 33.2% (Table-3).
Both the number and population of the second group of cities having a population of 50,000 to 100,000, was increased almost fivefold during 1945-1975. Despite the increase in their numbers
olu m e 6, Is su e 1 / Pu bli shed : Jun e 20 18
and population, they accounted for only a small ratio of the urban population and their ratio to the total urban population remained stable (Table 3) due to a limited amount of investment in industry and services in these cities during this period.
In the third group of cities, 100,000 and over, their number and population increased almost sevenfold between 1945 and 1975. This was a rapidly growing group, and their ratio to total urban population grew from 39.9% to 55.4% within the same period (Table 3). This was due to the increased job opportunities in these cities and also lead to greater rural migration.
Table 3 City groups in Turkey between 1945-1975 (Statistics, 1945,
1975) 1945 1975 City groups Number of cities Urban Population Urban/Total Population Number of cities Urban Population Urban/Total Population 10,000-50,000 91 1,693,000 0.487 269 5,544,000 0.332 50,000-100,000 6 396,000 0.114 29 1,897,000 0.114 100,000+ 4 1,386,000 0.399 27 9,264,000 0.554 TOTAL 101 3,475,000 325 16,705,000
Although there were no cities with a population of over a million in 1945, there were three in 1975. Thus, the results of the urbanization analysis between 1945-1975 illustrated that cities having a population 100,000 and over were growing much faster than any other group. The cities between 10,000-50,000 grew faster than those between 50,000-100,000 but more slowly than the larger ones. Thus, the ratio among different city groups was changing in favor of large cities at the expense of small settlements with regard to the total urban population(Dökmeci, 1981). As might be expected, there were important regional differences in the growth patterns of different city groups due to regional socio-economic inequalities. Thus, the growth of large cities started from the West, which offered the greatest potential for their development and gradually moved to Central and East Anatolia. The rank-size distribution of cities from 1945-1975 and their gradual adjustment to the Zipf’s law, as illustrated by V. F. Dokmeci (1986), was dependent on the economic development of the country. The slope of the rank-size distribution of cities was 0.75 in 1945 and it increased to 0.89 in 1975. It became more adjusted to the rank-size rule, except in the case of the middle size cities due to the insufficient investment in industry and services.
83
IC O N ARP. 20 18 .3 9 – E-ISSN : 21 47 -9380
At the same time, a review of the shifts in rank-size distribution revealed that while there were no changes in the rank order of the top five largest cities, the shifts in the rank order of smaller cities occurred more frequently. During this period, government policies to indirectly control the growth of large cities to some extend played an important role in this trend (Dokmeci, 1986).
City Size Groups between 2000 and 2012
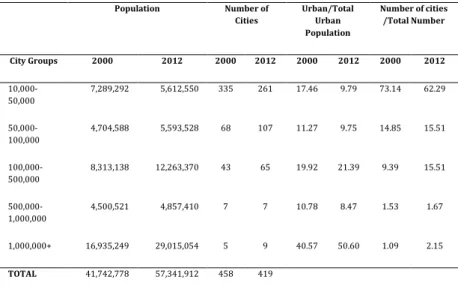
In order to evaluate the current rank-size distribution of cities, the number and size of cities has been investigated according to different size groups for the years 2000 and 2012 (Table 4). The results of the analysis illustrate that while the number of cities between 10,000-50,000 decreased from 335 to 261 (21.7%), their population decreased from 7,289,292 to 5,612,550 (23%). 12.5% of the decrease in numbers was due to the population decrease in some of the cities below 10,000 or movement to a higher city size group due to population increase. Meanwhile, for the group containing cities of 50,000 and 100,000, their number increased from 68 to 107 (57.3% increase) and their population rose from 4,704,588 to 5,593,528 (18.8%). In addition, the cities between 100,000 and 500,000 also had a dynamic nature. While their number increased from 43 to 63 (51%), their population increased from 4,704,588 to 5,593,528 (47.5%). While the number of cities between 500,000 and 1,000,000 remained stable, their population increased from 4,500,521 to 4,857,410 (7.9%). Moreover, the growth rate of cities with a population of 1,000,000 and over was the highest with respect to their number and population due to a free trade policy and the easy-going application of urban planning regulations at the service of the national and international real estate investors during this period. While their number increased from 5 to 9 (80%), their population increased from 16,935,249 to 29,015,054 (71%). Finally, a review of city system development between the years 1945-2012 revealed that while the number of cities increased by more than fourfold, the national urbanization ratio rose only threefold. Thus, the changes in the size and the number of cities have been influenced by transformation of an agricultural economy to one made up of industry and a service sector which includes services in finance, management and consulting, insurance, advertisement, law, research and education, engineering and architecture, and business (credit, computer, personnel, etc.). These services were mostly concentrated in large cities which resulted in population decreases in some of the small cities.
olu m e 6, Is su e 1 / Pu bli shed : Jun e 20 18
Table 4 City Groups in Turkey between 2000-2012 (Statistics, 2000,
2012) Population Number of Cities Urban/Total Urban Population Number of cities /Total Number City Groups 2000 2012 2000 2012 2000 2012 2000 2012 10,000-50,000 7,289,292 5,612,550 335 261 17.46 9.79 73.14 62.29 50,000-100,000 4,704,588 5,593,528 68 107 11.27 9.75 14.85 15.51 100,000-500,000 8,313,138 12,263,370 43 65 19.92 21.39 9.39 15.51 500,000-1,000,000 4,500,521 4,857,410 7 7 10.78 8.47 1.53 1.67 1,000,000+ 16,935,249 29,015,054 5 9 40.57 50.60 1.09 2.15 TOTAL 41,742,778 57,341,912 458 419
The Rank-size Rule Application at the Country and Province Level between 2000-2012
The rank-size rule is a statistical evaluation of population size of cities regarding to their rank among all cities of a country or region. The typical expression of the formula is:
𝑃𝑥 =𝑃1 𝑥 where:
x is the rank of the city’s population,
Px is the population size of the city which is ranked x P1 is the population size of the largest city in the sample
The current rank-size rule application to the distribution of cities of Turkey for the years 2000 and 2012 are given in Figure 1. While the slope was 1.11 for 2000, it increased to 1.19 for 2012. Although the slope of the year 2000 fit perfectly to the rank-size rule, the slope of the year 2012 shows a reduction of small cities in size and number as already discussed above, and a small bump for the second small city group (noted in Table 4) due to the rapid increase in the number of cities between 50,000-100,000. Meanwhile, the cities around 1,000,000 illustrate a population growth above the rank-size rule slope, such as Kayseri, Konya, Antalya and Kocaeli due to their international trade and tourism activities.
Moreover, the shifts in the rank order of cities are investigated and the results are illustrated in (Figure 2). During 2000-2012, the top 12 cities maintained a stable position with one exception. Kocaeli,
85
IC O N ARP. 20 18 .3 9 – E-ISSN : 21 47 -9380
an important industrial center, was replaced by Antalya which grew more rapidly due to its intensive tourism investments and provided many service jobs to stimulate a large amount of in-migration from economically backward provinces(Yazgi et al., 2014). In addition, Antalya attracted retired people from economically advanced cities such as Ankara, Istanbul and Izmir due to its amenities and climate as explained by Bahar et al. (Bahar, Laçiner, Bal, & Özcan, 2009) and Var et al. (2014), which is a phenomenon also observed in some other countries (Walters, 2002). At the same time, it can be observed that more top level cities became stabilized due to economic development and economic integration than during the period between 1945 and 1975. Investigation of the mobility in the rank order of cities with populations between 500,000 and 1,000,000 shows that while the rank order of 24% of cities increased, it decreased for 58% of the cities. Meanwhile, the rank order of 18% of the cities remained stable. For the 43 cities between 100,000-500,000, while 14% of them experienced a population decrease, the populations of the others increased. With respect to the mobility within the rank order of cities, while the rank order of 24% of cities decreased, 60% increased and 16% remained stable. While the rank-order of 72% of cities between 50,000-100,000 increased, 24% decreased and 4% remained stable. Meanwhile, 33% of cities moved up to the population size group between 100,000-500,000. Mobility in the rank order of cities was higher for cities between 10,000-50,000. While 48.9% of their population increased to some extent as a result of counter-urbanization (Akgun, Baycan-Levent, & Nijkamp, 2010), 31.7% decreased and 19.4% fell below 10,000. According to Zeyneloğlu (Zeyneloğlu, 2008), in general, while the small towns which have a central position are gaining population, the ones which are located in the periphery are losing inhabitants. Only 8.3% moved to the group that has a population between 50,000-100,000. As can be observed from Figure 2 and Table 4, there was a shrinking trend in both number and size for this group. This could be the result of transformation of an agricultural economy into an industrial and service economy which stimulated the mobility of certain cities to the higher level of the urban hierarchy while others could not adjust to the new system and fell below the 10,000 population limit.
olu m e 6, Is su e 1 / Pu bli shed : Jun e 20 18
Moreover, the rank-size rule has been applied at the provincial level for the year 2000. According to the results of this analysis, there are primacy characteristics in 76% of the provinces due to their high level of production and trade at the country and/or
Figure 1 Rank-size Rule
Application in Turkey in 2000 and 2012
Figure 2 Rank-size shift of Turkish cities between 2000 and 2012
IC O N ARP. 20 18 .3 9 – E-ISSN : 21 47 -9380
international level, and the concentration of industry in provinces such as Bursa, Kocaeli, Adana and Gaziantep (Akgüngör, 2006; Falcioğlu & Akgüngör, 2008) (Figure 3). This trend can be explained by Krugman’s (Krugman, 1991) hypothesis that regions become more specialized and industries became more concentrated with economic integration. The provinces with higher slopes have higher concentrations of industry and service sectors than the surrounding provinces which may serve to determine the economically integrated sub-regions, as illustrated by Gezici and Hewings (Gezici & Hewings, 2004), and the development axes in the country (Figure-3). These growth centers have become magnets for in-migration from neighboring provinces and less developed provinces from different parts of the country (Akın & Dökmeci, 2014; Yazgi et al., 2014). Eventually, the decentralization of industry and trade from the growth centers to their periphery, urbanization and primacy level of these provinces increased in 2012 (Figure 4). Thus, the ratio of the provinces which had primacy reached to 83% at the country level.
In addition, over urbanization in some developing regions can be explained by Clark’s (1998) study that cities have grown because of the influx of manufacturing and service jobs from developed economies, and the in-migration of workers displaced by agricultural adjustment. In particular, China’s recent urban development has benefited from trends in land and housing marketization and economic globalization (Wu, 2001). While urban concentration, and especially the tendency of some developing countries to have very large primary cities, benefits from larger market potential and lower transportation costs (Krugman, 1996), the necessary infra-structure construction and operation costs are beyond the means of developing countries. Even in some of these cities, such as those in Mexico, traffic congestion can reach such a high level that residents abandon their homes, resulting in ghost towns (Burnett, 2014).
olu m e 6, Is su e 1 / Pu bli shed : Jun e 20 18
REGRESSION ANALYSIS OF THE RANK-SIZE RULE WITH RESPECT TO CHARACTERISTICS OF THE PROVINCES
The relationships between the slope line of city distribution according to their rank order and the characteristics of the provinces have been investigated by the use of a regression analysis. The slope of the distribution of city sizes is taken as a dependent variable, and the characteristics of the provinces such as population growth rate, population density, net migration, number of physicians per 10,000 people, education level, energy consumption per capita, industrial and service employment ratios are taken as independent variables. The results of the regression analysis are shown in Table 5 for the year 2000 and Table 6 for the year 2012.
Among the variables which are taken into consideration for the year 2000, the number of physicians per 10,000 people has the highest value (β=0.37) in relation to the slope of city size distribution. This is parallel to the results of Dokmeci et al., (1994) in which the physician ratio increased according to the urbanization level in Turkey. The second important factor is the population growth rate (β=0.35), which is an expected result. The third is the population density, which is closely related to urbanization as illustrated by Henderson (2002) and Chen et al.,
Figure 3 b values of the slope of city size distribution in the provinces in 2000
Figure 4 b values of the slope of city size distribution in the provinces in 2012
IC O N ARP. 20 18 .3 9 – E-ISSN : 21 47 -9380
(2008). The fourth is the industrial employment ratio (β=0.27), which is parallel to the findings of some the previous studies such as (Moir, 1976; Scott & Storper, 2007).
Table 5 Regression Results of the Relationships between the Slopes of City Size Distributions and the Characteristics of Provinces in 2000
Variables B STD.
Error
Beta t Sig.
(Constant) .136 .282 .483 .630 Population growth rate .000 .000 .357 3.131 .003 Net migration ratio
-5.829E-005 .000 -.304 -2.349 .022 Population density .095 .032 .300 2.994 .004 Number of physician per
10,000
.057 .016 .377 3.574 .001 Industrial employment ratio .015 .006 .278 2.669 .009 R²= .450 Adj. R²= .411 Std. Error= .541
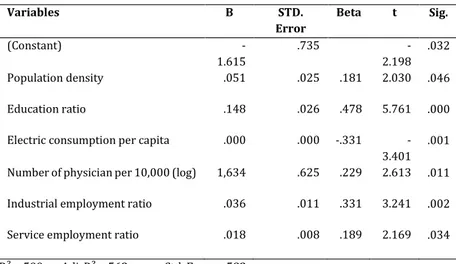
Table 6 Regression Results of the Relationships between the Slopes of City Size Distributions and the Characteristics of Provinces in 2012
Variables B STD. Error Beta t Sig. (Constant) -1.615 .735 -2.198 .032 Population density .051 .025 .181 2.030 .046 Education ratio .148 .026 .478 5.761 .000 Electric consumption per capita .000 .000 -.331
-3.401 .001 Number of physician per 10,000 (log) 1,634 .625 .229 2.613 .011 Industrial employment ratio .036 .011 .331 3.241 .002 Service employment ratio .018 .008 .189 2.169 .034 R²= .599 Adj. R²= .562 Std. Error= .582
According to the results of regression analysis for the year 2012, the most important factor to be related to the slope of city size distribution is the education ratio (β= 0.47). This is an expected result since the educational level is an important component of industry and services and thus development of the urban system. It has been analyzed by Lai and Zheng (2005) in China, Audretsch et al. (2005) in Germany and Faggian and McCann (2009) in England. In the Turkish case, it is probable that the government policy to increase the number of universities to answer to the keen demand at the country level, and also to increase the competitiveness of the country at the international level, has affected the role of education. The second important variable is the industrial employment ratio (β=0.33), as illustrated by cities with high industrial employment such as Istanbul and Bursa
olu m e 6, Is su e 1 / Pu bli shed : Jun e 20 18
becoming magnets for higher in-migration rates (Yazgı et al., 2013). The third is the number of physicians per 10,000 people (β=0.22) which is parallel to the findings in 2000. The fourth is the service employment ratio (β=0.189) which has already been illustrated by several studies that show that the service sector is the basic function of urbanization, especially due its high importance in the post-modern period (Daniels, 2002; Sassen, 2013). The fifth is population density (β=.181), which is in general considered to be another basic variable for urbanization as illustrated by previous studies (McDonald & Bowman, 1976; Shoshany & Goldshleger, 2002). The relationship between electric consumption per capita and the slope of city distribution line proved to be negative (β= -0.33). As illustrated by Poumanyvong and Kaneto (2010), urbanization decreases energy use in the low income groups while it increases energy use in the middle and high-income groups. Thus, the slope of city size distribution is a result of contradicting forces in a region.
With regard to the comparison between the years 2000 and 2012, the number of significant variables and the R² values increased over time. Meanwhile, it is to be expected that if the slope of the city size distribution is higher than the Zipf value, then the industrial and service sectors not only serve the province itself but also the surrounding provinces and/or country. If the slope is much lower than the Zipf value, the province is not yet economically fully developed and it is dependent on the cities of surrounding provinces or on higher levels of the urban hierarchy. Usually, the economy of these provinces is still heavily dependent on the agricultural sector and includes places such as Kars, Igdır and Ardahan, which are located in the East of the country. At the same time, these provinces are located in the periphery of the urban system, which is a handicap to attract in-migrants (Siegel and Woodyard (1974). Thus, the result of the rank-size rule is a representative of economic development and the integration of the regions is dependent on their location within the urban hierarchy.
CONCLUSION
An increasing concern of scholars from various disciplines of social sciences is whether the rank-size rule is still an accurate representation technique for city size distribution. In this study, the city size distribution is analyzed at the country and provincial level by the use of rank-size rule in Turkey for the years 2000 and 2012, and the results are compared with the findings related to 1945 and 1975. The results of this study show that despite the political and economic transformations of the last decade, there is a perfect adjustment of the city size distribution to the rank-size
91
IC O N ARP. 20 18 .3 9 – E-ISSN : 21 47 -9380
rule at the country level due to existence of a well-established urban system which has developed throughout the centuries. In addition, mobility in the rank order of cities for the years 2000 and 2012 are analyzed and the relationships between the slopes of city size distribution and the characteristics of provinces are investigated by the use of a regression analysis for the same years. After the 1950’s, Turkey experienced a rapid urbanization process due to the transformation of its economy from rural to industrial, which caused rural migration to the cities. Between 1945-1975, while the number of cities was increased threefold, their urban population grew by x4.8. However, between 2000 and 2012, while the number of cities decreased 8.5%, especially due to a decrease in the number of small cities, their urban population increased 37%. Current urbanization is affected more by urban-to-urban migration than rural-to-urban migration. Moreover, recent urbanization can also be explained to some extend by the influx of manufacturing and service jobs from developed countries. Between 1945-2012, while the number of cities increased fourfold, the urbanization ratio increased only threefold. Thus, the rapid urbanization process was reflected in the dynamic characteristics of rank-size distribution and shifts in the rank order of cities.
In general, the rank-size distribution of cities in Turkey is quite regular when compared with other developing countries. Since 1945, the city system has moved to a state more adjusted to the rank- size rule in parallel to economic development and integration of the country and especially after the development of middle size cities, which were below the expectation of the rank-size rule, during the period between 1945-1975. Recent city-rank-size distribution between 2000-2012 show that despite the regular growth of large and middle size cities, some of the small cities were shrinking in number and size due to the transformation of an agricultural economy into an industrial and service economy. However, it may be expected that recent large infrastructure and urban development projects in both the center and the suburbs of Istanbul (Eraydin & Taşan‐Kok, 2014) will definitely increase the ‘attractiveness’ of the city, but they will also add to its ‘primacy’ characteristics both now and in the future.
Moreover, investigation of the mobility in the rank order of city sizes for the years 2000 and 2012 reveals that the top level of the city hierarchy is more stable than that of smaller cities. Mobility in the rank order is upward as investment increases, such as that for tourism, new industry and/or higher education facilities since it stimulates in-migration, and is downward if an existing industry is closed down and produces out-migration of jobless people.
olu m e 6, Is su e 1 / Pu bli shed : Jun e 20 18
Application of the rank-size rule at the province level reveals different results according to the characteristics and location of provinces. While 76% of city size distribution of provinces shows ‘primacy’ characteristics in 2000, this ratio increased to 83% in 2012. This means that their growing industrial and service production not only serves at the provincial level but also at the country and/or international level. Their location illustrates the economically integrated sub-regions as well as the development axes in the country. Thus, the level of their primacy represents a hierarchy in terms of the degree of their integration with the national and international economy.
Moreover, the relationships between the slope of city size distribution and the characteristics of the provinces have been analyzed through regression analysis for both 2000 and 2012. According to the results, the number of significant variables and the values of R² have increased during over the last decade. While the number of physicians per 10,000 people had the highest relationship to the slope of city size distribution in 2000, the education ratio had the highest value in 2012, probably as a reflection of tremendous increase in the number of universities throughout the country during the last decade. Although the industrial employment ratio was found to be meaningful in both periods, the service employment ratio became meaningful in 2012, probably as a reflection of the increasing importance of the service sector in the post-modern era. As expected, population density is meaningful during both periods since it is considered to be one of the basic characteristics of urbanization. Energy consumption produced a negative relationship, in line with previous studies showing that it is common in low-income communities. Thus, the characteristics of city size distribution are a function of the development and integration of the provinces and their geographical potential with respect to their location, and market potential in relation to their environment.
Superior sites are those with better geography – better climate and on the coast – and better market potential. As trade theory predicts, better market potential – larger neighbors nearby – enhances a city’s demand and growth potential. However, the potential effect of a positive marginal market die out as the market potential becomes very large and nearby competitors erode the market (Black & Henderson, 2003). During this process, when the metropolitan areas began to decentralize, urbanization levels start to increase in their surrounding areas, as observed in this study.
The results of the study can be useful for urban and regional planners, economists, geographers, demographers, investors and
93
IC O N ARP. 20 18 .3 9 – E-ISSN : 21 47 -9380
policy makers. Investigation of the relationships between the hierarchy of cities and trade, the development of transportation networks, migration and the economic development of the provinces is suggested for further research.
REFERENCES
Akgun, A. A., Baycan-Levent, T., & Nijkamp, P. (2010). Business dynamics as the source of counterurbanisation: An empirical analysis of Turkey. International Journal of Sustainable Development, 13(1-2), 200-215.
Akgüngör, S. (2006). Geographic concentrations in Turkey's manufacturing industry: identifying regional highpoint clusters. European Planning Studies, 14(2), 169-197. Akın, D., & Dökmeci, V. (2014). Cluster analysis of interregional
migration in Turkey. Journal of Urban Planning and Development, 141(3), 05014016.
Anderson, G., & Ge, Y. (2005). The size distribution of Chinese cities. Regional Science and Urban Economics, 35(6), 756-776.
Audretsch, D. B., Lehmann, E. E., & Warning, S. (2005). University spillovers and new firm location. Research policy, 34(7), 1113-1122.
Bahar, H. I., Laçiner, S., Bal, I., & Özcan, M. (2009). Older migrants to the Mediterranean: the Turkish example. Population, Space and Place, 15(6), 509-522.
Berry, B. J., & Okulicz-Kozaryn, A. (2012). The city size distribution debate: Resolution for US urban regions and megalopolitan areas. Cities, 29, S17-S23.
Black, D., & Henderson, V. (2003). Urban evolution in the USA. Journal of Economic Geography, 3(4), 343-372.
Brakman, S., Garretsen, H., & Van Marrewijk, C. (2001). An introduction to geographical economics: Trade, location and growth: Cambridge university press.
Burnett, V. (2014). Mexican building boom yields ghost towns. International New York Times.
Chen, H., Jia, B., & Lau, S. (2008). Sustainable urban form for Chinese compact cities: Challenges of a rapid urbanized economy. Habitat international, 32(1), 28-40.
Clark, D. (1998). Interdependent urbanization in an urban world: an historical overview. Geographical Journal, 85-95. Cori, B. (1984). The national settlements system of Italy. In R. S.
L.S. Bourne, and K. Dziewonsky (Ed.), Ekistics (pp. 157-177): Oxford University Press.
Coulton, C. J., Chow, J., Wang, E. C., & Su, M. (1996). Geographic concentration of affluence and poverty in 100 metropolitan areas, 1990. Urban Affairs Review, 32(2), 186-216.
Daniels, P. W. (2002). Services and metropolitan development: international perspectives: Routledge.
Deliktas, E., Önder, A. Ö., & Karadag, M. (2013). The size distribution of cities and determinants of city growth in Turkey. European Planning Studies, 21(2), 251-263.
olu m e 6, Is su e 1 / Pu bli shed : Jun e 20 18
Dobkins, L. H., & Ioannides, Y. M. (2000). Dynamic evolution of the US city size distribution. The economics of cities, 217-260. Dokmeci, V., Dagoglu, T., & Tanyolac, N. (1994). Istanbul health system for year 2000. Hospital Management International, 98-101.
Dokmeci, V. F. (1986). Turkey: Distribution of cities and change over time. Ekistics, 13-17.
Dökmeci, V. F. (1981). Urbanization pattern in Turkey and its future development: Department of Economics. Free University.
Eaton, J., & Eckstein, Z. (1997). Cities and growth: Theory and evidence from France and Japan: National Bureau of Economic Research.
Eeckhout, J. (2004). Gibrat's law for (all) cities. American Economic Review, 94(5), 1429-1451.
Eraydin, A., & Taşan‐Kok, T. (2014). State response to contemporary urban movements in Turkey: A critical overview of state entrepreneurialism and authoritarian interventions. Antipode, 46(1), 110-129.
Faggian, A., & McCann, P. (2009). Universities, agglomerations and graduate human capital mobility. Tijdschrift voor economische en sociale geografie, 100(2), 210-223. Falcioğlu, P., & Akgüngör, S. (2008). Regional specialization and
industrial concentration patterns in the Turkish manufacturing industry: An assessment for the 1980– 2000 period. European Planning Studies, 16(2), 303-323. Fan, C. C. (1988). The temporal and spatial dynamics of city-size
distributions in China. Population Research and Policy Review, 7(2), 123-157.
Gabaix, X. (1999). Zipf's law for cities: an explanation. The Quarterly journal of economics, 114(3), 739-767.
Gan, L., Li, D., & Song, S. (2006). Is the Zipf law spurious in explaining city-size distributions? Economics Letters, 92(2), 256-262.
Gezici, F., & Hewings, G. J. (2004). Regional convergence and the economic performance of peripheral areas in Turkey. Review of Urban & Regional Development Studies, 16(2), 113-132.
Gezici, F., & Hewings, G. J. (2007). Spatial analysis of regional inequalities in Turkey. European Planning Studies, 15(3), 383-403.
Giesen, K., & Südekum, J. (2010). Zipf's law for cities in the regions and the country. Journal of Economic Geography, 11(4), 667-686.
Guérin-Pace, F. (1995). Rank-size distribution and the process of urban growth. Urban studies, 32(3), 551-562.
Henderson, V. (2002). Urbanization in developing countries. The World Bank Research Observer, 17(1), 89-112.
Ioannides, Y. M., & Overman, H. G. (2003). Zipf’s law for cities: an empirical examination. Regional Science and Urban Economics, 33(2), 127-137.
Jiang, B., & Jia, T. (2011). Zipf's law for all the natural cities in the United States: a geospatial perspective. International
95
IC O N ARP. 20 18 .3 9 – E-ISSN : 21 47 -9380
Journal of Geographical Information Science, 25(8), 1269-1281.
Kali, R. (2003). The city as a giant component: a random graph approach to Zipf's law. Applied Economics Letters, 10(11), 717-720.
Kaya, H. S., & Dökmeci, V. (2017). Development of urban hierarchies at the country and regional levels in Turkey. A| Z ITU Journal of the Faculty of Architecture, 14(2), 131-149. Krugman, P. (1991). Increasing returns and economic geography.
Journal of political economy, 99(3), 483-499.
Krugman, P. (1996). Urban concentration: the role of increasing returns and transport costs. International Regional Science Review, 19(1-2), 5-30.
Lai, D.-s., & Zheng, Q.-h. (2005). Urbanization and Education Development in Transitional Stage of China [J]. Journal of Beijing Normal University (Social Science Edition), 5, 004. Le Gallo, J., & Chasco, C. (2008). Spatial analysis of urban growth
in Spain, 1900–2001. Empirical economics, 34(1), 59-80. McDonald, J. F., & Bowman, H. W. (1976). Some tests of alternative
urban population density functions. Journal of Urban Economics, 3(3), 242-252.
Moir, H. (1976). Relationships between urbanization levels and the industrial structure of the labor force. Economic Development and Cultural Change, 25(1), 123-135. Mu, L., & Wang, X. (2006). Population landscape: a geometric
approach to studying spatial patterns of the US urban hierarchy. International Journal of Geographical Information Science, 20(6), 649-667.
Parr, J. B. (1985). A note on the size distribution of cities over time. Journal of Urban Economics, 18(2), 199-212.
Poumanyvong, P., & Kaneko, S. (2010). Does urbanization lead to less energy use and lower CO2 emissions? A cross-country analysis. Ecological Economics, 70(2), 434-444.
Reed, W. J. (2002). On the rank‐size distribution for human settlements. Journal of Regional Science, 42(1), 1-17. Saichev, A., Malevergne, Y., & Sornette, D. (2010). Introduction
Theory of Zipf's Law and Beyond (pp. 1-7): Springer. Sassen, S. (2013). The global city-New York, London, Tokyo, New
Jersey. New Jersey: The Princeton University Press. Schaffar, A., & Dimou, M. (2012). Rank-size city dynamics in China
and India, 1981–2004. Regional studies, 46(6), 707-721. Scott, A., & Storper, M. (2007). Regions, globalization,
development. Regional studies, 37(6-7), 579-593.
Shoshany, M., & Goldshleger, N. (2002). Land-use and population density changes in Israel—1950 to 1990: analysis of regional and local trends. Land Use Policy, 19(2), 123-133. Siegel, J., & Woodyard, M. (1974). Position in the urban hierarchy
as a determinant of in-migration. Land Economics, 50(1), 75-82.
Soo, K. T. (2005). Zipf's Law for cities: a cross-country investigation. Regional Science and Urban Economics, 35(3), 239-263.
Statistics, S. I. o. (1945). Statistical Yearbook of Turkey 1945. Retrieved from
olu m e 6, Is su e 1 / Pu bli shed : Jun e 20 18
Statistics, S. I. o. (1975). Statistical Yearbook of Turkey 1975. Retrieved from
Statistics, S. I. o. (1994). Statistical Yearbook of Turkey 1994 [Press release]
Statistics, S. I. o. (2000). Statistical Yearbook of Turkey 2000. Retrieved from
Statistics, S. I. o. (2002). Statistical Yearbook of Turkey 2002. Retrieved from
Statistics, S. I. o. (2003). Statistical Yearbook of Turkey 2003. Retrieved from
Statistics, S. I. o. (2012). Statistical Yearbook of Turkey 2012. Retrieved from
Tekeli, I. (2008). Türkiye’de Bölgesel Eşitsizlikler ve Bölge Planlama Yazıları: Istanbul, Tarih Vakfı Yayınları.
Turk, S., & Dokmeci, V. (2001). ’The application of expanded rank-size model in Turkish urban settlements. Paper presented at the 41st Congress of the European Regional Science Association, Zagreb, Croatia.
Var, E. B., Yazgı, B., & Dokmeci, V. (2014). Age and cohort analysis of regional migration in Turkey. Regional Science Inquiry, 6(1), 81-94.
Walters, W. H. (2002). Later-life migration in the United States: A review of recent research. Journal of Planning Literature, 17(1), 37-66.
Waugh, D. (2000). Geography: An integrated approach: Nelson Thornes.
Wu, F. (2001). China's recent urban development in the process of land and housing marketisation and economic globalisation. Habitat international, 25(3), 273-289. Yazgi, B., Dokmeci, V., Koramaz, K., & Kiroglu, G. (2014). Impact of
characteristics of origin and destination provinces on migration: 1995–2000. European Planning Studies, 22(6), 1182-1198.
Zeyneloglu, S., Kundak, S., & Dokmeci, V. (2005). Methods and Data consideration related to the rank size distributions of settlements. Acts of the ERSA.
Zeyneloğlu, S. (2008). Türkiye’de Yerleşim Birimlerinin Dağılımı ve Merkezî Yerlerin Nüfuslarındaki Değişim: Dengeli Bir Yerleşim Dağılımı İçin Öneriler. Fen Bilimleri Enstitüsü. Zipf, G. K. (1949). Human behavior and the principle of least effort:
An introduction to human ecology. Cambridge: MA: Addison-Wesley Press.
Resume
Seda Kundak (PhD 2006) has been working at Istanbul Technical University, Faculty of Architecture, Department of Urban and Regional Planning. She has been working in the field of risk assessment, vulnerability and resilience at urban scale. She participated graduate programs on natural hazards and disaster mitigation at the University of Geneva (2005), ETH Zurich (2006) and Kobe University (2008). She has accomplished her post-doctoral researches at the Politecnico di Milano (2009-2011) in the ENSURE Project (FP7). She has been the member of the Executive Board of
97
IC O N ARP. 20 18 .3 9 – E-ISSN : 21 47 -9380
Society for Risk Analysis – Europe since 2012. Currently she is the President of Society for Risk Analysis Europe (2017-2019). She is the Sigma Xi Distinguished Lecturer Award Winner for 2018-2019. Prof.Dr. Vedia Dökmeci is a professor emeritus of Istanbul Technical University, Faculty of Architecture, Urban and Regional Planning Department. Dr. Dökmeci has many publications, 7 books and was involved in numerous professional activities, including design competitions, research projects, and fellowships, many of which intersected urban and environmental planning. In 2001 she established Real Estate Development Master Program at Istanbul Technical University.