SMALL REVIVAL IN DOMESTIC DEMAND
Zümrüt İmamoğlu* ve Barış Soybilgen
†Executive Summary
In May, industrial production index (IPI) increased by 1.1 percent, import volume index increased by 6.2 percent and export volume index decreased by 0.5 percent from April. The high increase in imports curbed the positive contribution of net exports to growth. On the other hand, increases in consumer and investment goods imports indicate revival of domestic demand. Second quarter economic indicators announced so far shows that second quarter real GDP growth will compensate the 0.4 percent decline in the first quarter. Betam’s quarter on quarter (QoQ) growth forecast for the second quarter of 2012 is 0.6 percent. The corresponding year on year (YoY) growth rate is 2.3 percent.
Following the slowdown in the economy, trade and current account deficits continue to decline rapidly. In May, the trade deficit decreased by $1.6 billion and fell to $8.6 billion from the previous year. The current account deficit decreased by $2 billion and fell to $5.8 billion. We expect that the ratio of current account deficit to * Dr. Zümrüt İmamoğlu, Betam, Research Associate. [email protected]
† Barış Soybilgen, Betam, Research Assistant, [email protected]
GDP will fall to 8.5 percent at the end of the second quarter from 9.3 percent at the end of the first quarter.
Table 1. Betam’s quarterly and annual growth rate forecasts
Source: Betam
*sa: seasonally and calendar day adjusted **ca: calendar day adjusted
2nd Quarter looks more promising
Data for economic indicators released so far show revival of the domestic demand in the second quarter. We expect growth in the second quarter to compensate for the 0.4 percent decline in the real GDP in the first quarter. Revival can be seen in investment and consumption expenditures. In the manufacturing sector, both durable and nondurable goods production increased in May while consumer and investment goods imports surged.
2012 2. Quarter
Forecast Real GDP growth, %
(quarter on quarter, sa*) 0.6
Real GDP growth, %
(year on year, ca**) 2.3
Current account deficit
(% of GDP, annual) 8.5
Economic Outlook and Forecasts:
July 2012
Following the increase in imports, special consumption tax (SCT) income also increased.
On the other hand, it is not clear how long the revival will last. Following the decline in May, Capacity utilization rate (CUR) also fell in June. Real sector confidence index continued to deteriorate and exports fell slightly in May. Even though we expect that the contribution of net exports to the growth was positive in the second quarter, the high increase in imports in June partially curbed the positive contribution of net exports.
Due to the revival in the second quarter, policy makers have not been yet forced to conduct expansionary policies. However, YoY growth in the second quarter may remain low due to the base effect and the revival in the domestic demand can reduce the contribution of net exports to the growth further. Betam’s QoQ growth forecast for the second quarter fell to 0.6 percent from 1.0 percent last month due to the high increase in imports. Therefore, we estimate the corresponding YoY growth rate as 2.3 percent, a much lower rate than the government’s target of 4 percent for the year end.
Consumption revives in May
Economic indicators announced this month indicates a strong recovery in private consumption expenditure. Consumer goods imports experienced a surge in May and increased by 18.1 percent. Moreover, durable and nondurable consumer goods production increased by 4.4 percent and 1.9 percent, respectively. In line with the increase in
imports, SCT income increased by 5.4 percent. Finally, the consumer confidence index increased by 0.9 percent in May. Therefore, we believe that private consumption expenditure contributed to the growth positively in the second quarter.
Mixed signals from investment
In the second quarter of 2012, economic indicators that we used to forecast GDP growth exhibit mixed signals. CUR decreased by 0.4 percent in April, 1.1 percent in May and 1.4 percent in June. Moreover, real sector confidence also deteriorated in the last three months at an accelerated pace. Because both real sector confidence index and CUR declined in May and June, we expected the IPI to fall in May as well. However, IPI increased by 1.1 percent in May, a stronger than expected gain by the market as well. Now there is a clear gap between the IPI and the CUR as shown in Figure 1. The decline in CUR may indicate that real sector is investing. However, our indicators for investment are sending mixed signals. Investment goods imports are very volatile. They slumped in April, declining by 11.7 percent. Then in May, showing strong recovery, they increased by 10.6 percent. Overall, private investment expenditure in the second quarter exhibited great uncertainty.
Surge in imports in May
Figure 2 shows monthly changes of seasonally adjusted import and export volume indices. In May, export volume index decreased by 0.5 percent whereas import volume index increased by 6.3 percent. But still trade deficit in May declined
from the same month of the previous year by $1.6 billion. The slowdown in the economy continues to shrink the trade deficit but the monthly increase in imports signal a small revival in domestic demand compared to the previous quarter. At the same time it limits the positive contribution of net exports to growth in the second quarter.
Current account deficit continues to fall
The trade deficit was $10.2 billion last May and it reduced down to $8.5 billion this year. Following the decline in the trade deficit, the current account deficit also decreased. The current account deficit in May was $5.8 billion. The increase in exports and the decline in imports caused the reduction in the deficit. Due to the revival of the domestic demand in the second quarter and the increase in imports in May, we raise our forecast on the current account to GDP ratio at the end of the second quarter from 8.3 percent to 8.5 percent.
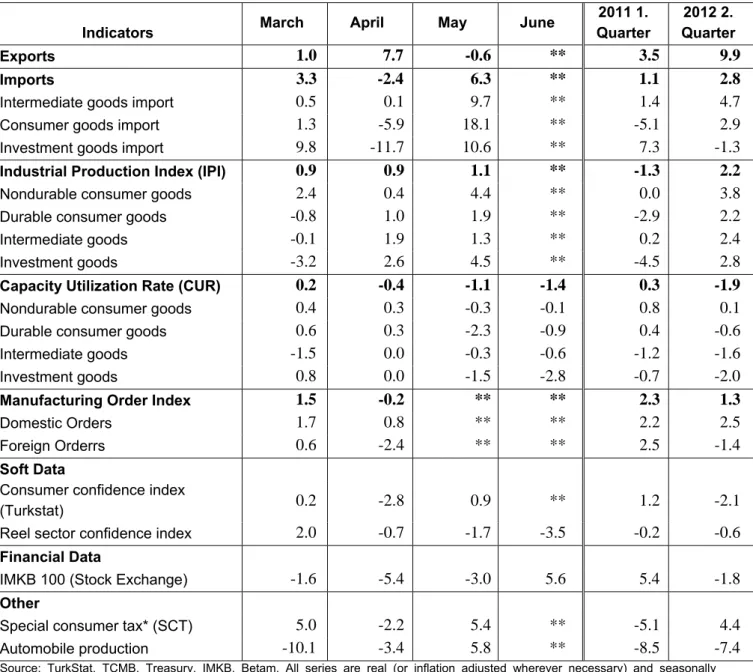
Table 2. Monthly and quarterly changes of Betam’s selected indicators (real and sa)
Indicators March April May June
2011 1. Quarter 2012 2. Quarter Exports 1.0 7.7 -0.6 ** 3.5 9.9 Imports 3.3 -2.4 6.3 ** 1.1 2.8
Intermediate goods import 0.5 0.1 9.7 ** 1.4 4.7
Consumer goods import 1.3 -5.9 18.1 ** -5.1 2.9
Investment goods import 9.8 -11.7 10.6 ** 7.3 -1.3
Industrial Production Index (IPI) 0.9 0.9 1.1 ** -1.3 2.2
Nondurable consumer goods 2.4 0.4 4.4 ** 0.0 3.8
Durable consumer goods -0.8 1.0 1.9 ** -2.9 2.2
Intermediate goods -0.1 1.9 1.3 ** 0.2 2.4
Investment goods -3.2 2.6 4.5 ** -4.5 2.8
Capacity Utilization Rate (CUR) 0.2 -0.4 -1.1 -1.4 0.3 -1.9
Nondurable consumer goods 0.4 0.3 -0.3 -0.1 0.8 0.1
Durable consumer goods 0.6 0.3 -2.3 -0.9 0.4 -0.6
Intermediate goods -1.5 0.0 -0.3 -0.6 -1.2 -1.6
Investment goods 0.8 0.0 -1.5 -2.8 -0.7 -2.0
Manufacturing Order Index 1.5 -0.2 ** ** 2.3 1.3
Domestic Orders 1.7 0.8 ** ** 2.2 2.5
Foreign Orderrs 0.6 -2.4 ** ** 2.5 -1.4
Soft Data
Consumer confidence index
(Turkstat) 0.2 -2.8 0.9 ** 1.2 -2.1
Reel sector confidence index 2.0 -0.7 -1.7 -3.5 -0.2 -0.6
Financial Data
IMKB 100 (Stock Exchange) -1.6 -5.4 -3.0 5.6 5.4 -1.8
Other
Special consumer tax* (SCT) 5.0 -2.2 5.4 ** -5.1 4.4
Automobile production -10.1 -3.4 5.8 ** -8.5 -7.4
Source: TurkStat. TCMB. Treasury. IMKB. Betam. All series are real (or inflation adjusted wherever necessary) and seasonally adjusted.
*This tax is collected on sales of goods such as gas, fuel oils, alcohol and tobacco products and automobiles. **Data not yet released.
Figure 1: Capacity utilization rate and industrial production index (sa. left axis for CUR and right axis for IPI)
95 100 105 110 115 120 125 130 135 60 65 70 75 80 85 Ja n -0 7 Ma y-0 7 Se p -0 7 Ja n -0 8 Ma y-0 8 Se p -0 8 Ja n -0 9 Ma y-0 9 Se p -0 9 Ja n -1 0 Ma y-1 0 Se p -1 0 Ja n -1 1 Ma y-1 1 Se p -1 1 Ja n -1 2 Ma y-1 2 CUR IPI
Source : TurkStat. Betam
Figure 2: Volume indices of exports and imports (sa) 120 130 140 150 160 170 180 190 200 210 220 Ja n -0 7 May -07 Se p -0 7 Ja n -0 8 May -08 Se p -0 8 Ja n -0 9 May -09 Se p -0 9 Ja n -1 0 May -10 Se p -1 0 Ja n -1 1 May -11 Se p -1 1 Ja n -1 2 May -12 Export Import
Source : TurkStat. Betam
Figure 3: Ratio of current account deficit to GDP (yearly)
0 2 4 6 8 10 12 200 8( 1) 200 8( 2) 200 8( 3) 200 8( 4) 200 9( 1) 200 9( 2) 200 9( 3) 200 9( 4) 201 0( 1) 201 0( 2) 201 0( 3) 201 0( 4) 201 1( 1) 201 1( 2) 201 1( 3) 201 1( 4) 201 2( 1) 20 12(2) *
Source: TCMB. TurkStat. Betam * Betam’s forecasts
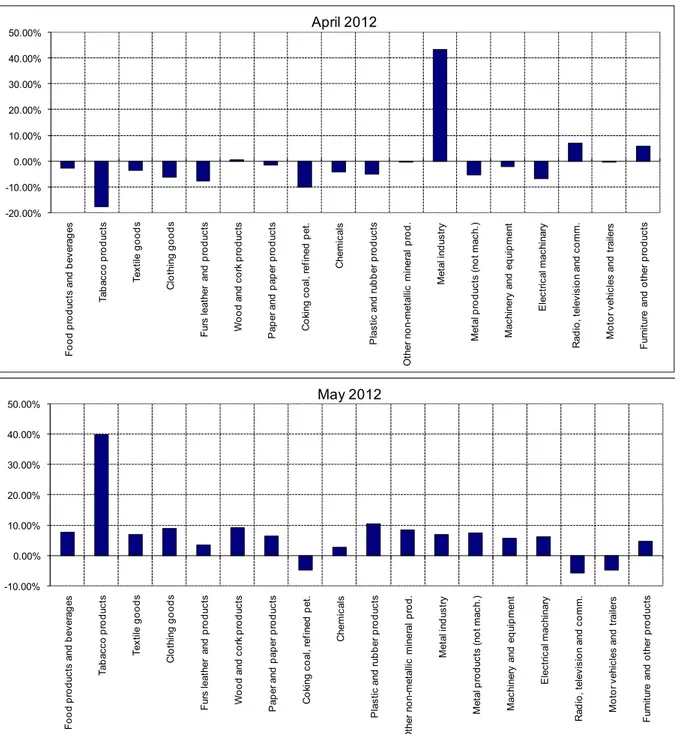
Figure 4: Monthly changes of manufacturing industry exports (sa) -10.00% 0.00% 10.00% 20.00% 30.00% 40.00% 50.00% F o o d pr odu ct s a nd be ve ra ge s Ta ba cc o pr o d uc ts Te xt ile goo ds C lot hi ng goods F ur s l ea th er a nd pr odu ct s W ood a nd c o rk p rod uc ts P ape r a nd pa pe r pr odu ct s C o ki ng c o al , r ef ine d p et . Che m ic al s P la st ic a nd r ubbe r p rodu ct s O ther no n-m et al lic m iner al p ro d . Me ta l in d us tr y M et al pr odu ct s (n ot m ac h. ) M ac hi ne ry and eq ui p m ent E lec tr ic al m ac hi nar y R ad io , t el evi si o n a nd co m m . M o to r v ehi cl es a nd t rai le rs F ur ni tu re an d o the r p ro d uc ts May 2012 -20.00% -10.00% 0.00% 10.00% 20.00% 30.00% 40.00% 50.00% F ood pr o d uc ts a nd be ve ra ge s Ta ba cc o pr o d uc ts Te xt ile good s C lo th in g go ods F ur s l eat he r and p ro d uc ts W o o d a nd c o rk pr odu ct s P ap er a nd pa pe r p rod uc ts C o ki ng c o al , r ef ined p et . C hem ic al s P la st ic a nd ru bbe r pr odu ct s O th er n o n-me ta llic mi ne ra l p ro d . Me ta l in d us tr y M et al pr odu ct s ( not m ac h. ) M ac hi ner y and eq ui p m en t Ele ct ric al m ac hin ar y R ad io , te le vi si o n a nd c o m m . M o to r v ehi cl es a nd t ra ile rs F ur ni tu re a nd ot he r pr odu ct s April 2012