ORIGINAL PAPER
Drought hazard, vulnerability, and risk assessment in Turkey
Ismail Dabanli1,2,3Received: 22 February 2018 / Accepted: 23 August 2018 / Published online: 12 September 2018 # Saudi Society for Geosciences 2018
Abstract
Drought has multiple impacts on socioeconomic sectors, and it is expected to increase in the coming years due to non-stationary nature of climate change and variability. Drought hazard and vulnerability are investigated based on hydro-meteorological and actual socioeconomic data for provinces of Turkey. Drought vulnerability and risk assessment are essential parts of drought phenomenon; however, lack of proper integrated drought risk assessment in Turkey (and elsewhere) might lead to higher socioeconomic impacts. Drought Hazard Index (DHI) is derived based on the probability of drought occurrences using Standardized Precipitation Index (SPI). Besides, Drought Vulnerability Index (DVI) is calculated by utilizing four socioeconomic indicators to quantify drought impact on society. Finally, Drought Risk Index (DRI) is obtained by multiplying DHI and DVI for provinces of Turkey to highlight the relative importance of hazard and vulnerability assessment for drought risk management. A set of drought hazard, vulnerability, and composite risk map is prepared for further interpretations. The analyses reveal that among 81 administrative provinces, 73 are exposed to low drought risk (0 < DRI < 0.25), 6 provinces to moderate drought risk (0.25 < DRI < 0.50), and 1 province (Konya) to high drought risk (0.50 < DRI < 0.75). These maps can assist stakeholders to identify the regional drought vulnerability to help mitigation strategy developments and for effective water resource management.
Keywords Risk mapping . Kriging . Standard precipitation index . Socioeconomic assessment
Introduction
Drought is concerned with recurring climate phenomena be-cause of water deficit over a certain period. Extreme drought conditions are known to influence agriculture, environment, and health activities leading to severe socioeconomic reper-cussions (Rahman and Lateh2016; Mishra and Singh2010; Dai2013). The global water demand is set to increase due to rapid population growth as well as globalization (Zhang et al.
2011). However, global climate model projections show that increase in drought occurrence result from either decreased
precipitation and/or increased evaporation (Dai 2011; Trenberth2011).
Being in a sensitive climate change hotspot, the Mediterranean region is not immune to global changes (Diffenbaugh and Giorgi 2012). Studies have indicated an increase in frequency (Venkataraman et al.2016) and severity (Gampe et al.2016) of Mediterranean droughts. In Turkey, the drought occurrence and severity follow the Mediterranean patterns. Several studies are concerned with diverse drought characteristics, which are specific to Turkey including quanti-fication of drought intensity, severity, and duration by various drought indes utilizations (Şen2015).
Models of drought propagation and occurrences are pro-posed to assist drought planning and mitigation (Tosunoglu and Can2016) in addition to establishment of teleconnections for major climate oscillations by spatiotemporal frequency analysis (Dogan et al. 2012). Researches related to drought risk assessment in a socioeconomic context are still in their blooming stages. Socioeconomic drought vulnerability as-sessment is essential to plan the future policy actions to reduce the potential for possible damages (Rajsekhar et al. 2015). Along this direction, Sönmez et al. (2005) reveal that droughts * Ismail Dabanli
1
School of Engineering and Natural Sciences, Civil Engineering Department, Istanbul Medipol University, 34810 Istanbul, Turkey
2 Climate Change Researches Application and Research Center,
(IKLIMER) Kavacık, Istanbul Medipol University, Istanbul, Turkey
3
Glenn Department of Civil Engineering, Clemson University, Clemson, SC 29634, USA
pose significant risk to agriculture in the southeastern Anatolia region of Turkey. Kahraman and Kaya (2009) estimated the drought risks on Istanbul dams using several processes based on few indices. Şen et al. (2012) studied the drought risk associated with crop productivity for future projections. Gumus and Algin (2017) investigated meteorological and hy-drological drought in Seyhan Basin using SPI (Standard Precipitation Index) and SDI (Streamflow Drought Index). Also, drought characteristics of Turkey are employed compar-ing SPI and modified SPI results by Türkeş and Tatlı (2009). In this study, although some reasonable differences are inves-tigated between classical SPI and modified SPI, general re-sults do not illustrate big difference with respect to classical SPI. Recently, Dabanlı et al. (2017) assessed spatiotemporal variability of droughts including (SO) Southern Oscillation effects in Turkey.
The socioeconomic drought impact (risk) for Turkey has not been investigated, although the previous studies provide basic information. Socioeconomic aspects usually involve factors like damage lost, population density, agricultural land, access to domestic water, etc. It is expected that a drought with high socioeconomic value might result in more loss than the other hazards (Mishra and Singh2010). Over the past 30 years, Turkey has experienced a tremendous growth in urbanization fueled by its open economic policies and industrialization (World Bank Report2015). Water demand enhances based on increasing population progressively. Finally, changes on land use especially changes in irrigated land areas are in-creased based on different politics. These changes make the Turkey more vulnerable to droughts. It is, therefore, necessary to have a comprehensive understanding of drought implica-tions on socioeconomic sectors in terms of hazard, vulnerabil-ity, and risk assessments.
Globally, many studies have emphasized that a suitable way to assess the drought risk is by combining the socioeco-nomic hazard and vulnerability of a region (Shahid and Behrawan2008; Verdon-Kidd and Kiem2010; Lin et al.
2011; Belal et al.2012; Weng et al. 2015, Rajsekhar et al.
2015, Jia and Wang 2016; Pei et al. 2016). Definition of vulnerability and risk changes is based on a different perspective. Wisner et al. (1994) defined risk as a product of hazard and vulnerability. In the case of drought too, several studies have used similar definitions for drought risk pattern identification. Although multiple studies evaluated drought risk assessment, only few of them considered both hazard and vulnerability factors joint incorporation (Rajsekhar et al.
2015) to investigate the socioeconomic ability of the region to cope with the drought event (Shahid and Behrawan2008).
Application of some of the drought studies based on socio-economic information include potential drought-related im-pact by environmental and socioeconomic factor consider-ation (Knutson et al.1998), integration of stakeholder’s
infor-mation in drought vulnerability assessment (Fontaine and
Steinemann2009), and system-based agricultural drought vul-nerability assessment (Wilhelmi and Wilhite2002).
Because of complexity of droughts, the standardized indi-ces are generally preferred for drought studies, for example, Standardized Precipitation Index (SPI) and Palmer Drought Severity Index (PDSI). The SPI is a commonly used indicator due to its simple structure (Dutra et al.2014). Türkeş and Tatlı
(2009) developed modified SPI by comparing results to clas-sical SPI. Furthermore, Reconnaissance Drought Index (RDI) based on the ratio of cumulative precipitation to potential evapotranspiration was developed by Tsakiris et al. (2007). The standardized precipitation evapotranspiration index (SPEI) is used based upon the difference between potential evapotranspiration and cumulative precipitation (Vicente-Serrano et al.2010). Among the dozens of drought index, multivariate drought index (MDI) (Rajsekhar et al. 2014), multivariate standardized drought index (MSDI) (Hao and AghaKouchak 2013), and triple drought indicator (TDI) (Şen2015) are the frequently seen recent studies.
Based on the literature background, a simple methodology is followed for drought risk assessment identifying vulnerabil-ity levels of provinces in Turkey. For this purpose, rainfall data are used to calculate SPI leading to drought hazard calculation by assigning weights and ratings to SPI probability distribu-tion (Kim et al.2015). Regional vulnerability to droughts is then identified by integrating four socioeconomic indicators like population density, total agricultural areas, irrigated land areas, and municipal water.
Study area and data
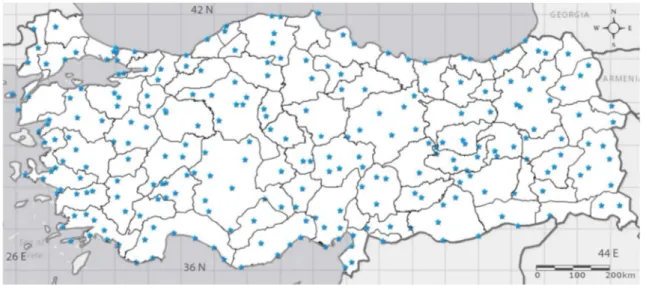
Turkey is an intercontinental (Europe and Asia) country locat-ed between 26 and 45 E and 36–42 N longitudes and latitudes, respectively. Homogeneously distributed precipitation data are available from 250 rain gauges scattered over 81 adminis-trative provinces of Turkey (Fig. 1). Monthly precipitation data are obtained from Turkish State Meteorological Service (TSMS), (http://www.mgm.gov.tr) between 1971 and 2010. The north part of Turkey can be regarded as rainfall-intense regions in comparison to other parts especially in winter and spring seasons. Summer droughts are prolonged towards the south and west sides of the country. Agricultural sector and urban populations are settled on these regions due to favorable geographical features and climatic conditions.
The spatial pattern of annual rainfall is presented in Fig.2. It can be observed that annual rainfall increases towards the north-eastern Black Sea coast of Turkey and the magnitude varies from 24 to 228 cm. The driest regions are in the middle and southeastern parts of Turkey, whereas the wettest pattern is observed in the northeastern parts with limited spatial extent.
The socioeconomic data, which include population density, municipal water supply, total agricultural and irrigated land,
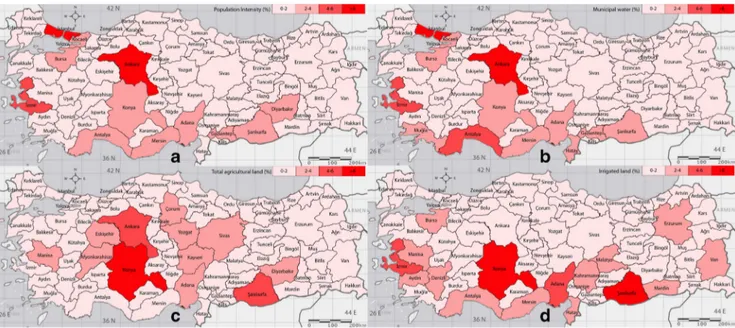
are obtained from Turkish Statistical Institute (http://www. tuik.gov.tr). The percentage distribution of socioeconomic data (based on total aggregation) for provinces is illustrated in Fig. 3. Population density is highly correlated with municipal water demand except in few provinces (e.g., Muğla, Antalya, Hatay, and Diyarbakır). On the other hand, total agricultural and irrigation lands are not strongly correlated in few provinces. For example, although total agricultural land of Ankara is classified in (4–6) % interval, the irrigation land is scored within (0–2) %. Similarly, total agricultural lands of several provinces are rather extensive, but irrigated lands are not equally extensive. It is expected that severity of drought hazard could be more hazardous especially in non-irrigated land areas.
Methodology
The SPI methodology provides a proxy to quantify drought. Risk assessment of an extreme event can be carried out using hazard, vulnerability, and risk (Rajsekhar et al.2015).
Standardized precipitation index
The Standardized Precipitation Index (SPI) is used to quantify drought due to its simple procedure and standardization. SPI ensures that drought quantification at any location and on any time is consistent. The computational procedure for deriving SPI involves the following steps.
Fig. 1 Spatial map showing administrative provinces and selected rain gauges in Turkey (number of administrative provinces 81; number of rain gauges 250)
1. First, an appropriate probability density function (PDF) is fitted to the precipitation aggregated over the time scale of interest
2. Each PDF is then transformed into a standardized normal probability distribution
The detailed mathematical procedure for calculation of SPI can be found in McKee et al. (1993), Guttman (1999), Mishra and Singh (2010), andŞen (2015). Considering that drought and its socioeconomic impact evolve at a longer temporal scale (window), SPI-12 is adapted in this paper to quantify drought hazard, vulnerability, and risk. SPI-based drought classification is presented in Table1.
Drought hazard index
In general, hazard quantifies a potentially damaging phe-nomenon probability of occurrence, which ranges be-tween 0 and 1. It is measured as the product of magnitude and the associated frequency of drought event occurrence.
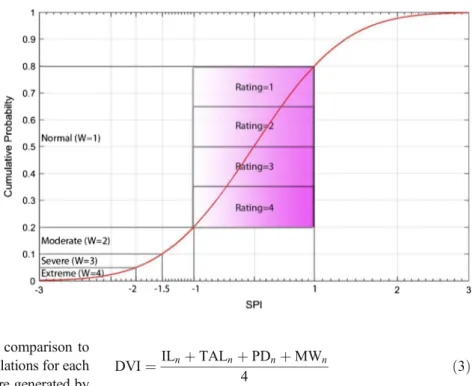
Using a weighting system based on the cumulative distri-bution function (Fig.4), weight (W) and rating (R) scores are assigned based on the normal cumulative probability function for drought hazard assessment associated with severity and occurrence probabilities. Weight scores are determined from the SPI intervals, such that weight is equal to 1, 2, 3, and 4 for normal (ND), moderate (MD), severe (SD), and extreme (ED) droughts, respectively. On the other hand, weights for SPI > 0 are equal to zero. Similarly, rating scores are assigned from 1 to 4 in in-creasing order by dividing the interval of cumulative probabilities in each drought range.
Weight and rating scores are assigned based on the inter-vals, which are illustrated in Fig.4. Multiplication of weight and rating scores generates drought hazard score (DHS), which is calculated for each SPI values between 1971 and 2010. The aggregated DHS is obtained by the following ex-pression: DHS ð Þi¼ ∑ i¼1 NSPI WixRi ð1Þ
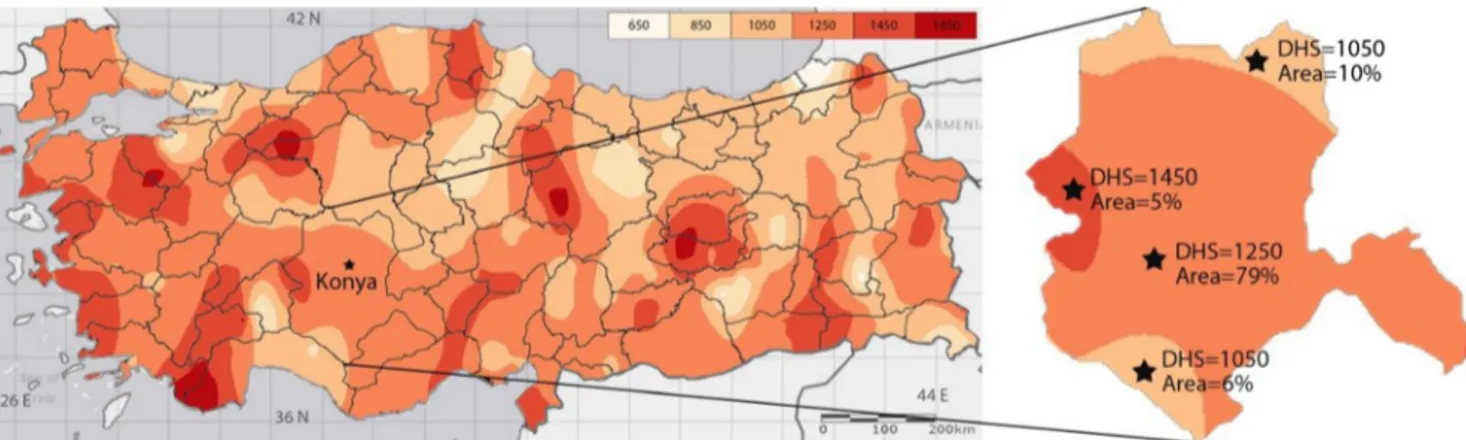
whereNSPIrefers to number of SPI values for selected time interval. After obtaining DHSs for 250 gauges, drought hazard contour map (Fig.6) is generated by using Kriging method-ology. To obtain DHI for provinces, contour map percentage area A (%) and corresponding DHS are aggregated within province boundary according to
DHI ð Þi¼ ∑n
i¼1A %ð Þix DHSð Þi ð2Þ
Fig. 3 Socioeconomic data for provinces of Turkey. a Population intensity (%). b Municipal water demand (%). c Total agricultural land areas (%). d Irrigated land areas (%)
Table 1 Drought classifications based on SPI
Probability (%) SPI Drought category
2.30 SPI≥ 2.00 Extreme wet
4.40 2.00 > SPI≥ 1.50 Very wet 9.20 1.50 > SPI≥ 1.00 Moderate wet 68.20 1.00 > SPI≥ −1.00 Normal
9.20 − 1.00 ≥ SPI > −1.50 Moderate drought 4.40 − 1.50 ≥ SPI > −2.00 Severe drought 2.30 − 2.00 ≥ SPI Extreme drought
This methodology is more appropriate in comparison to Thiessen polygon methodology for DHI calculations for each province. Boundaries of Thiessen polygons are generated by sharp lines; however, in this methodology, hazard region tran-sition boundaries are smooth. Therefore, this approach can generate more realistic hazard scores in province scale.
Drought vulnerability index
Vulnerability is a relative measure, and it indicates the degree to which a system is susceptible to damage (harm) due to the occurrence of an event (Smit et al.1999). Vulnerability is closely related to the socioeconomic conditions of a region and a potential indicator to measure maximum loss or harm during the event. Several studies conducted vulnerability as-sessment related to the effect of climate changes on water resources (Metzger et al. 2005). They may not adequately reflect drought scenarios especially at the local level and may not be relevant across multiple sectors (Fontaine and Steinemann2009). The selection of vulnerability indicators or variables varies based on local study context and purposes. Four socioeconomic indicators are selected in this study, which includes irrigated land (IL), total agricultural land (TAL), population density (PD), and municipal water (MW) for Drought Vulnerability Index (DVI) calculations with the following equation:
DVI¼ILnþ TALnþ PDnþ MWn
4 ð3Þ
where ILn, TALn, PDn, and MWn are normalized values assigned to irrigated land, total agricultural land, population density, and municipal water, respectively. Each indicator is normalized within its own range and common distribution interval is adjusted for all indicators to overcome the different unit effects. The DVI is re-scaled into four classes, namely, low vulnerability (0 < DVI < 0.25), moderate (0.25 < DVI < 0.50), high (0.5 < DVI < 0.75), and very high (0.75 < DVI < 1.0).
Drought risk index
Drought risk assessment is investigated by incorporating the hazard and vulnerability indexes. Typically, the drought risk index (DRI) is calculated as multiplication of DHI with DVI. There will be no risk when either DVI or DHI is 0, but higher value of either DVI or DHI will result in risk increment. To quantify drought risk, both hazard and vulnerability informa-tion are essential. The quantitative assessments of drought risk are vital for coping with drought hazard consequences. Drought risk index is calculated by using a conceptual model presented in Fig.5using DHI and DVI.
Fig. 4 Weight and rating scores based on normal cumulative probability distribution of SPI
Results and discussion
Drought hazard assessment
After obtaining DHSs for 250 gauges, drought hazard contour map is generated by using Kriging methodology as in Fig.6. Cumulative sum of DHS values between 1971 and 2010 can be directly related to drought hazard. Accordingly, Fig. 6
proves consistency with higher drought scores over the south-ern and westsouth-ern parts of Turkey. Magnitude of precipitation is lower in the southern and western parts of Turkey.
The cumulative distributions of DHS for rain gauges are fitted by normal CDF as in Fig.7. The fitted normal CDF is validated by Kolmogorov-Smirnov test for 95% confidence interval. It is expected that SPI and DHS distributions should be similar to each other. This coherence of normal probability distribution makes DHS calculation well directed.
To obtain province-scale DHI, contour map percentage ar-ea A (%) and corresponding DHS are aggregated within Fig. 6 Drought hazard assessment contour maps and sample illustration DHS and corresponding areas of Konya for DHI calculation
Fig. 7 The CDF of total drought scores in average of 250 stations between 1971 and 2010
province boundary by using Eq.2. In Fig.6, DHS and corre-sponding area percentages are presented for Konya province, which is the largest in Turkey to illustrate the DHI calculation procedures.
Drought hazard scores (DHS) and drought severity per-centages are calculated leading to DHI calculations as 1229 (1229 = 1250 × 0.79 + 1450 × 0.05 + 1050 × 0.16) from Eq.2. The similar calculation procedure is applied for other prov-inces in Turkey. The DHI scores are normalized through re-scaling between 0 and 1. The provinces are classified based on the DHI into four classes such asBlow^ between 0 and 0.25, Bmoderate^ between 0.25 and 0.50, Bhigh^ between 0.5 and 0.75, andBvery high^ between 0.75 and 1.0. After obtaining
four drought hazard classes, drought hazard map is generated as shown in Fig.8. The DHI map shows more severity on the south and the west provinces of Turkey. This is due to that the south and west part altitudes of the Turkey are lower with respect to the east and north. This feature makes these prov-inces warmer due to the warm weather movement effects.
Drought vulnerability assessment
Generally, vulnerability is known as an indicator of sensibility or resilience to cope with the consequences of natural disasters (Wilhelmi and Wilhite2002). Several studies investigated the link between climate change impacts on water resources and Fig. 9 Drought vulnerability map for Turkey based on DVI
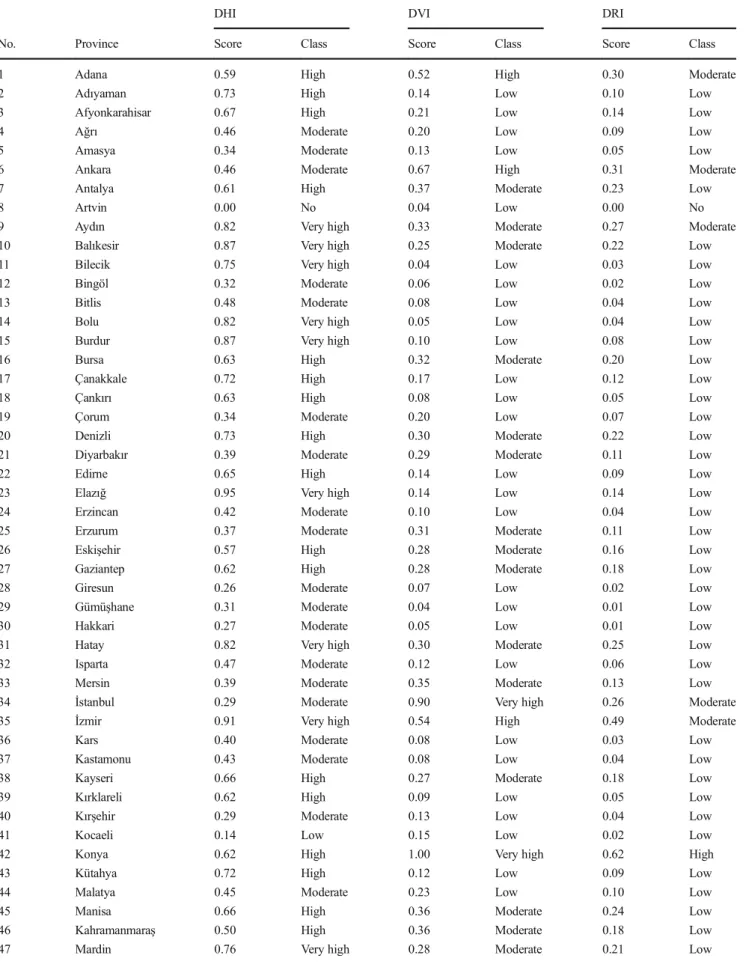
Table 2 DHI, DVI, and DRI scores for 81 provinces in Turkey
DHI DVI DRI
No. Province Score Class Score Class Score Class
1 Adana 0.59 High 0.52 High 0.30 Moderate
2 Adıyaman 0.73 High 0.14 Low 0.10 Low
3 Afyonkarahisar 0.67 High 0.21 Low 0.14 Low
4 Ağrı 0.46 Moderate 0.20 Low 0.09 Low
5 Amasya 0.34 Moderate 0.13 Low 0.05 Low
6 Ankara 0.46 Moderate 0.67 High 0.31 Moderate
7 Antalya 0.61 High 0.37 Moderate 0.23 Low
8 Artvin 0.00 No 0.04 Low 0.00 No
9 Aydın 0.82 Very high 0.33 Moderate 0.27 Moderate
10 Balıkesir 0.87 Very high 0.25 Moderate 0.22 Low
11 Bilecik 0.75 Very high 0.04 Low 0.03 Low
12 Bingöl 0.32 Moderate 0.06 Low 0.02 Low
13 Bitlis 0.48 Moderate 0.08 Low 0.04 Low
14 Bolu 0.82 Very high 0.05 Low 0.04 Low
15 Burdur 0.87 Very high 0.10 Low 0.08 Low
16 Bursa 0.63 High 0.32 Moderate 0.20 Low
17 Çanakkale 0.72 High 0.17 Low 0.12 Low
18 Çankırı 0.63 High 0.08 Low 0.05 Low
19 Çorum 0.34 Moderate 0.20 Low 0.07 Low
20 Denizli 0.73 High 0.30 Moderate 0.22 Low
21 Diyarbakır 0.39 Moderate 0.29 Moderate 0.11 Low
22 Edirne 0.65 High 0.14 Low 0.09 Low
23 Elazığ 0.95 Very high 0.14 Low 0.14 Low
24 Erzincan 0.42 Moderate 0.10 Low 0.04 Low
25 Erzurum 0.37 Moderate 0.31 Moderate 0.11 Low
26 Eskişehir 0.57 High 0.28 Moderate 0.16 Low
27 Gaziantep 0.62 High 0.28 Moderate 0.18 Low
28 Giresun 0.26 Moderate 0.07 Low 0.02 Low
29 Gümüşhane 0.31 Moderate 0.04 Low 0.01 Low
30 Hakkari 0.27 Moderate 0.05 Low 0.01 Low
31 Hatay 0.82 Very high 0.30 Moderate 0.25 Low
32 Isparta 0.47 Moderate 0.12 Low 0.06 Low
33 Mersin 0.39 Moderate 0.35 Moderate 0.13 Low
34 İstanbul 0.29 Moderate 0.90 Very high 0.26 Moderate
35 İzmir 0.91 Very high 0.54 High 0.49 Moderate
36 Kars 0.40 Moderate 0.08 Low 0.03 Low
37 Kastamonu 0.43 Moderate 0.08 Low 0.04 Low
38 Kayseri 0.66 High 0.27 Moderate 0.18 Low
39 Kırklareli 0.62 High 0.09 Low 0.05 Low
40 Kırşehir 0.29 Moderate 0.13 Low 0.04 Low
41 Kocaeli 0.14 Low 0.15 Low 0.02 Low
42 Konya 0.62 High 1.00 Very high 0.62 High
43 Kütahya 0.72 High 0.12 Low 0.09 Low
44 Malatya 0.45 Moderate 0.23 Low 0.10 Low
45 Manisa 0.66 High 0.36 Moderate 0.24 Low
46 Kahramanmaraş 0.50 High 0.36 Moderate 0.18 Low
drought vulnerability (Eakin and Conley2002; Metzger et al.
2005; Brooks et al.2005; Kim et al.2015), but the objective assessment of vulnerability often neglects socioeconomic var-iables. Herein, several socioeconomic local variables are pre-sented to assess drought vulnerability to fill these kinds of regional gaps.
Prolonged drought event has a direct impact on socioeco-nomic sectors. For example, the rate of evapotranspiration increases during drought period leading to depletion in soil moisture, which is directly linked to the agricultural activity and food productions. Similarly, the reductions in stream flow
and reservoir storage cause agricultural and municipal water supply deficits. Thus, drought is directly associated with mu-nicipal and agricultural water shortages, which severely affect irrigated agricultural areas and population. In this paper, de-pending on the availability of reliable socioeconomic data, four indicators are selected, such as irrigated land (IL), total agricultural land (TAL), population density (PD), and munic-ipal water (MW). The drought vulnerability is calculated by substitution of four socioeconomic indicator parameters into Eq.3. The vulnerability map based on DVI is presented as in Fig.9. It is observed that Konya andŞanlıurfa provinces have Table 2 (continued)
DHI DVI DRI
No. Province Score Class Score Class Score Class
48 Muğla 0.88 Very high 0.19 Low 0.17 Low
49 Muş 0.58 High 0.13 Low 0.07 Low
50 Nevşehir 0.44 Moderate 0.14 Low 0.06 Low
51 Niğde 0.84 Very high 0.15 Low 0.13 Low
52 Ordu 0.31 Moderate 0.11 Low 0.03 Low
53 Rize 0.18 Low 0.03 Low 0.01 Low
54 Sakarya 0.47 Moderate 0.15 Low 0.07 Low
55 Samsun 0.31 Moderate 0.24 Low 0.07 Low
56 Siirt 0.63 High 0.06 Low 0.04 Low
57 Sinop 0.84 Very high 0.05 Low 0.04 Low
58 Sivas 0.50 Moderate 0.26 Moderate 0.13 Low
59 Tekirdağ 0.64 High 0.14 Low 0.09 Low
60 Tokat 0.67 High 0.16 Low 0.11 Low
61 Trabzon 0.31 Moderate 0.08 Low 0.02 Low
62 Tunceli 0.89 Very high 0.04 Low 0.03 Low
63 Şanlıurfa 0.61 High 0.75 Very high 0.46 Moderate
64 Uşak 0.65 High 0.07 Low 0.05 Low
65 Van 0.63 High 0.26 Moderate 0.16 Low
66 Yozgat 0.26 Moderate 0.20 Low 0.05 Low
67 Zonguldak 0.42 Moderate 0.05 Low 0.02 Low
68 Aksaray 0.53 High 0.16 Low 0.08 Low
69 Bayburt 0.31 Moderate 0.05 Low 0.02 Low
70 Karaman 0.65 High 0.14 Low 0.09 Low
71 Kırıkkale 0.31 Moderate 0.09 Low 0.03 Low
72 Batman 0.77 Very high 0.08 Low 0.06 Low
73 Şırnak 0.66 High 0.07 Low 0.05 Low
74 Bartın 1.00 Very high 0.02 Low 0.02 Low
75 Ardahan 0.62 High 0.02 Low 0.01 Low
76 Iğdır 0.65 High 0.08 Low 0.05 Low
77 Yalova 0.40 Moderate 0.03 Low 0.01 Low
78 Karabük 0.65 High 0.03 Low 0.02 Low
79 Kilis 0.60 High 0.04 Low 0.02 Low
80 Osmaniye 0.65 High 0.11 Low 0.07 Low
very high vulnerability, because of their extensive agricultural lands, whereas Istanbul province has very high vulnerability, because of its population density. Similarly, Adana, Ankara and Izmir are identified as high vulnerability provinces, be-cause of their dense population and large agricultural land. Likewise, many interpretations can be extracted from this vul-nerability map to understand existing circumstances of each province. The common feature for moderate vulnerability re-gions that consist of 15 provinces can be attributed to agricul-ture and population density. In these 15 provinces, the ratio of IL, TAL, PD, and MW are calculated as 36, 26, 27, and 29%, respectively. Furthermore, the northern Turkey vulnerability is low due to the relatively lower population and agricultural land. Most of the provinces in the northern and eastern side of Turkey are located at higher altitudes with mountainous areas, and it may be possible to say that lower vulnerability pattern may be correlated with elevation of Turkey in these regions.
Drought risk index assessment
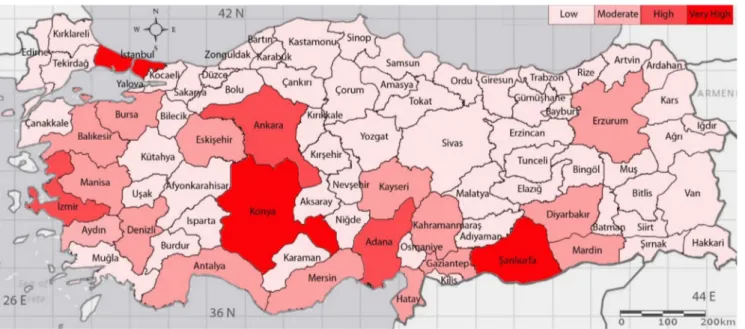
The DRI is generated based on meteorological and socioeco-nomic information by multiplying DHI with DVI. The drought risk map is generated based on DRI as in Fig.10. Each province is categorized into four groups like DHI and DVI class intervals.
If one of DVI or DHI is equal toB0,^ then the DRI score becomesB0,^ which means that there is no drought risk as in the Artvin province as in Fig.10. Similarly, if one of DVI or DHI is higher, then the DRI becomes higher. In other words, DVI and DHI have essential contributions on DRI assessment. This drought risk assessment method can help to identify and compare drought risk among provinces to reduce and mitigate the adverse drought hazard results. The generated maps for drought hazard, vulnerability, and risk help to identify spatial distribution of drought risk indicators. Based on the DHI map (Fig.8), Sinop, Bartın, Bolu, Bilecik, Balıkesir, Izmir, Aydın,
Muğla, Burdur, Niğde, Hatay, Mardin, Batman, Elazığ, and Tunceli are classified in the highest level of drought hazard. On the other hand, depending on the DVI maps in Fig.9, three major provinces (Istanbul, Konya, andŞanlıurfa) have very
high degree of vulnerability. Hence, considering both the DHI and the DVI, the DRI map (Fig.10) indicates Konya province poses a highest drought risk in Turkey. Also, Istanbul, Ankara, Izmir, Adana, Şanlıurfa, and Aydın have moderate drought risks based on DRI scores. The results of DHI, DVI, and DRI are summarized in Table 2to identify drought risk for different provinces.
According to this table, among 81 provinces, 73 are ex-posed to the low drought risk (0 < DRI < 0.25), 6 to the mod-erate drought risk (0.25 < DRI < 0.50), only Konya province to the high drought risk (0.50 < DRI < 0.75), and only Artvin has no drought risk (DRI = 0.00). The district of Konya has extensive agricultural and irrigated land, which leads to the high drought vulnerability and risk. Arvin has relatively zero DHI, which has no drought risk due to its highest amount of annual rainfall regime. Among the moderate-risk-scored prov-inces, highest population density is sensible for Istanbul. Other provinces in moderate level (Ankara, Adana, İzmir, Aydın, and Şanlıurfa) can be explained by both agricultural land and population density with respect to low-score prov-inces. Corresponding percentages of occurrence from gener-ated maps are presented in Table3for DHI, DVI, and DRI.
Based on literature review, previous studies did not assess drought risk based on DVI and DHI for provinces of Turkey. This approach can provide meaningful information for drought management studies in Turkey. High-risk provinces can mitigate drought risk through local but effective water resource managements. For this purpose, the policy makers should develop appropriate measures to protect existing water supplies in risky provinces.
Conclusion
In this paper, spatial drought risk pattern is quantified by in-corporating hazard and vulnerability for provinces in Turkey. The drought hazard index is identified by using SPI weight and rating scores between 1971 and 2010. The drought vul-nerability analysis is conducted using four socioeconomic in-dicators related to water demand and supply. Drought risk is assessed by using DHI and DVI for the administrative districts Table 3 DHI, DVI, and DRI
percentages for 81 provinces in Turkey
Level DHI DVI DRI
Count Percentage (%) Count Percentage (%) Count Percentage (%)
No 1 1.23 – 0.00 1 1.23 Low 2 2.47 58 71.60 73 90.12 Moderate 31 38.27 17 20.99 6 7.41 High 32 39.51 3 3.70 1 1.23 Very high 15 18.52 3 3.70 – 0.00 Total 81 100 81 100 81 100
of Turkey. Drought hazard, vulnerability, and risk maps are generated based on DHI, DVI, and DRI for investigating spa-tial variability of droughts. It was observed that 73 cities are exposed to the low, 6 cities to the moderate, 1 city (Konya) to the high, and finally only 1 city (Artvin) to the no drought risk. Furthermore, the conceptual drought risk model depending on actual socioeconomic variables can help to minimize drought impacts in Turkey. This information can be used to identify provinces that are most vulnerable to drought with relative assessment among the provinces. The socioeconomic indica-tors can be further included to generate drought risk maps for vulnerability analysis and to develop strategies to minimize socioeconomic impacts.
Acknowledgments The corresponding author would like to express his appreciation to TUBITAK for its research support at Clemson University. Also, the author wishes to thank Turkish State Meteorological Service (TSMS) for the supply of long-term monthly mean climatic variables. I would also like to thank the anonymous referees for their valuable sug-gestions and constructive comments that have greatly improved my paper.
Funding information This study is supported by The Scientific and Technological Research Council of Turkey (TUBITAK) with grant num-ber 1059B141501044.
References
Belal A-A, El-Ramady HR, Mohamed ES, Saleh AM (2012) Drought risk assessment using remote sensing and GIS techniques. Arab J Geosci 7:35–53.https://doi.org/10.1007/s12517-012-0707-2
Brooks N, Adger W, Kelly P (2005) The determinants of vulnerability and adaptive capacity at the national level and the implications for adaptation. Glob Environ Chang 15:151–163.https://doi.org/10. 1016/j.gloenvcha.2004.12.006
Dabanlı İ, Mishra AK, Şen Z (2017) Long-term spatio-temporal drought variability in Turkey. J Hydrol 552:779–792.https://doi.org/10. 1016/j.jhydrol.2017.07.038
Dai A (2011) Drought under global warming: a review. Wiley Interdiscip Rev Clim Chang 2(1):45–65.https://doi.org/10.1002/wcc.81
Dai A (2013) Increasing drought under global warming in observations and models. Nat Clim Chang 3(1):52–58.https://doi.org/10.1038/ nclimate1633
Diffenbaugh NS, Giorgi F (2012) Climate change hotspots in the CMIP5 global climate model ensemble. Clim Chang 114(3–4):813–822.
https://doi.org/10.1007/s10584-012-0570-x
Dogan S, Berktay A, Singh VP (2012) Comparison of multi-monthly rainfall-based drought severity indices, with application to semi-arid Konya closed basin, Turkey. J Hydrol 470–471:255–268.
https://doi.org/10.1016/j.jhydrol.2012.09.003
Dutra E, Wetterhall F, Di Giuseppe F, Naumann G, Barbosa P, Vogt J et al (2014) Global meteorological drought-part 1: probabilistic monitor-ing. Hydrol Earth Syst Sci 18(7):2657–2667.https://doi.org/10. 5194/hess-18-2657-2014
Eakin H, Conley J (2002) Climate variability and the vulnerability of ranching in southeastern Arizona: a pilot study. Clim Res 21:271– 282
Fontaine MM, Steinemann AC (2009) Assessing vulnerability to natural hazards: impact-based method and application to drought in
Washington State. Natural Hazards Review 10(1):11–18.https:// doi.org/10.1061/(ASCE)1527-6988(2009)10:1(11)
Gampe D, Ludwig R, Qahman K, Afifi S (2016) Applying the triangle method for the parameterization of irrigated areas as input for spa-tially distributed hydrological modeling—assessing future drought risk in the Gaza strip (Palestine). Sci Total Environ 543:877–888.
https://doi.org/10.1016/j.scitotenv.2015.07.098
Gumus V, Algin HM (2017) Meteorological and hydrological drought analysis of the Seyhan−Ceyhan River basins, Turkey. Met Apps 24: 62–73.https://doi.org/10.1002/met.1605
Guttman NB (1999) Accepting the standardized precipitation index: a calculation Algorithm1. J Am Water Resour Assoc 35(2):311–322.
https://doi.org/10.1111/j.1752-1688.1999.tb03592.x
Hao Z, AghaKouchak A (2013) Multivariate standardized drought index: a parametric multi-index model. Adv Water Resour 57:12–18 Jia H, Wang DPJ (2016) Risk mapping of integrated natural disasters in
China. Nat Hazards 80(3):2023–2035.https://doi.org/10.1007/ s11069-015-2057-3
Kahraman C, Kayaİ (2009) Fuzzy process accuracy index to evaluate risk assessment of drought effects in Turkey. Hum Ecol Risk Assess 15(4):789–810.https://doi.org/10.1080/10807030903051242
Kim H, Park J, Yoo J, Kim T (2015) Assessment of drought hazard, vulnerability, and risk: a case study for administrative districts in South Korea. J Hydro Environ Res 9(1):28–35.https://doi.org/10. 1016/j.jher.2013.07.003
Knutson TR, Tuleya RE, Kurihara Y (1998) Simulated increase of hurri-cane intensities in a CO2-warmed climate. Science 279(5353):1018–
1020.https://doi.org/10.1126/science.279.5353.1018
Lin ML, Chu CM, Tsai BW (2011) Drought risk assessment in western inner-Mongolia. Int J Environ Res 5(1):139e148
McKee TB, Doesken NJ, Kleist J (1993) The relationship of drought frequency and duration time scales. In: Eighth Conference on Applied Climatology. American Meteorological Society, Anaheim Metzger MJ, Leemans R, Schröter D (2005) A multidisciplinary
multiscale framework for assessing vulnerabilities to global change. Int J Appl Earth Obs 7:253–267.https://doi.org/10.1016/j.jag.2005. 06.011
Mishra AK, Singh VP (2010) A review of drought concepts. J Hydrol 391(1–2):202–216.https://doi.org/10.1016/j.jhydrol.2010.07.012
Pei W, Fu Q, Li DLT (2016) Assessing agricultural drought vulnerability in the Sanjiang plain based on an improved projection pursuit mod-el. Nat Hazards 82(1):683–701. https://doi.org/10.1007/s11069-016-2213-4
Rahman R, Lateh H (2016) Meteorological drought in Bangladesh: assessing, analyzing and hazard mapping using SPI, GIS and monthly rainfall data. Environ Earth Sci 75(12):1–20.https://doi. org/10.1007/s12665-016-5829-5
Rajsekhar D, Singh VP, Mishra AK (2014) Multivariate drought index: an information theory based approach for integrated drought assess-ment. J Hydrol 526:164–182.https://doi.org/10.1016/j.jhydrol. 2014.11.031
Rajsekhar D, Singh VP, Mishra AK (2015) Integrated drought causality, hazard, and vulnerability assessment for future socioeconomic sce-narios: an information theory perspective. J Geophys Res Atmos 120:6346–6378.https://doi.org/10.1002/2014JD022670
Şen Z (2015) Applied drought modeling, prediction, and mitigation, 1st edn. Elsevier, Amsterdam 484p
Şen B, Topcu S, Türkeș M, Sen B, Warner JF (2012) Projecting climate change, drought conditions and crop productivity in Turkey. Clim Res 52:175–191.https://doi.org/10.3354/cr01074
Shahid S, Behrawan H (2008) Drought risk assessment in the Western Part of Bangladesh. Nat Hazards 46:391–413.https://doi.org/10. 1007/s11069-007-9191-5
Smit B, Burton I, Klein RJ, Street R (1999) The science of adaptation: a framework for assessment. Mitig Adapt Strat Glob Chang 4:199– 213
Sönmez FK, Kömüşcü AÜ, Erkan A, Turgu E (2005) An analysis of spatial and temporal dimension of drought vulnerability in Turkey using the standardized precipitation index. Nat Hazards 35(2):243–
264.https://doi.org/10.1007/s11069-004-5704-7
Tosunoglu F, Can I (2016) Application of copulas for regional bivariate frequency analysis of meteorological droughts in Turkey. Nat Hazards 82(3):1457–1477. https://doi.org/10.1007/s11069-016-2253-9
Trenberth KE (2011) Changes in precipitation with climate change. Clim Res 47(1–2):123–138.https://doi.org/10.3354/cr00953
Tsakiris G, Pangalou D, Vangelis H (2007) Regional drought assessment based on the Reconnaissance Drought Index (RDI). Water Resour Manag 21(5):821–833
Türkeş M, Tatlı H (2009) Use of the standardized precipitation index (SPI) and a modified SPI for shaping the drought probabilities over Turkey. Int J Climatol 29:2270–2282.https://doi.org/10.1002/joc. 1862
Venkataraman K, Tummuri S, Medina A, Perry J (2016) 21st century drought outlook for major climate divisions of Texas based on CMIP5 multimodel ensemble: implications for water resource man-agement. J Hydrol 534:300–316.https://doi.org/10.1016/j.jhydrol. 2016.01.001
Verdon-Kidd DC, Kiem AS (2010) Quantifying drought risk in a nonsta-tionary climate. J Hydrometeorol 11:1019–1031.https://doi.org/10. 1175/2010JHM1215.1
Vicente-Serrano SM, Begueria S, Lopez-Moreno JI (2010) A multiscalar drought index sensitive to global warming: the standardized precip-itation evapotranspiration index. J Clim 23(7):1696–1718 Weng B, Zhang P, Li S (2015) Drought risk assessment in China with
different spatial scales. Arab J Geosci 8(12):10193–10202.https:// doi.org/10.1007/s12517-015-1938-9
Wilhelmi OV, Wilhite DA (2002) Assessing vulnerability to agricultural drought: a Nebraska case study. Nat Hazards 25:37–58.https://doi. org/10.1023/A:1013388814894
Wisner B, Blaikie P, Cannon T, Davis I (1994) At risk: natural hazards, peoples vulnerability and disasters, 2nd edn. Routledge, London Worldbank (2015) Mind, society, and behavior. Part 2: Psychological and
social perspectives on policy, Chapter 9: Climate change, Washington D.C.
Zhang Y, Seidel DJ, Golaz JC, Deser C, Tomas RA (2011) Climatological characteristics of Arctic and Antarctic surface-based inversions. J Clim 24(19):5167–5186.https://doi.org/10.1175/2011JCLI4004.1