PREDICTING RISK OF MORTALITY IN
PATIENTS UNDERGOING
CARDIOVASCULAR SURGERY
a thesis
submitted to the department of computer engineering
and the institute of engineering and science
of bilkent university
in partial fulfillment of the requirements
for the degree of
master of science
By
Ay¸sen Tunca
September, 2008
I certify that I have read this thesis and that in my opinion it is fully adequate, in scope and in quality, as a thesis for the degree of Master of Science.
Prof. Dr. Halil Altay G¨uvenir(Advisor)
I certify that I have read this thesis and that in my opinion it is fully adequate, in scope and in quality, as a thesis for the degree of Master of Science.
Assoc. Prof. Dr. R¨u¸chan Akar
I certify that I have read this thesis and that in my opinion it is fully adequate, in scope and in quality, as a thesis for the degree of Master of Science.
Assist. Prof. Dr. C¸ i˘gdem G¨und¨uz Demir
Approved for the Institute of Engineering and Science:
Prof. Dr. Mehmet B. Baray Director of the Institute
ABSTRACT
PREDICTING RISK OF MORTALITY IN PATIENTS
UNDERGOING CARDIOVASCULAR SURGERY
Ay¸sen Tunca
M.S. in Computer Engineering Supervisor: Prof. Dr. Halil Altay G¨uvenir
September, 2008
It is very important to inform the patients and their relatives about the risk of mortality before a cardiovascular operation. For this respect, a model called EuroSCORE (The European System for Cardiac Operative Risk Evaluation) has been developed by European cardiovascular surgeons. This system gives the risk of mortality during or 30 days after the operation, based on the values of some parameters measured before the operation. The model used by EuroSCORE has been developed by statistical data gathered from large number of operations performed in Europe.
Even though due to the surgical techniques that have been developed recently and the risk of mortality has been reduced in a large extent, predicting that risk as accurately as possible is still primary concern for the patients and their relatives in cardiovascular operations. The risk of operation also essentially tells the surgeon how a patient with similar comorbidity would be expected to fare based on a standard care. The risk of patient is also important for the health insurance companies, both public or private. In the context of this project, a model that can be used for mortality is developed.
In this research project, a database system for storing data about cardiovas-cular operations performed in Turkish hospitals, a web application for gathering data, and a machine learning system on this database to learn a risk model, similar to EuroSCORE, are developed. This thesis proposes a risk estimation system for predicting the risk of mortality in patients undergoing cardiovascular operations by maximizing the Area under the Receiver Operating Characteristic (ROC) Curve (AUC).
When the genetic characteristics and life styles of Turkish patients are taken iii
iv
into consideration, it is highly probable that the mortality risks of Turkish pa-tients may be different than European papa-tients. This thesis also intends to inves-tigate this issue.
Keywords: Machine learning, ROC, AUC, risk estimation, cardiovascular opera-tion, data mining.
¨
OZET
KALP VE DAMAR CERRAH˙IS˙INDE ¨
OL ¨
UM R˙ISK˙I
TAHM˙IN˙I
Ay¸sen Tunca
Bilgisayar M¨uhendisli˘gi, Y¨uksek Lisans Tez Y¨oneticisi: Prof. Dr. Halil Altay G¨uvenir
Eyl¨ul, 2008
Kalp damar cerrahisi kapsamında yapılan ameliyatlarda ¨ol¨um riskinin belir-lenip hasta ve hasta yakınlarına ameliyat ¨oncesinden bildirilmesi b¨uy¨uk ¨onem arz etmektedir. Bu ama¸cla Avrupalı ara¸stırmacılar tarafından EuroSCORE (The European System for Cardiac Operative Risk Evaluation) adında bir sistem geli¸stirilmi¸stir. Bu sistem ameliyat ¨oncesi ¨ol¸c¨ulen bazı parametreleri kullanarak ameliyat sırasında veya ameliyattan sonraki ilk 30 g¨un i¸cerisinde hastanın ¨ol¨um (mortality) riskini vermektedir. Bu model Avrupa’da yapılan ¸cok sayıdaki ameliy-atta kaydedilen bilgilerin istatistiksel olarak de˘gerlendirilmesiyle olu¸sturulmu¸stur.
G¨un¨um¨uzde cerrahi tekniklerinde geli¸smeler ve ameliyatlardaki ¨ol¨um risk-lerinde d¨u¸s¨u¸s g¨or¨ulmesine ra˘gmen, hasta ve hasta yakınları i¸cin ¨ol¨um riskinin bilinmesi hala daha b¨uy¨uk ¨onem ta¸sımaktadır. Ayrıca, hastanın ¨ol¨um riskinin bilinmesi devlet ve ¨ozel sa˘glık sigorta ¸sirketleri i¸cin gerekmektedir.
Bu ara¸stırmada T¨urkiye’deki hastanelerde yapılan kalp-damar ameliyat-larında ¨ol¸c¨ulen parametrelerin kaydedilebilece˘gi bir veri tabanı ve bu kayıtlar ¨
uzerinde makine ¨o˘grenmesi ¸calı¸smaları ile EuroSCORE’a benzer bir risk belirleme modelinin ¨o˘grenilece˘gi bir sistem geli¸stirilmi¸stir. Bu ara¸stırmada, ¨ozniteliklerin ROC alanı risk hesaplanmasında ¨ozniteliklerin a˘gırlı˘gı olarak kullanılmaktadır. Bu ¸sekilde, t¨um ROC alanını maksimum hale getirerek daha iyi bir ¨oznitelik tabanlı makine ¨o˘grenmesi ve risk tahmin modeli geli¸stirilmi¸stir.
Hastaların genetik ¨ozellikleri ve ya¸sam tarzları g¨oz ¨on¨une alındı˘gında, T¨urk hastaların kalp-damar ameliyatlarındaki ¨ol¨um risklerinin Avrupalı hastalardan farklı olması kuvvetle muhtemeldir. Bu ¸calı¸smada, bu farklılık ara¸stırılmı¸stır.
Anahtar s¨ozc¨ukler : Makine ¨o˘grenmesi, ROC, ROC alanı, ameliyat risk fakt¨orleri, v
vi
Acknowledgement
I would like to express my gratitude to all those who gave me the possibility to make this thesis real. This space for thankfulness can never be sufficient for a few special people. First of all, I am deeply indebted to my magnificent supervisor Prof. Dr. Halil Altay G¨uvenir whose inexhaustibly support with indefatigable energy, incredible guidance, unbelievable patience, precious help, stimulating suggestions, and a great deal of encouragement helped me in all the time of research for and writing of this thesis. It was a great pleasure of me to have a chance of being acquainted with him and to have a chance of being assistant of him.
The incredible people, Serkan and C¸ a˘gın, in Department of Medicine at Ankara University supported me in my research project. Especially, I am obliged to Assoc. Prof. Dr. R¨u¸chan Akar for his profound help in completing this thesis. All those who knew him will admire him for his work.
I would like to give my special thanks to Assist. Prof. Dr. C¸ i˘gdem G¨und¨uz for showing keen interest to the subject matter and accepting to read and review this thesis.
I would like to thank my bosom friends for filling my life with their eternal joy and love. Above all, I am obliged to my parents. I owe everything to a woman in my life who love me with unrequitable, my mother G¨ulfer Tunca and to a man of whom I trust blindfolded and I imitate, my father Alpay Tunca.
viii
Contents
1 Introduction 1 1.1 Motivation . . . 6 1.2 Overview . . . 7 2 Background 9 2.1 Literature Summary . . . 9 2.2 Cardiac Surgery . . . 112.3 Receiver operating characteristic . . . 12
2.3.1 Classifier Performance . . . 12
2.3.2 ROC space . . . 14
2.3.3 Curves in ROC space . . . 15
2.3.4 Area under a ROC curve (AUC) . . . 16
2.3.5 AUC versus Accuracy . . . 17
3 EuroSCORE 18 3.1 European System for Cardiac Operation Risk Evaluation . . . 18
CONTENTS x
3.2 Validation of EuroSCORE on Turkish dataset . . . 21
3.2.1 Demographic results . . . 21
3.2.2 Discrimination and calibration . . . 23
4 TurkoSCORE 25 4.1 Aim and Scope . . . 25
4.2 Project setup . . . 26
4.3 Data collection . . . 27
4.4 Data . . . 29
4.4.1 Patient- related factors . . . 29
4.4.2 Cardiac related factors . . . 29
4.4.3 Operational related factors . . . 30
4.5 Algorithm . . . 30
4.5.1 Introduction . . . 30
4.5.2 Training . . . 35
4.5.3 Complexity of the REMARC Algorithm . . . 37
4.5.4 Risk Estimation . . . 37
5 Experiments and Results 38 5.1 Experiment 1 . . . 38
5.2 Experiment 2 . . . 40
CONTENTS xi
5.2.2 Experiment 2b . . . 41
5.3 Experiment 3 . . . 42
6 Conclusion and Future Work 44
A TurkoSCORE project 55
A.1 TurkoSCORE Study Group . . . 55
A.2 TurkoSCORE web application . . . 56
B TurkoSCORE parameters 57
C EuroSCORE 106
D Experiments 108
E Rules Learned 111
E.1 Euroscore Risk factors . . . 111
E.2 Turkoscore Risk factors . . . 113
List of Figures
2.1 Confusion matrix . . . 13
2.2 The ROC space and plots of four classifier example . . . 14
2.3 Efficient method for generating ROC points . . . 15
2.4 Area under two ROC curves . . . 16
3.1 Receiver operating characteristic (ROC) curves for Additive and Logistic EuroSCORE . . . 24
4.1 Learning a model and estimating risk by REMARC . . . 31
4.2 ROC Curve for a Feature with 2 categorical values . . . 34
4.3 Comparing ROC of features f1, f2 and f3 . . . 35
4.4 Risk Estimation by Maximizing Area under ROC curve (RE-MARC) Algorithm . . . 36
5.1 Receiver operating characteristic (ROC) curves of REMARC Algo-rithm, Additive and Logistic EuroSCORE with EuroSCORE risk factors . . . 39
LIST OF FIGURES xiii
5.2 Receiver operating characteristic (ROC) curve of REMARC
algo-rithm with TurkoSCORE risk factors . . . 41
A.1 A view from web site . . . 56
B.1 Identity parameters . . . 57
B.2 Hospital stay up parameters . . . 59
B.3 Complete clinical history parameters recalled and recounted by a patient . . . 60
B.4 Physical examination parameters . . . 66
B.5 Angiography and echography parameters . . . 69
B.6 Preoperative medication parameters . . . 73
B.7 Laboratory analysis parameters . . . 77
B.8 Operation related parameters . . . 79
B.9 Coronary artery bypass surgery parameters . . . 82
B.10 Valve surgery parameters . . . 88
B.11 Thoracic aorta surgery parameters . . . 91
B.12 Surgery crew parameters . . . 92
B.13 Perfusion parameters . . . 93
B.14 Postoperative and intensive care unit parameters . . . 97
B.15 Complication parameters . . . 98
B.16 Medication parameters while discharging from hospital . . . 100
LIST OF FIGURES xiv
B.18 Mortality parameters . . . 104
C.1 Description of EuroSCORE Risk Factors . . . 106
C.2 TurkoSCORE approximations . . . 107
C.3 AUCs of EuroSCORE Risk Factors . . . 107
List of Tables
3.1 EuroSCORE risk factors, their additive weights and beta coefficients 20
3.2 Prevalence of risk factors in TurkoSCORE and EuroSCORE pop-ulations . . . 22
3.3 Predicted and observed mortality by EuroSCORE risk level for whole cohort . . . 23
4.1 Cardiovascular parameters . . . 28
5.1 REMARC AUC values for 10-fold cross-validation . . . 42
5.2 AUC results of REMARC algorithm in different feature AUC thresholds . . . 43
Chapter 1
Introduction
In every aspect of human being life, we live in an expanding universe of data in which there is too much data and too little information. The quantity of data in the Internet and the world roughly doubles every year, and as a somewhat surprising consequence, the amount of information decreases rapidly. Not only the availability of data that is vital but also the ability to interpret this data is the main focus by computer scientists today. The development of new techniques to find precious knowledge under a huge amount of data is one of the main challenges for computer scientists.
The unbridled growth of data will inevitably lead to a situation in which it is increasingly difficult to access the desired information; it will always be like looking for a needle in a haystack, only the amount of hay will be growing all the time.
The ability to learn is inherent in living things; even relatively simple organ-isms like plants have this capacity. Plants learn to maximize the amount of light they receive by turning their leaves towards the sun; this is an elementary form of adaptation to the environment. This capacity to learn seems to be an essential characteristic of life itself. Machine learning led a hidden life in universities and research centers.
CHAPTER 1. INTRODUCTION 2
Some tasks are extremely hard to solve with computers, and can be relatively easily solved by experienced people, for example to recognize a friend. On the other hand, some tasks are like a piece of cake for computers to accomplish in a short amount of time than for humans, for example some complex mathematical problems. Experts seem to be able to learn how to deal with complexities from experience. Attention turned to the construction of learning algorithms [3, 5, 60].
An intelligent expert system can be constructed by putting all the rules that were used by the expert to the system. Collecting the information to put in an expert system involved a painstaking and expensive process of interviewing relevant experts. Machine learning algorithms could generate the rules automat-ically. Instead of interviewing experts it appeared that we might be able to build systems that could learn from experience.
Michalski et al. have defined learning as “A computer program is said to learn from experience E with respect to some class of tasks T and performance measure P, if its performance at tasks in T, as measured by P, improves with experience E”. Witten and Frank defined learning as “things learn when they change their behavior in a way that makes them perform better in the future” [60].
Application of machine learning method to large databases is called data mining. It is well known, in mining, enormous quantities of debris have to be removed before diamonds or gold can be found. In finance, banks analyze their past data to build models to use in credit applications, fraud detection, and stock marketing. In manufacturing, the learning models are used for optimization, control, and troubleshooting. In medicine, learning models are used for medical diagnosis. Machine learning is not just a database problem; it is also a part of artificial intelligence. To be intelligent, a system that is in a changing environment should have the ability to learn [3, 5, 10].
Machine Learning is programming the computers to optimize a performance criterion using example data or past experience. We have a model defined up to some parameters, and learning is the execution of a computer program to optimize the parameters of the model using the training data or past experience. The model may be predictive to make predictions in the future, or descriptive to
CHAPTER 1. INTRODUCTION 3
gain knowledge from data, or both.
Machine learning is the study of computer algorithms that improve auto-matically from experience. Machine learning has wide spectrum of applications including natural language processing, pattern recognition, medical diagnosis, computer vision, bioinformatics, and robotics.
Michalski et al. organize Machine Learning approaches into a taxonomy, based on the learning strategies :
• Rote learning or learning by being programmed consists of just recording the different objects supplied by an expert.
• Learning by instruction is learning by being told some new knowledge from an external source.
• Inductive learning is accomplished by reasoning from externally supplied examples to produce more general descriptions.
• Learning by observation is learning by observing the environment and mak-ing discoveries.
In machine learning literature, the inductive learning is heavily studied. ductive learning methods extract rules and patterns out of massive data sets. In-ductive Machine Learning algorithms can be divided into a number of categories differently in literature. Generally, Machine Learning algorithms are organized into a taxonomy, based on the desired output of the algorithm:
• Supervised learning algorithms generate a function from training data to map the inputs to desired outputs.
• Unsupervised learning algorithms model a set of input data. (labeled ex-amples are not included)
• Semi-supervised learning algorithms generate a function or classifier from both labeled and unlabel data.
CHAPTER 1. INTRODUCTION 4
• Reinforcement algorithms assess the goodness of policies and learn from past good action sequences to be able to generate a policy of how to act given an observation of the world.
• Transduction algorithms are similar to supervised learning, but they do not explicitly construct a function: instead, they try to predict new out-puts based on training inout-puts, training outout-puts, and test inout-puts which are available while training.
• Learning to learn algorithms learn its own inductive bias based on previous experience.
Supervised learning is also known as classification. Training data include instances with labeled class. Supervised learning techniques learn a classification rule from training data to correctly predict the class of a new instance. In this thesis, for example, the training data are the preoperative parameters of patients underwent a cardiovascular surgery, with actual (labeled) class of each patient (Dead or Alive). The goal of the learning system is to obtain a set of rules to correctly predict the mortality risk of a new patient after cardiovascular surgery [60, 61].
Machine learning is also called concept learning. There are two types of concept learning: single concept learning and multi-concept learning. According to our study, we have both dead and alive patients after the surgery. In single concept learning, the system learns a set of rules to predict only a single concept (class)- only dead class. In multi-concept learning systems, it learns a set of rules for both of the concepts. In this thesis, multi-concept learning system is used.
A wide range of multi-concept systems have been developed to predict mu-tually disjoint classes, such as Decision Trees [70, 71], Bayesian Classifiers [15, 16, 26], Instance-based learning algorithms [4], and Nearest Neighbor [13, 15].
This thesis proposes a multi-concept learning algorithm called, Risk Estima-tion by Maximizing the Area under ROC Curve (REMARC). The previously developed related algorithms have achieved success in a wide range of real world
CHAPTER 1. INTRODUCTION 5
problem domains [31, 32, 34, 36]. They are robust algorithms to irrelevant features and missing feature values, which are problems for other inductive and supervised learning models such as decision trees, and nearest neighbor algorithms.
This thesis proposes a risk estimation technique by maximizing the area under the Receiver Operating Characteristic (ROC) Curve of the algorithm. The Risk Estimation by Maximizing the Area under ROC curve (REMARC) algorithm is non-incremental risk learning algorithm that learns the risk of a test instance from preclassified instances in training set. Risk estimation of the test instance is done by risk estimation scheme where feature-value rules distribute their risk among classes.
Hang and Ling gave formal definitions of discriminancy and consistency in comparing evaluation measures for learning algorithms. The Accuracy and Area under the ROC Curve (AUC) are the two measures that are compared in their studies. They establish precise and objective criteria for comparing these two measures in general and show, both empirically and formally, that AUC is better measure than accuracy [49, 50].
The predictive ability (performance) of REMARC algorithm is measured by its area under the ROC curve (AUC). The heuristic in REMARC algorithm comes by the light and objective of maximizing the overall area under the ROC curve of the algorithm. That is to say, the aim is to maximize the performance of the algorithm. For this respect, if we measure and compare the performance of algorithms in terms of their Area under the receiver operating characteristic curve (AUC), the discriminative ability (weight) of each feature can be used as a weight in addition to rule’s predicted risks. The feature’s AUC over the testing instances is used to strengthen the feature’s risk to overall risk of that test instance. High quality features, that have more discriminative ability, would have more effect on the overall predicted risk of a test instance to maximize the overall performance of the algorithm.
Since the multi-concept learning systems have a wide range of application areas in real-world problems, the system proposed in this thesis will evaluate a real patient data set in our project-TurkoSCORE.
CHAPTER 1. INTRODUCTION 6
1.1
Motivation
The first question that occurs in cardiac surgery patient’s mind is “Am I going to die?”. Sometimes giving realistic mortality risk is more trustworthy answer from patient’s point of view than explaining the complications of the surgery. It is very important to inform the patient and his/her relatives about the risk of mortality before a cardiovascular surgery. Also, the risk of patient essentially tells the surgeon how a patient with a similar comorbidity would be expected to fare based on a national standard care.
It would be misleading to make a decision about the quality of care of hospi-tals and success of surgeries by looking only at crude mortality. In fact, the high risk patients underwent a surgery over medical treatment have higher percentage mortality. Nowadays, the mortality information is no longer sufficient for assess-ing the quality of care of hospitals or surgeries. It would also be fallacious to call an operation as success, if morbidity and poor long-term occurred after the surgery [59, 76, 77].
There are many reasons for predicting the risk of mortality in groups of cardiac patients. These range from helping determine the indication of surgery and proper informed consent to allowing quality monitoring of surgeons and institutions. The predictions have obvious applications in patient’s counseling and medical decision-making for individual risk assessment. The predictions are also valuable for assessing if a surgical care is in keeping with an accepted norm. Operative mortality is a good measure of quality of a cardiac surgical care, as long as patient risk factors are taken into consideration. Therefore, a lot of machine learning models have been proposed all over the world to predict the mortality risks for patients undergoing cardiovascular surgery [47, 48, 62, 67, 69, 73, 75, 82, 83].
At Cardiovascular Surgery departments in Turkey, EuroSCORE method cal-culates the predicted mortality for patients [62]. In EuroSCORE, nearly 20 thou-sand consecutive patients from 128 hospitals in eight European countries were studied. Validation of EuroSCORE model in other countries have been analyzed. When the outcomes of these surgical operations were analyzed epidemiologically,
CHAPTER 1. INTRODUCTION 7
crucial differences across the nations were observed [86]. Some studies were done to assess the performance of EuroSCORE model in some other countries out of Europe. As a result of these analysis, the EuroSCORE model of risk prediction was not validated in the present population of cardiac surgical patients in some populations. The claim of this thesis is, since the characteristic and life styles of Turkish people taken into consideration, EuroSCORE may not be validated in our population. Also, since the EuroSCORE system learns a model using a data set occurred before the year 2000, afterwards, considerable improvements achieved in surgical techniques and applied medical treatment protocols. So, a scoring system special to Turkish population is essential in Turkey.
This thesis proposed a machine learning algorithm, called Risk Estimation by Maximizing the Area under the ROC Curve (REMARC), to construct a risk estimation system for the prediction of early mortality in patients undergoing cardiovascular surgeries on the basis of objective risk factors by using national TurkoSCORE data set.
1.2
Overview
Chapter 1 provided a broad introduction to the area of machine learning and gave a brief information about the proposed thesis. Motivation section was written for warming up to the subject.
Chapter 2 describes the background information. The main aim of this chapter is to give literature summary of the learning algorithm and some definitions about the proposed thesis.
Chapter 3 presents the most broadly used scoring system in Europe, called EuroSCORE. This chapter gives detailed information about this scoring system, which will be compared in terms of performance with REMARC algorithm.
Chapter 4 presents an extensive explanation of the TurkoSCORE project and the proposed algorithm.
CHAPTER 1. INTRODUCTION 8
Chapter 5 will demonstrate the experiments of the proposed algorithm eval-uated and the results of its application to the dataset of the project.
Chapter 6 will conclude the thesis by indicating the contributions of the thesis, outcome of the experiments, and outlines the future work on this subject.
Chapter 2
Background
This chapter provides general literature summary and some definitions needed to understand the concepts in rest of the following chapters. Literature sum-mary section explains early stages in study of risk estimation and classifying. The other section presents general information about cardiovascular surgeries. Receiver Operating Characteristic (ROC) section explicates how area under the curve calculation performed and how ROC curves are drawn, and why the Area Under ROC Curve (AUC) is chosen as a performance measure.
2.1
Literature Summary
The study of risk classifying in patients undergoing a medical treatment began at the beginning of 19th century. It is first attributed to Briton Florance Nightin-gale, who made major contributions to the statistical analysis of postoperative complications, morbidity, and mortality. It is hardly surprising that, the percent-age of mortality in patients treated in hospitals was towering than the patients treated outside of hospitals. Her studies showed that the outcomes of surgeries could be changed from one hospital to another. She concluded her analysis by the percentage of mortality could also vary through patients having different stage of
CHAPTER 2. BACKGROUND 10
the same illness. This analysis was known as the first example of risk degree anal-ysis. Nightingale made unforgettable efforts to improve the hospital care service in London [56, 63, 80].
At the beginning of 1900s, increasing quality in medicine began with the challenges in the quality of medical education. Major changes made in medical education after an extensive on-site analysis of medical school in the USA and Canada. As a consequence of these analyses, a drastic decrease in the number of medical schools occurred. Also, the remaining medical schools were affiliated with the universities and became an academic educational enterprise, a situation that remains to this day [9, 24, 25, 54, 78].
Ernest Avery Codman created a form of anesthesia chart which is used even today. He undertook the idea of systematic follow-up of surgical patients. He created his own “End Result Hospital” in Boston, Massachusetts. In this hospital, every patient’s end results, diagnosis errors, and treatments were followed even years after and reported annually [11].
There are many reasons for predicting the risk of mortality in groups of car-diac patients. These range from helping determine the indication for surgery and proper informed consent to allowing quality monitoring for surgeons and insti-tutions. It is very significant to inform the patients undergoing cardiovascular surgery and their relatives about the risk of mortality before the operation. For this respect, in the USA and Europe, a lot of data mining systems for determin-ing the risk factors in patients undergodetermin-ing cardiovascular operations have been developed and applied in some clinics. APACHE III [55], Pennsylvania [81], New York’s Cardiac Surgery Reporting System [38, 39, 40, 41, 42, 43, 44, 45, 46], So-ciety of Thoracic Surgeons National Database [18, 47], Veterans Affairs [37], Par-sonnet [67], Provincial Adult Cardiac Care Network of Ontario, Canada [83, 84], Northern New England Cardiovascular Disease Study Group [14, 64, 65, 66], Cleveland clinical severity score [20, 48], and EuroSCORE [62] are some exam-ples of risk classification studies.
Much disparity subjected between the clinical parameters that increase the national source utilization and the parameters that affect mortality. In previous
CHAPTER 2. BACKGROUND 11
studies, it is shown that the variables special to the cardiac disease (recent my-ocardial infarct, left ventricular dysfunction, hemodynamic instability) are the factors affecting the hospital mortality. On the other hand, it is observed that the external factors other than the cardiac disease (extracardiac arteriopathy, chronic pulmonary disease) affect the national source utilization such as the hos-pital staying duration, and hoshos-pital expenses [22, 23, 72].
There are many machine learning techniques used to predict the risk factors in cardiovascular surgery [1, 6, 8, 12, 17, 27, 28, 29, 48, 51, 53, 52, 57, 58, 62, 67, 68, 69, 73, 74, 82, 83, 85]. These studies were about predicting the risk of disease without concerning the operational risks. Magovern and his colleagues proposed univariate logistic regression analysis model that predicts the mortality and morbidity only after the coronary artery bypass graft surgery [58]. Also, Biagioli and his colleagues proposed a multivariate Bayesian model for assessing morbidity after coronary artery surgery by using 88 operation risk factors [7]. Both of the models are not suitable to be examined by experts.
The previously developed related algorithms acquire knowledge by obtaining a set of rules after training process [31, 35, 36]. These algorithms learn robust model, and have achieved success in a wide range of medicine problem domains [30, 32, 33, 34].
The algorithm of this thesis, REMARC (for Risk Estimation by Maximizing the Area under the ROC Curve) algorithm, is a risk estimation algorithm by maximizing the area under the receiver operating characteristic (ROC) curve.
2.2
Cardiac Surgery
Cardiac surgery is surgery on the heart and/or great vessels performed by a cardiac surgeon. Frequently, it is done to treat complications of ischemic heart disease (for example, coronary artery bypass grafting), correct congenital heart disease, or treat valvular heart disease created by various causes including endo-carditis. It also includes heart transplantation.
CHAPTER 2. BACKGROUND 12
When a patient applies or is directed by cardiologist to a cardiovascular surgery department, the primary procedure is to collect the preoperative data about patient’s clinical symptoms. Preoperative data include identity, complete history recalled and recounted by a patient, physical examination, angiography and echography, the preoperative medication, laboratory analysis, and some gen-eral operational.
After the surgery has been carried out, the surgeon takes operative records down including operational procedures done during surgery, surgery crew list, and perfusion data. All data including intensive care unit, complication, laboratory test, medication while discharging from the hospital, and follow-up are some of the postoperative data recorded procedurally for each cardiac patient.
Mortality is the condition of being mortal, or susceptible to death. Mortality data are initially noted immediately after the performed surgery and continuously followed up in specific intervals.
2.3
Receiver operating characteristic
A ROC graph is a technique for visualizing, organizing, and selecting classifiers based on their performance. In signal detection theory, ROC has been used as a graphical plot of sensitivity versus (1 - specificity) since 1975 [19]. Spackman was the earliest scientist who demonstrated the value of ROC curves in evaluating and comparing algorithms in machine learning field [79].
2.3.1
Classifier Performance
We begin by considering a two-class prediction problem, in which the outcomes are labeled either as positive (p) or negative (n). A classification model is mapping from instances to predicted classes (p,n). The classifier result can be a continuous value (probability, score) to which different thresholds may be applied to predict class membership. Other classifiers can predict discrete class label indicating one
CHAPTER 2. BACKGROUND 13
of the classes.
Given a classifier and an instance, there are four possible outcomes. If the instance is positive and the outcome of the classifier is positive, it is classified as true positive (TP); if it is classified as negative, it is counted as false negative (FN). If the instance is negative and it is classified as negative, it is counted as true negative (TN); if it is classified as positive, it is counted as false positive (FP).
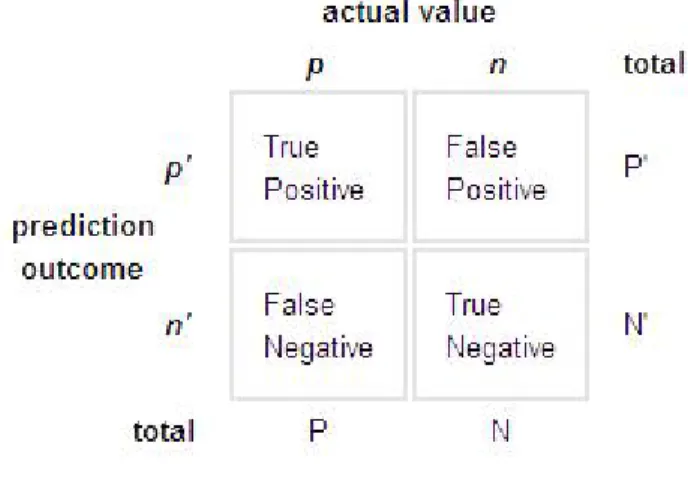
Given a classifier and a set of test set with P positive and N negative in-stances, a two-by-two confusion matrix or contingency matrix can be constructed representing the disposition of the set of instances, as follows :
Figure 2.1: Confusion matrix
In Figure 2.1 [2], the numbers in diagonal represent the correct predictions, and the numbers off the diagonal represent the errors. The true positive rate (also called TPR, recall, hit rate, sensitivity) of a classifier is estimated as :
true positive rate = T P P
The false positive rate (also called FPR, false alarm rate, (1 - specificity)) of the classifier is estimated as :
f alse positive rate = F P N
CHAPTER 2. BACKGROUND 14
2.3.2
ROC space
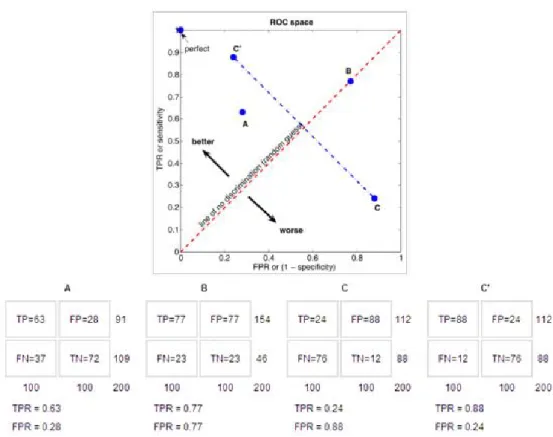
Figure 2.2: The ROC space and plots of four classifier example
ROC graphs are two-dimensional graphs in which TP rate (sensitivity) is plot-ted on the Y axis and FP rate (1- specificity) is plotplot-ted on the X axis, which de-picts relative trade-offs between true positive (benefits) and false positive (costs). Each prediction result or one instance of a confusion matrix corresponds to a single point in ROC space.
In Figure 2.2 [2], all classifiers are discrete classifiers. The point (0, 1) rep-resents a perfect classification. It reprep-resents a classifier that found all true posi-tives and no false posiposi-tives. A random guess classifier would give a point along a diagonal line, no-discrimination line. Points above the diagonal indicate good classifiers, while points below the line indicate bad classifiers. Informally, one point in ROC space is better than another if it is to the northwest of the first [21].
CHAPTER 2. BACKGROUND 15
In Figure 2.2, Classifier B predicts random guess, actually it has no informa-tion. Classifier A is a good classifier, while classifier C is a bad classifier. Any classifier that produces a point below the diagonal line can be negated to produce a point above the diagonal line. Negating a classifier simply means reversing its classification decisions on every instance, as shown in Classier C’.
Figure 2.3: Efficient method for generating ROC points
2.3.3
Curves in ROC space
The outcome of discrete classifiers are only the class labels, positive or negative. When a set is given to such classifiers, the result will be a single confusion matrix, which corresponds to a single point in ROC space. The other classifiers produce rank or score as outcome. For these classifiers, a predefined threshold can be used to produce a discrete classifier. For instance, if the score or probability is above or equal to the threshold, it can be classified as positive instance, otherwise classified as negative instance. Then, confusion matrix can be obtained corresponding a single point in ROC space. Different threshold values correspond to a different point in ROC space. A ROC curve can be imaginally drawn by varying a threshold
CHAPTER 2. BACKGROUND 16
from −∞ to +∞. The algorithm to generate an efficient ROC curve is detailed in Figure 2.3 [2, 21].
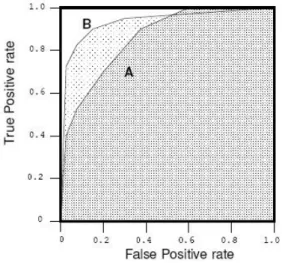
ROC curve compares the classifiers’ performance across the entire range of class distributions and error costs. In Figure 2.4, B seems to dominate the A. But it can be observed that B is not dominating A in the whole range. In those situation, the area under the ROC curve is a good summary for comparing the two ROC curves.
2.3.4
Area under a ROC curve (AUC)
A ROC curve is two-dimensional depiction of classifier performance. ROC per-formance can be represented by a single point to compare the perper-formance of different classifiers. The area under the ROC curve (AUC) has been used in medical diagnosis since the 1970s. It has been proposed as an alternative single-number measure for evaluating the predictive ability of learning algorithms. AUC is equal to the probability that a classifier will rank a randomly chosen positive instance higher than a randomly chosen negative instance [49, 50, 21].
Figure 2.4: Area under two ROC curves
Figure 2.4 shows the area under two ROC curves, A and B. Classifier B has a greater area and therefore a better average performance.
CHAPTER 2. BACKGROUND 17
2.3.5
AUC versus Accuracy
The predictive ability of a classification algorithm is measured by its predictive accuracy on the testing examples. However, the outcome of most classifiers can be probability or score of the class prediction. This information is completely ignored in accuracy.
In many data mining applications, accuracy is not enough; for instance, when ranking information of a test instance is needed instead of a mere class label. A perfect ranking result would be possible if there is a true ranking of the training set. This can be achieved by a ROC curve. The AUC provides a good measure for the performance of ROC curves.
The studies based on comparing two measures, AUC and accuracy, in general have been done. Hang and Ling [49, 50] gave formal definitions of discriminancy and consistency in comparing evaluation measures for learning algorithm. They establish precise and objective criteria for comparing two measures in general and show, both empirically and formally, that AUC is a better measure than accuracy. Thus, in this thesis, for evaluating the learning algorithm AUC has been used.
Chapter 3
EuroSCORE
This chapter presents the commonly used scoring system in Europe and Turkey, which is called EuroSCORE. Firstly, general information about the system will be given, the information about how the analysis have been done for determining risk factors and how the overall risk is calculated. In following sections, an analysis of EuroSCORE system has been performed on TurkoSCORE dataset to observe the validation of EuroSCORE on Turkish population. Demographic, calibration and discrimination results are all provided.
3.1
European System for Cardiac Operation
Risk Evaluation
It would be misleading to make a decision about the quality of care of hospitals and success of surgeries by looking only at crude mortality. In fact, the high risk patients underwent a surgery over medical treatment have higher percentage mortality [59]. Nowadays, the mortality information is no longer sufficient for assessing the quality of care of hospitals or surgeries. It would also be fallacious to call an operation as success, if morbidity and poor long-term occurred after the surgery [76, 77].
CHAPTER 3. EUROSCORE 19
Many of the cardiac risk factors studies have derived in North American pa-tient population. In Europe, a model called EuroSCORE (The European System for Cardiac Operative Risk Evaluation) has been developed and commonly used by European cardiovascular surgeons. This system calculates the predicted op-erative risk of patients undergoing cardiac surgery during or 30-days after the surgery, based on the values of some parameters measured before the operation. The risk factors obtained in this study includes 68 preoperative and 29 opera-tive parameters by the light and analysis of previous risk factors used in North American and European risk model studies. Most likely risk factors to be useful were identified by consultant cardiac surgeons. Although the risk factors selected for evaluation were largely similar to those in other American studies, when-ever possible the definitions are simplified in EuroSCORE. The model used by EuroSCORE developed by data gathered from nearly 20 thousand consecutive patients from 128 hospitals in eight European countries (Germany, France, UK, Italy, Spain, Finland, Sweden, Switzerland) [62].
After some analysis and assessment of the performance of the effects of these potential preoperative and operative risk factors on EuroSCORE project data set, improvement of the performance of the model is obtained by the elimination of factors one at a time. Overall seventeen risk factors were found to be useful for calculating the predicted operative risk of patient underwent cardiac surgery. Definitions of each factor are detailed in Figure C.1, Appendix C. For the scor-ing system, these risk factors were weighted. The score of the system can be calculated in two different ways. First score is Additive (Standard) EuroSCORE and the other one is Logistic EuroSCORE. Additive EuroSCORE was designed to be a user-friendly scoring system, originally derived from a logistic regression methodology. Initially, Additive EuroSCORE was used. But after some studies on the validation of EuroSCORE system on other cardiac data sets in other Eu-ropean countries, the deficiency of Additive EuroSCORE was noted. Although calculation is simple, Additive EuroSCORE can sometimes underestimate in very high risk patients. Consequently, the Logistic regression version of the system was published [74].
CHAPTER 3. EUROSCORE 20
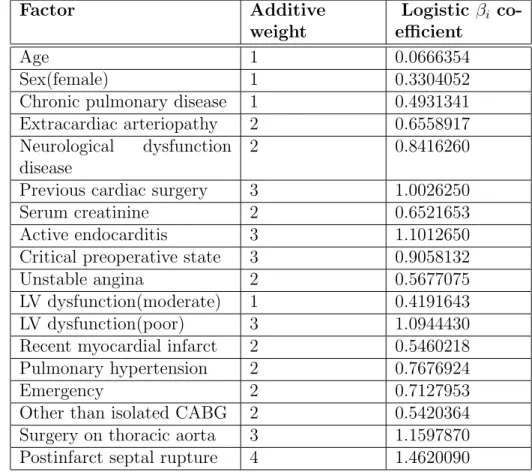
Table 3.1: EuroSCORE risk factors, their additive weights and beta coefficients
Factor Additive weight Logistic βi co-efficient Age 1 0.0666354 Sex(female) 1 0.3304052
Chronic pulmonary disease 1 0.4931341 Extracardiac arteriopathy 2 0.6558917 Neurological dysfunction
disease
2 0.8416260
Previous cardiac surgery 3 1.0026250 Serum creatinine 2 0.6521653 Active endocarditis 3 1.1012650 Critical preoperative state 3 0.9058132 Unstable angina 2 0.5677075 LV dysfunction(moderate) 1 0.4191643 LV dysfunction(poor) 3 1.0944430 Recent myocardial infarct 2 0.5460218 Pulmonary hypertension 2 0.7676924
Emergency 2 0.7127953
Other than isolated CABG 2 0.5420364 Surgery on thoracic aorta 3 1.1597870 Postinfarct septal rupture 4 1.4620090
EuroSCORE of each risk factor. Definition of risk factors can be scaned in Ap-pendix C, Figure C.1. The Additive EuroSCORE, as it can be guessed from its name, can be calculated simply as adding up the scoring of each existing risk factor of each patient. Logistic EuroSCORE can be computed with the following formula: P redicted mortality = e β0+Pβiχi 1 + eβ0+Pβiχi where, e is natural number = 2.718281828
β0 is the constant of the logistic regression equation = -4.789594.
βi is the coefficient of the variable χi in the logistic regression equation provided
in Table 3.1.
χi = 1 if a categorical risk factor is present and 0 if it is absent.
CHAPTER 3. EUROSCORE 21
for age 59 or less χi = 1, age 60 χi = 2, age 61 χi = 3, and so on.
EuroSCORE assumes that all the missing values of risk factors have been determined. Not selecting a risk factor means that the risk factor is not observed in the patient.
3.2
Validation
of
EuroSCORE
on
Turkish
dataset
The purpose of this analysis in this section is to evaluate the performance of Additive and Logistic EuroSCORE in Turkish cardiac surgery by testing it on the TurkoSCORE database.
The definitions of some of the risk variables were not identical in both Europe and Turkey, so some adjustments or approximate assumptions were made to enable complete analysis, listed in Figure C.2, Appendix C.
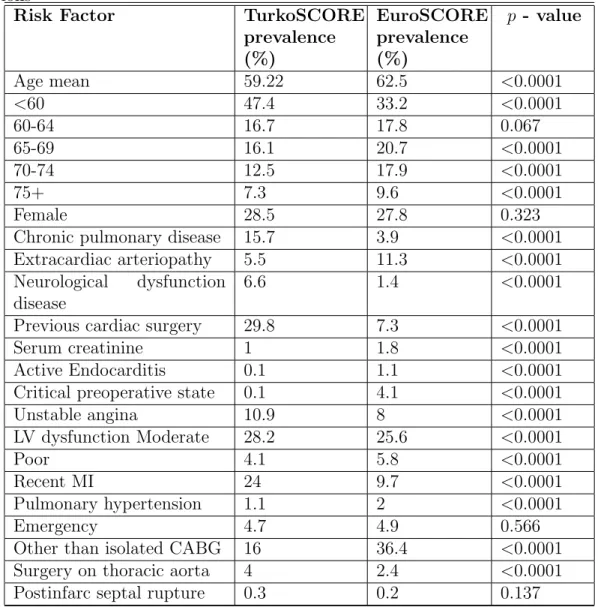
The Turkish and European patient populations were compared in demo-graphic characteristics, incidence of surgical procedures performed, and preva-lence of risk factors, detailed in Table 3.2. Statistical analysis was by t-test for continuous variables and Chi square for categorical values. P values under 0.05 were considered as significant. The simple risk factors were then tested on TurkoSCORE database. This enabled the performance analysis of both calibra-tion and discriminacalibra-tion of EuroSCORE on the TurkoSCORE database.
3.2.1
Demographic results
The prevalence of risk factors in the two populations are detailed in Table 3.2. The Turkish patients are younger in the dataset compared to the ones in EuroSCORE database. Turkish patients have higher incidence of Chronic pulmoner disease and Neurological dysfunction disease. Less patients in Turkish population have extracardiac arteriopathy disease. Turkish patients were more than fourfold as
CHAPTER 3. EUROSCORE 22
Table 3.2: Prevalence of risk factors in TurkoSCORE and EuroSCORE popula-tions
Risk Factor TurkoSCORE prevalence (%) EuroSCORE prevalence (%) p - value Age mean 59.22 62.5 <0.0001 <60 47.4 33.2 <0.0001 60-64 16.7 17.8 0.067 65-69 16.1 20.7 <0.0001 70-74 12.5 17.9 <0.0001 75+ 7.3 9.6 <0.0001 Female 28.5 27.8 0.323
Chronic pulmonary disease 15.7 3.9 <0.0001 Extracardiac arteriopathy 5.5 11.3 <0.0001 Neurological dysfunction
disease
6.6 1.4 <0.0001
Previous cardiac surgery 29.8 7.3 <0.0001 Serum creatinine 1 1.8 <0.0001 Active Endocarditis 0.1 1.1 <0.0001 Critical preoperative state 0.1 4.1 <0.0001 Unstable angina 10.9 8 <0.0001 LV dysfunction Moderate 28.2 25.6 <0.0001 Poor 4.1 5.8 <0.0001 Recent MI 24 9.7 <0.0001 Pulmonary hypertension 1.1 2 <0.0001 Emergency 4.7 4.9 0.566
Other than isolated CABG 16 36.4 <0.0001 Surgery on thoracic aorta 4 2.4 <0.0001 Postinfarc septal rupture 0.3 0.2 0.137
likely to have previous cardiac surgery. Turkish patients have lower incidence of Serum creatinine, Active endocarditis, preoperative critical state and pulmonary hypertension. Turkish patients were more likely to be labeled as having unstable angina and LV dysfunction Moderate. Poor LV dysfunction were more likely to be presented in Europeans than Turkish patients. More than twice Turkish patients over Europeans had recent myocardial infarction within 90 days before the surgery. Europeans were more likely to have surgery other than isolated CABG and less likely to have surgery on thoracic aorta. All differences were significant (p < 0.05) as depicted in Table 3.2. The similarities between two
CHAPTER 3. EUROSCORE 23
populations were seen only in the percentage of the patients age between 60-64, the percentage of female patients, Emergency state of the surgery and postinfarc septal rupture.
3.2.2
Discrimination and calibration
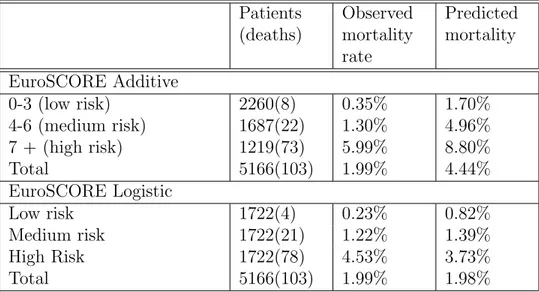
Table 3.3: Predicted and observed mortality by EuroSCORE risk level for whole cohort Patients (deaths) Observed mortality rate Predicted mortality EuroSCORE Additive 0-3 (low risk) 2260(8) 0.35% 1.70% 4-6 (medium risk) 1687(22) 1.30% 4.96% 7 + (high risk) 1219(73) 5.99% 8.80% Total 5166(103) 1.99% 4.44% EuroSCORE Logistic Low risk 1722(4) 0.23% 0.82% Medium risk 1722(21) 1.22% 1.39% High Risk 1722(78) 4.53% 3.73% Total 5166(103) 1.99% 1.98%
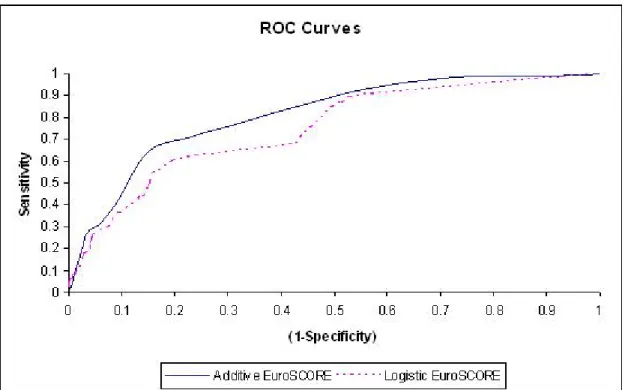
Of the 5166 patients, there were 103 deaths, giving an overall mortality rate of 1.99%. The additive EuroSCORE model predicted a mortality rate of 4.44% while the logistic EuroSCORE model predicted a mortality rate of 1.98%, as shown in Table 3.3. Thus, Additive model over estimated mortality at each risk tertile. In Figure 3.1, the discriminatory ability of the Additive (Standard) EuroSCORE model was good, with an area under the ROC curve of 81%. The discriminatory ability of Logistic EuroSCORE model was fair, with an area under the ROC curve of 74.41%. Additive model calibration was poor, the model over predicted deaths in each risk group, and the Logistic EuroSCORE underestimated mortality rate in high risk patients.
CHAPTER 3. EUROSCORE 24
Figure 3.1: Receiver operating characteristic (ROC) curves for Additive and Lo-gistic EuroSCORE
Chapter 4
TurkoSCORE
This chapter presents the deatiled information about the aim and scope of the TurkoSCORE project. TurkoSCORE system is composed of two parts; patient database and the learning system for estimating mortality risk. Database system, gathered data, and the REMARC algorithm are explained in details.
4.1
Aim and Scope
Feature projection based machine learning techniques learn a set of rules. For a query instance, the rules that match with the feature value of the query instance are selected. Each rule used in query distributes its risks to each class. The predicted class of the instance is then labeled as the highest risk class or the predicted score is the total class risk of the desired class. Various versions of this technique were studied and applied in medicine field as well. The results were successful.
The aim of the project is to estimate the mortality risk of patients undergo-ing cardiovascular surgeries. The predictive ability (performance) of REMARC algorithm is measured by the area under the ROC curve (AUC). The heuristic
CHAPTER 4. TURKOSCORE 26
in REMARC algorithm comes by the light and objective of maximizing the over-all area under the ROC curve of the algorithm. That is to say, the aim is to maximize the performance of the algorithm. For this respect, if we measure and compare the performance of algorithms in terms of their area under the receiver operating characteristic (ROC) curve (AUC), the discriminative ability (weight) of each feature can be used as a weight in addition to rule’s predicted risks. A single feature’s AUC over the training instances is used to strengthen the fea-ture’s risk to overall risk of that test instance. High quality features, that have more discriminative ability, would have more effect on the overall predicted risk of a test instance to maximize the overall performance of the algorithm.
The aim of the project at the applied field, hospital, is to construct a risk estimation system for the prediction of early mortality in patients undergoing cardiovascular surgeries in Turkey on the basis of objective risk factors.
The scope of the project is to set up a database system for storing cardio-vascular surgical patient’s data in Turkey. These data will include personal, preoperative, operative, postoperative, and mortality parameters. The aim is not only to find risk factors of the patient or to estimate mortality risks of patients, but also to obtain shared extensive national Cardiac Database of Turkish pa-tients. User friendly as well as comprehensive web application for gathering data through internet is planned to be designed. This web application will also be used by doctors to monitor, search, and print the patient health profile as far as one click away. Other purpose of TurkoSCORE project is to construct a data mining system on this database by using preoperative and postoperative parameters to develop a model to estimate the mortality risks of patients.
4.2
Project setup
The project group was set up to include a number of computer engineers from Computer Engineering Department at Bilkent University and Turkish cardiac
CHAPTER 4. TURKOSCORE 27
surgeons from Cardiovascular Surgery Department at Ankara University (Ap-pendix A). The findings and the preliminary studies by members of the group, and the features of predominantly, European risk models, their refinements and their application were considered and analyzed. Consequently, cardiovascular parameters were selected and defined on the basis of credibility, objectivity, re-liability, and prevalence. All the cardiovascular parameters and definitions are detailed in Appendix B.
4.3
Data collection
Database system on a server for storing data has been set up at Bilkent University. The aim is not only to find risk factors of the patient, but also to obtain shared extensive national Cardiac Database of Turkish patients for future researches in medicine and machine learning fields.
Database includes totally 18 tables having totally 921 fields. This data include the personal, preoperative, operative, postoperative and mortality information of each patient undergoing cardiovascular surgery.
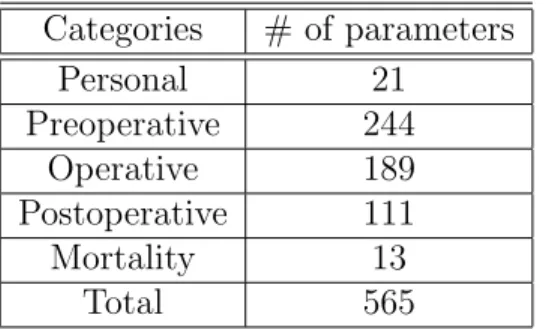
A comprehensive web application has been designed for storing, searching, viewing, printing, and analyzing the data statistically 1. A view of the web site can be seen in Appendix A.2. The total number of cardiovascular parameters (information collected by doctors) included in the system is detailed in Table 4.1. Definition of each cardiovascular parameter can be found in Appendix B.
The web site is authenticated to securely identify the users to the system. This is done to preserve the patients rights. Two levels of authorization presents; Administrator and Doctor. Different authorized users have different access rights to the system. Doctors have only the right to search, view, print, add new patient’s data, and update an existing patient’s information. Administrators have all the rights of Doctors and additionally have the right of deleting data, adding new user, adding new web application control information (e.g, adding
CHAPTER 4. TURKOSCORE 28
Table 4.1: Cardiovascular parameters Categories # of parameters Personal 21 Preoperative 244 Operative 189 Postoperative 111 Mortality 13 Total 565
new prosthesis brand), and downloading all patients data from database tables to SPSS format. Also, Doctor’s rights have been secured. One patient belongs to one surgery group. A doctor from another surgery group is not allowed to update the data of a patient underwent cardiac operation by another surgery group.
Comprehensive information on data collection requirements and definitions of variables was provided to all participating institutions and summarized on a web form.
This database has been developed extensively, so that Turkish experts can benefit from extensive data set for future research. Most of the studies need a huge data set for validation of statistics, algorithms, or any analysis. This project intends to gather all Turkish patient’s data undergoing cardiovascular surgery in all hospitals of Turkey into one shared database, TurkoSCORE Database, in course of time. The project has been announced in Turkish Cardiovascular Surgery Association as a new national Database system. Other hospitals de-siring to join TurkoSCORE Project, are all welcomed by TurkoSCORE Project Group. Already, the Cardiovascular Surgery Department of Acıbadem Hospital in Istanbul has been joined the project. Two centers, the Cardiovascular Surgery Department of Ankara University and Acıbadem Hospital, participating in the project have totally 5166 patients.
All patients who underwent cardiovascular surgery during the project period and previous periods were all included in the study. Surgeries included in the system were done between February 1999 and August 2008.
CHAPTER 4. TURKOSCORE 29
database through Internet by using a web application. In order to ensure the correctness of data entered by the surgery assistants, the data were checked by the consultant surgeon.
4.4
Data
Totally, 5166 instances present in the TurkoSCORE dataset. 4933 (95.5%) of the instances were from Acıbadem Hospital and 233 (4.5%) were from Ankara University. Overall mortality for all the cardiac procedures was 103 patients (1.99%) of whom 85 (1.64%) from Acıbadem Hospital and 18 (0.35%) from Ankara University.
4.4.1
Patient- related factors
Mean age of the patients was 59.22 with standard deviation of 12.10. Age range was 0-91 years, 1855 patients (35.9%) were aged 65 or over. 3695 of the patients (71.5%) were male and 1471 (28.5%) of the patients were female. Chronic pul-monary disease was present in 811 (15.7%) patients. Extracardiac arteriopathy and Neurological dysfunction disease presented in 284 (5.5%) and 341 (6.6%) patients, respectively. Previous cardiac surgery had been carried out in 1539 (29.8%)patients of whom 77 (1.5%) had thoracic aorta surgery, 93 (1.8%) had Valve surgery, and 1369 (26.5%) had coronary artery bypass. 52 (1%) of the patients had exceeded 2.26 of preoperative serum creatinine. 5 (0.1%) had active endocarditis. Critical preoperative status affected 5 (0.1%) patients.
4.4.2
Cardiac related factors
563 (10.9%) had unstable angina pektoris. Left ventricular function was moderate in 1457 (28.2%) with ejection fraction of 30%-50% and poor in 212 (4.1%) with ejection fraction less than 30%. In patients undergoing cardiovascular surgery,
CHAPTER 4. TURKOSCORE 30
1240 (24%) of them had myocardial infarction within 90 days. Systolic pulmonary artery pressure exceeded 60mmHg in 57 (1.1%) patients.
4.4.3
Operational related factors
The emergent operations carried out on referral before the beginning of the next working day counted in 243 (4.7%) of the patients. 827 (16%) of the operations were major cardiac procedure other than or in addition to coronary artery bypass. Surgery on thoracic aorta carried out in 207 (4%) of the operations. Postinfarc septal rupture was noted in 15 (0.3%).
4.5
Algorithm
This section provides a detailed information about the learning algorithm for estimating the scores for instances. The algorithm is called REMARC for Risk Estimation by Maximizing the Area under the ROC Curve.
4.5.1
Introduction
The previously developed related algorithms acquire knowledge by obtaining a set of rules by different approaches. These studies have achieved success in a wide range of real world problem domains. They are robust algorithms to irrelevant features and missing feature values which are problems for other inductive and supervised learning models such as decision trees and nearest neighbor algorithms [32, 34, 36].
Classification by Feature Partitioning (CFP) is an inductive, incremental and supervised learning model [36]. Feature values are partitioned into disjoint gener-alized and specigener-alized segments during training. Voting Feature Intervals (VFI) is a inductive, non-incremental, and supervised learning model. It constructs fea-ture intervals on each feafea-ture dimension from training instances [32]. The feafea-ture
CHAPTER 4. TURKOSCORE 31
intervals can represent either a range of feature values or a point for a single categorical feature value. Benefit maximizing Classifier on Feature Projection (BCFP) is also inductive, non-incremental, and supervised model which learns a set of classification rules that maximizes the benefit of classification, given a benefit matrix [34].
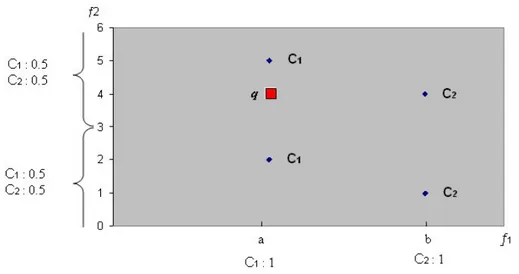
The way the Risk Estimation by Maximizing the Area under the ROC Curve (REMARC) algorithm learns a model for risk estimation is to obtain a set of rules and each rule distributes its risk among classes. It can be illustrated by an example of four training instances, two features and one query instance in Figure 4.1. One of the feature is nominal (f1) and other is linear (f2). In these
learning models, each nominal feature values partitioned into segments. Each feature-value combination constitute a rule. Each rule has an overall risk of 1 and distributes this risk among classes. The classes, in this example, are C1 and
C2. The rules learned for the features are;
if f1=a then risk[C1]=1.0, risk[C2]=0.0
if f1=b then risk[C1]=0.0, risk[C2]=1.0
if f2=-∞..3 then risk[C1]=0.5, risk[C2]=0.5
if f2=3..+∞ then risk[C1]=0.5, risk[C2]=0.5
CHAPTER 4. TURKOSCORE 32
In order to compute the risk for a query instance, the risk computed for all features are averaged. For the query instance q, the total risk of class C1 is 0.75
and class C2 is 0.25 (average of 1.5 and 0.5). This example shows the robustness
of REMARC algorithms in presence of irrelevant features in learned rule set. In this case, feature f2 is irrelevant feature, because it distributes its risk equally
among classes. It actually has no effect on overall risk estimation.
Although the related algorithms learn robust models, they become deficient in risk estimation conditions where ranking of instances is important. Most risk estimation models estimate the same risk value for too many instances. Same risk scores complicate the target ranking. That is the situation when the rules distribute the same probability value. So, there is an extra need in weighted features to discriminate the instances that have different comorbidity but have the same risk. For example, Additive EuroSCORE model estimates 20 distinct risk values, Logistic EuroSCORE model estimates 109 distinct risk values, and REMARC algorithm estimates 873 distinct risk values for same 5166 patients.
REMARC model does not intend to give very high risky patients 80% or 90% mortality risk and to give less risky patients 10% or 20% mortality risk. That is to say, the important thing is not the absolute value of the risk. For the evaluation of the performance (reliability) of any score estimation algorithm, the important thing is to correctly order the instances. REMARC algorithm is trained to learn the correct rules. Correct rules here mean; the rules that can correctly order the test instances in terms of their risk and labeled class.
The technique to calculate the area under the ROC curve had been defined in background chapter. To maximize the area under the ROC curve, positive instances must be ranked in very most beginning of the order. So, to maxi-mize the performance of the risk estimation algorithm, the risk of the positively (Dead) labeled instances must be greater than the risk of the negatively (Alive) labeled instances in training process. So, REMARC algorithm learns a rule set to maximize the AUC by using the posterior probabilities of each rule plus the feature’s discriminative ability. The example below illustrates the feeling of how to calculate the weight values of each feature.
CHAPTER 4. TURKOSCORE 33
Assume the categorical feature Sex. It has two different values, Female and Male. The rule learned from only posterior probabilities is;
Feature: Sex (Categorical) Count= 5043, Female, Count=1427, Rank=1
P: count=30 risk=0.021023126 N: count=1397 risk=0.97897685 Male, Count=3616, Rank=0 P: count=68 risk=0.01880531 N: count=3548 risk=0.9811947
The aim of REMARC algorithm is to correctly order the positive instances. As you can see from above example, an instance in training set with positive label can get either 0.021023126 (F) or 0.01880531 (M). These two risk values are used as a threshold to observe the discriminative ability of feature sex.
The discriminative ability (weight) of any feature is calculated as AUC value of the feature. An instance can at least have the min 0.01880531 risk value from feature sex. So, training set is traced to find the TPR and FPR values for 0.01880531 risk value. That constitutes all the training set. In general, the smallest given risk as a threshold forms the (1,1) point in ROC curve of a feature. For the other risk value, 0.021023126, the TPR and FPR values are also computed to form another point on ROC curve. So overall ROC curve for the feature Sex would be like in Figure 4.2. The area under the ROC curve for each feature is calculated and used as a weight in overall risk estimation.
To show the effect of weighted features on the order of instances, a simple example is given below. Consider a rule set learned from training instances are; if f1=a then risk[C1]=1.0, risk[C2]=0.0
if f1=b then risk[C1]=0.0, risk[C2]=1.0
if f2=m then risk[C1]=1.0, risk[C2]=0.0
if f2=n then risk[C1]=0.0, risk[C2]=1.0
if f3=x then risk[C1]=1.0, risk[C2]=0.0
if f3=y then risk[C1]=0.0, risk[C2]=1.0
CHAPTER 4. TURKOSCORE 34
Figure 4.2: ROC Curve for a Feature with 2 categorical values
risks among classes resulting in total risks of C1=1, C2=0 and C1=1, C2=0 for
q1 and q2, respectively. That risk estimation results in equal risks for different
features for different test instances. REMARC algorithm includes the discrimi-natory ability of each feature by multiplying feature-AUC of each feature’s risk estimate. Consider the receiver operating characteristic curve of each feature on training set in Figure 4.3 that details the discriminative ability of each feature on the training set. The AUC of each feature is computed and included in risk estimation scheme. Assume f1 has 0.8, f2 has 0.6 and f3 has 0.5 of AUC. Then,
the risks of q1 among classes are C1=0.65 and C2=0.0. Also, the risks of q2 among
classes become C1=0.55 and C2=0.
REMARC algorithm is introduced to overcome such ranking problems by including the decisiveness effect of each risk factor to risk estimation. The feature is more decisive if it has higher AUC than other one. The risk for query instance q1
is higher than the query instance q2according to the technique used in REMARC.
CHAPTER 4. TURKOSCORE 35
Figure 4.3: Comparing ROC of features f1, f2 and f3
4.5.2
Training
REMARC algorithm as shown in Figure 4.4 first runs the training procedure using a feature set previously analyzed and labeled as potential risk factors. Features can be categorical or numerical features. Firstly, the training part of REMARC algorithm converts numerical features to categorical (makeCategorical()). To find the categorical values of each feature, the mean value of all training instances for each class is found. Then, the means of each class for that feature are sorted in ascending order. Let mp, mnare the means of class p and n, respectively. Assume
then, mp > mn, mn, mp is the ordered list of means. The categorical values for
that feature are:
(−∞..mn), (mn..mp), (mp.. + ∞)
The number of categorical values for that feature is equal to the number of classes plus 1. Each categorical value constitutes a range of numerical values.
After the conversion of each numerical feature to a categorical feature, for each instance, the numerical value of each feature is then replaced by the new
CHAPTER 4. TURKOSCORE 36
Figure 4.4: Risk Estimation by Maximizing Area under ROC curve (REMARC) Algorithm
categorical value representing the range that covers the numerical value.
Then, for each categorical value v of each feature f , the risk is computed (computeFeatureValueRisk()). The riskf,v is defined as the posterior probability
that the instance, in the training set, with the value v for feature f is positive.
Training procedure, then, ranks the categorical values of each feature in de-creasing order of riskf. The features that are successful in correctly estimating
the risk of an instance are given more weight in the REMARC algorithm. The success of a feature is based on its ability to correctly order the instances accord-ing to their risks. In other words, a feature that assigns higher risks to positive cases (patients who died during or 30-days after the operation) is considered as successful. Since the REMARC algorithm tries to maximize the overall AUC, it uses the AUC of a single feature as its measure of success, that is its weight.
CHAPTER 4. TURKOSCORE 37
Therefore, for each feature, the area under the receiver operating characteristic curve (AUC) is computed using the training set.
After the training process is accomplished, the REMARC algorithm is ready to determine the total risk of a query instance using the set of learned rules and feauture-AUCs.
4.5.3
Complexity of the REMARC Algorithm
The cost of this training algorithm is the sum of the cost of computeFeatureVal-ueRisk(), rankCatValues(), and computeAUC(). Let n be the number of training instances, v be the number of categorical values of each feature, and f be the number of features. omputeFeatureValueRisk() estimates the probabilistic risks for each feature-value rule for each class. That’s cost O (n) + O (v) = O (n). RankCatValues() job is to reorder the categorical values in each feature in de-creasing order of posterior probabilities of positive class. This part of the al-gorithm costs O (vlogv) for sorting. Since the categorical values are in order, computeAUC() takes O (v) to compute the feature-AUC weight. Totally, O (n) + O (vlogv) + O (v) = O (n) for each feature. So, the total cost of the training process is O (fn).
4.5.4
Risk Estimation
Risk Estimation procedure is detailed in Figure 4.4 as ComputeRisk(). For a given query instance q, the risk estimation scheme collects the risks of each rule by multiplying each feature’s risk by feature-AUC. If the value of q for a feature f , that is qf, is unknown, that feature’s rule does not participate in risk estimation
process. After collecting the risks of each rule, the classifier predicts the positive class risk of q as the weighted average of the risks computed for each feature value.
Chapter 5
Experiments and Results
This chapter provides experiments accomplished and the results. TurkoSCORE dataset gathered during the project scope is used in all experiments, as described in previous chapter. The performance of REMARC algorithm which is also de-scribed in details in the previous chapter, has been compared with EuroSCORE scoring system in Experiment 1. In Experiment 2, most likely risk factors iden-tified and filtered by consultant surgeons were used and the performance of RE-MARC algorithm is investigated. In Experiment 3, the effect of using different feature AUCs as a threshold for filtering the risk factors is investigated. RE-MARC algorithm is implemented in Java language. Areas under the ROC curves and the points for ROC curves are all calculated in Java programming language as well. Chart Wizard of Excel is used for drawing ROC curves.
5.1
Experiment 1
For comparing performance of REMARC algorithm with EuroSCORE study, the 17 risk factors identified in EuroSCORE study are used. The name and definition of risk factors can be found in Figure C.1, Appendix C. The definitions of some of the risk variables were not identical in both Europe and Turkey, so some adjustments or approximate assumptions were made to enable complete analysis,
CHAPTER 5. EXPERIMENTS AND RESULTS 39
detailed in Figure C.2, Appendix C. The AUCs of EuroSCORE risk factors are listed in Figure C.2, Appendix C.
Totally, dataset includes 5166 instances with 1.99% mortality rate. All the instances are used for both training and testing. The rules learned by REMARC algorithm for EuroSCORE features can be scanned in Section Appendix E.1.
The mortality risks estimated by REMARC algorithm are computed automat-ically for each instance. Additive EuroSCORE and Logistic EuroSCORE risks for each patient are also calculated. The performance of these three models are com-pared by area under the ROC curves. The ROC curves for these three approaches are illustrated in Figure 5.1 to monitor the performance disparities. AUCs of Ad-ditive EuroSCORE, Logistic EuroSCORE, and REMARC Algorithm are 80.95%, 74.41%, 84.11%, respectively. Performance measure results reflect the robustness of the REMARC algorithm in risk estimation. The risk estimation model used in REMARC algorithm is better than both of the Additive EuroSCORE and Logistic EuroSCORE.
Figure 5.1: Receiver operating characteristic (ROC) curves of REMARC Algo-rithm, Additive and Logistic EuroSCORE with EuroSCORE risk factors