Expectations, Use and Judgmental
Adjustment of External Financial and
Economic Forecasts: An Empirical
Investigation
SINAN GÖNÜL,1
DILEK ÖNKAL2
AND PAUL GOODWIN3 1 Department of Business Administration, TOBB University of Economics and Technology, Ankara, Turkey
2 Faculty of Business Administration, Bilkent University, Ankara, Turkey
3 School of Management, University of Bath, UK
ABSTRACT
A survey of 124 users of externally produced fi nancial and economic forecasts in Turkey investigated their expectations and perceptions of forecast quality and their reasons for judgmentally adjusting forecasts. Expectations and quality perceptions mainly related to the timeliness of forecasts, the provision of a clear justifi able rationale and accuracy. Cost was less important. Forecasts were frequently adjusted when they lacked a justifi able explanation, when the user felt they could integrate their knowledge into the forecast, or where the user perceived a need to take responsibility for the forecast. Forecasts were less frequently adjusted when they came from a well-known source and were based on sound explanations and assumptions. The presence of feedback on accuracy reduced the infl uence of these factors. The seniority and experience of users had little effect on their attitudes or propensity to make adjustments. Copyright © 2008 John Wiley & Sons, Ltd.
key words Judgmental Adjustments; Forecast source; Forecast quality
INTRODUCTION
In many industries managers and agents rely heavily on forecasts which originate from sources outside their organizations to inform their decisions. Forecasts of fi nancial and economic variables like foreign exchange rates, interest rates, bond prices and stock prices, as well as macroeconomic predictions, are typically obtained in this way. These forecasts will often be purchased from the outside source and will frequently be based on the judgments of ‘experts’, rather than statistical methods. Whatever the source, the forecasts may be subject to judgmental adjustment by their users.
Published online 5 September 2008 in Wiley InterScience (www.interscience.wiley.com) DOI: 10.1002/for.1082
* Correspondence to: Paul Goodwin, School of Management, University of Bath, Claverton Down, Bath BA2 7AY, UK. E-mail: [email protected]
Forecasts in many fi elds are frequently adjusted by decision makers (Mathews, 1989, 1990; Diamantopoulos and Mathews, 1989; Sanders and Manrodt, 1994, 2003). For example, studies of company product demand forecasting have revealed that these adjustments are made even when expensive and advanced statistical software has been employed to generate the forecasts and even where there is evidence that adjustments reduce average accuracy (Lim and O’Connor, 1995). However, while the causes of this widespread tendency to adjust forecasts have been widely studied in product demand forecasting, and other areas like macroeconomic forecasting (Turner, 1990; Donihue, 1993), there has been little research into the extent to which people receiving externally produced fi nancial and economic forecasts apply judgmental adjustments to the forecasts that they acquire and, if they do, what reasons underlie the perceived need to make these adjustments.
An understanding of these reasons is likely to be useful to both the providers and the users of fi nancial and economic forecasts. For example, providers will be interested in knowing what factors are likely to confer a high degree of credibility on their forecasts and hence what characteristics are likely to ensure a long-term demand for their services. Similarly, companies that purchase forecasts will be interested in knowing why their staff make adjustments to some forecasts while leaving others unchanged. Such information may help to inform future forecast purchasing policies.
This paper reports the results of a survey of 124 fi nancial and economic forecast users based in Turkish companies, all of whom were using the forecasts in their routine conduct of business. The industries involved were basic materials (i.e., chemicals and mining), construction, electrical and electronics and other general industries, consumer goods and services, health care, telecommunica-tions technology and fi nancial services. After explaining the background to the survey, the paper gives details of the roles and levels of experience of the respondents. It then examines what expec-tations they have of externally generated fi nancial and economic forecasts and the extent to which the forecasts that they receive match these expectations. Next, the importance of reasons underlying decisions to judgmentally adjust, or not adjust, the forecasts are explored and compared with the actual frequency with which these reasons are evoked during the forecasting process. Finally, the paper examines whether the likelihood of a user adjusting a forecast, and their reasons for making (or not making) an adjustment, are associated with factors like the presence of feedback information on forecast accuracy, the user’s level of seniority within their organization, the user’s length of experience of using forecasts and whether the forecasts are inspected and checked by others following adjustment.
BACKGROUND AND HYPOTHESES
Users of fi nancial and economic forecasts will often have a choice between different providers of forecasts, so it is important to know what factors drive their expectations and perceptions of forecast quality. The bulk of the forecasting literature has focused almost entirely on accuracy as a measure of forecast quality, but users may have other expectations of their forecasts such as absence of bias, timeliness, transparent and justifi able assumptions and reasonable cost (Collopy and Armstrong, 1992; Yokum and Armstrong, 1995; Witt and Witt, 1992). Of course, the expectations that users have of their forecasts will not necessarily coincide with their perceptions of what a high-quality forecast should look like. For example, experience may have led them to expect less than ideal characteristics in the forecasts they receive. However, in the absence of any existing evidence that expectations and perceptions differ we hypothesize:
H1: The expectations of users of externally generated forecasts will not differ from their perceptions of what constitutes a high-quality forecast.
While accuracy is likely to be a major criterion in assessing forecast quality (Collopy and Armstrong, 1992; Mentzer and Cox, 1984; Mahmoud et al., 1988; Winklhofer and Diamantopoulos, 2002), the choice of a forecasting method, or source, is likely to involve the need to make trade-offs between these attributes. For example, the slightly higher accuracy of one method compared to another may not justify its higher cost. Also, there is some evidence that users may eschew forecasts that lack a transparent rationale, despite their general accuracy (Taylor and Thomas, 1982). The relatively few studies that have investigated perceptions of forecast quality have tended to focus on managers in product demand forecasting environments where the forecasts are likely to have been produced within the company. Nevertheless, on the basis of these studies, we hypothesize the following:
H2: Users of externally generated forecasts consider accuracy to be the most important criterion when assessing forecast quality.
In areas where judgmental adjustment of forecasts is common, like product demand forecasting, the initial forecast is usually derived from a statistical model. Judgmental adjustment is then applied to the initial forecast, ostensibly when information about the environment (e.g., market intelligence) leads to a discrepancy between this forecast and the user’s expectations. Adjustments may refl ect a perceived inadequacy in the initial forecast when the environment is stable or, when the environment is judged to be unstable, they may attempt to take into account anticipated special events or changed circumstances that are not included in the initial forecast. Judgmental adjustments tend to improve statistical forecasts when these events or changes will have large effects (Sanders and Ritzman, 2001) or where there are clear inadequacies in the statistical forecasts caused, for example, by deriving them from short datasets (Diamantopoulos and Mathews, 1989; Willemain, 1989). However, reductions in accuracy are likely when the adjuster falsely sees systematic patterns in the noise associated with time series observations. Researchers have uncovered other motives for the adjustment of initial forecasts in companies that also tend to lead to reduced accuracy. These include the need for the forecaster to have a sense of ownership of the forecasts (Önkal and Gönül, 2005), political pressures to change forecasts (Fildes and Hastings, 1994) and confusion between forecasts and other estimates such as targets and decisions (Goodwin, 1996).
There are a number of important differences between externally produced fi nancial and economic forecasts and internally produced product demand forecasts in companies and these differences may lead to some differences in the motivations for judgmental adjustments. In externally produced fi nancial and economic forecasting the initial forecast itself will often be a judg-mental forecast provided by a person or group who, it is thought, has expertise, relating to the variable to be predicted—though these ‘experts’ may have used quantitative analyses to inform the forecast (forecasts of future stock prices are a typical example of this). The user’s tendency to adjust forecasts will therefore be partly dependent on their assessment of their own expertise and knowledge, relative to that of the forecast provider. It seems reasonable to hypothesize that staff who are more experienced in using forecasts and/or who are more senior are more likely to have the confi dence to adjust the forecasts that they receive. Thus we hypothesize:
H3: More experienced users adjust externally provided forecasts more frequently. H4: More senior staff adjust externally provided forecasts more frequently.
Unlike the univariate statistical forecasts that are widely used in product demand forecasting, external fi nancial and economic forecasts based on expert judgment may have already incorporated the estimated effects of forthcoming special events. In product demand forecasting users are gener-ally all too aware of the inability of univariate statistical methods to forecast these effects. There is also some evidence that these users see a special event in every swing in the sales graph and they therefore apply adjustments to a very high percentage of their forecasts (Lim and O’Connor, 1995). This suggests that externally produced fi nancial and economic forecasts may be adjusted less fre-quently than those in product demand forecasting.
Another difference with a univariate statistical forecast is that an expert’s forecast may be accom-panied by an explanation of its underlying rationale. The psychological advice literature suggests that people’s willingness to accept advice is often restricted because, while they obviously have direct access to their own reasons for having particular expectations about the future, they may have less access to the rationale being used by the advisor (Yaniv, 2004a,b). This suggests that, where clear explanations accompany external fi nancial and economic forecasts, they are less likely to be adjusted. This leads to the following hypothesis:
H5: Externally provided forecasts that are accompanied by clear explanations of their rationale are adjusted less frequently.
Where fi nancial and economic forecasts are obtained from external sources the absence of clear, documented explanations is likely to reduce their credibility. Indeed there may even be suspicions that the forecasts are subject to deliberate biases. In these circumstances forecast users may resort to attributes such as how well known the expert or organization producing the forecast is before deciding whether to make an adjustment. This suggests the following hypothesis:
H6: Forecasts obtained from more well-known sources are less likely to be adjusted.
The presence of quantitative feedback on the accuracy of forecasts may lead to reduced reliance on attributes such as how well known the source is. However, feedback may be associated with an increased tendency to adjust forecasts for two reasons. First, it is possible that the users who adjust their forecasts more frequently will be more likely to employ feedback systems in order to assess the extent to which the adjustments are improving accuracy. Second, there is evidence that people regard negative information about an advisor’s performance as more diagnostic than positive infor-mation (Yaniv and Kleinberger, 2000; Harvey et al., 2000), so trust in a series of forecasts that are generally reliable may be unduly damaged by feedback reporting inevitable forecast errors. In par-ticular, a rare highly inaccurate forecast might be particularly harmful to the credibility of forecasts obtained from a particular source. This suggests the following hypothesis:
H7: When feedback is available about the accuracy of forecasts from a given source, these forecasts are more likely to be adjusted.
DETAILS OF THE RESPONDENTS AND THEIR USE OF FORECASTS
The 124 respondents were mainly managers, CEOs, members of executive boards, partners and owners of companies in Turkey. All were making regular use of externally supplied fi nancial and economic forecasts. Each respondent met with an interviewer to go though the questions so that any necessary clarifi cations could be made or concerns resolved. Then the interviewer left and the respondent completed the questionnaire in their own time. The questionnaire used in the survey is
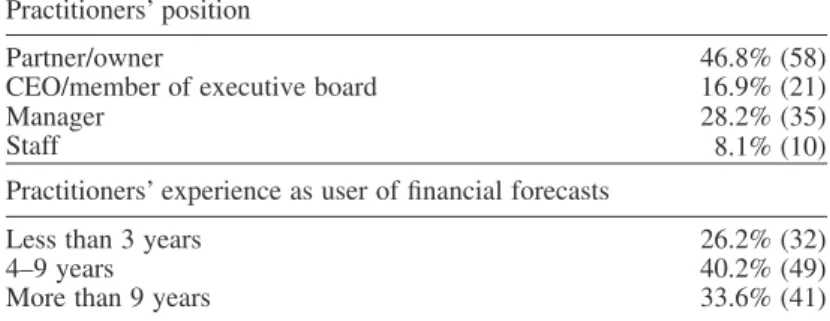
displayed in the Appendix. Table I summarizes the distribution of the participants with respect to their position in their companies and their experience of using external fi nancial and economic forecasts. It can be seen that a high percentage of the participants (73.8%), had more than 4 years’ experience of using such forecasts.
Foreign exchange rate and parity forecasts were used by the majority (68.6%) of the respondents; while 29.0% employed interest rate/bond price forecasts, 21.0% worked with forecasts on investment funds, 16.13% utilized stock price forecasts and 7.3% of the practitioners employed macroeconomic predictions. Some respondents (13.7% of the sample), indicated that they received more specialized forecasts such as predictions on sector fi nancials and forecasts relating to new economic/fi nancial instruments and investments. 39% of those questioned used more than one kind of fi nancial and economic forecast.
The number of forecast sources also varied among the respondents. 75% of them obtained their externally acquired predictions from multiple sources. They also adopted several procedures for using these forecasts. Most (68.8%) used their judgment and experience to combine the various forecasts, while 10.75% used simple statistical methods, like averages, to make the combination. At the other extreme, 12.9% selected a single forecast and disregarded the rest. The remaining respon-dents stated that the forecasts they were receiving were distinct, and thus they were not suitable for combining. There was no evidence that people receiving forecasts from multiple sources adjusted forecasts more or less frequently than those receiving them from a single source.
Regardless of the type and sources of the external forecasts, judgmentally adjustment seems to be a common practice for the forecast users. Only 23.4% of them indicated that they rarely adjusted forecasts that they received. When asked what benefi ts were gained as a result of adjustment, 41.1% of the respondents believed that it increased the accuracy of the forecasts quite regularly and 46.0% believed accuracy improvement occurred from time to time. The remaining users believed that the adjustments rarely led to accuracy improvements. However, greater accuracy was not the only benefi t that users thought could be achieved though forecast adjustment. 85% believed that they increased the persuasive power of the forecasts on an ‘occasional to frequent’ basis. There was a signifi cant positive correlation between the frequency of judgmental adjustments and the perceived frequency of accuracy improvements (r = 0.541, p = 0.002). A similar relationship was observed between the frequency of judgmental adjustments and the frequency of perceived improve-ment in the persuasiveness of predictions (r = 0.526, p = 0.002). Surprisingly, only 35.5% of respon-dents used feedback on the accuracy of the forecasts. This is worse than the fi nding by Fildes
Table I. The position and forecast using experience of the participants (numbers in parentheses indicate the actual number of responses in each category)
Practitioners’ position
Partner/owner 46.8% (58)
CEO/member of executive board 16.9% (21)
Manager 28.2% (35)
Staff 8.1% (10)
Practitioners’ experience as user of fi nancial forecasts
Less than 3 years 26.2% (32)
4–9 years 40.2% (49)
and Goodwin (2007) that 25% of (mainly supply chain) forecasters did not measure the accuracy of their forecasts at all.
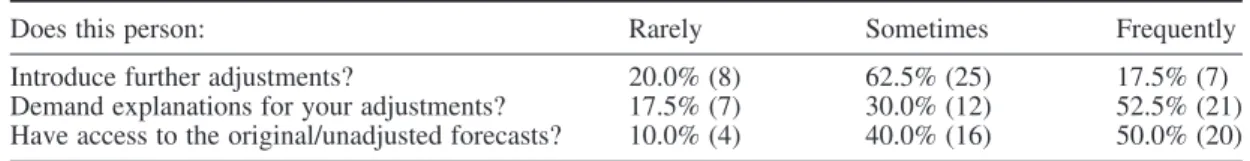
Finally, 30.7% of the respondents reported that, following any adjustments they made to the forecasts, another person routinely checked these revisions, and in 80% of these cases the colleague applied further adjustments either ‘sometimes’ or ‘frequently’. Table II provides the details and also shows that the ‘inspecting’ colleague expected explanations from the practitioners about the adjust-ments they have conducted quite often. This colleague also usually had access to the original, unadjusted forecasts. However, 95% of the respondents believed that this checking process often led to more accurate and persuasive predictions.
USER EXPECTATIONS FROM FORECASTS AND THEIR PERCEPTIONS OF QUALITY Tables III and IV display the ratings for attributes of a high-quality forecast measured on a scale from 1 (strongly disagree) to 7 (strongly agree). It can be seen that there is broad agreement between expectations and perceptions, so that H1 is supported. The fi rst canonical correlation between the two sets of responses was highly signifi cant (c2
36= 172.54, p < 0.001; the redundancy of the expec-tation dimensions on the quality aspects was 32.1%, while the redundancy of the quality aspects on expectation aspects was 28.9%.). Moreover, another question directly asked the participants whether a forecast satisfying their expectations could be considered to be a high-quality forecast. The mean rating to this question was 6.2, indicating a strong agreement.
Practitioners receiving forecasts from multiple sources had higher expectations about them being timely and being based on solid foundations and assumptions than those receiving their forecast from a single source. The multiple forecast group gave a mean rating of 6.56 for timeliness aspect and 6.58 for the forecast having a justifi able basis, while the corresponding scores for the single forecast group were of 6.10 and 6.00. The differences between both pairs of mean ratings were statistically signifi cant (t43= 2.06, p = 0.046; and t37= 2.09, p = 0.043, respectively). A similar fi nding was also observed for the quality perceptions. A willingness to pay for multiple forecasts is likely to be a refl ection of the importance of the forecasts to the organization concerned and this may be associated with high expectations of quality.
Table II. The presence of another person inspecting the adjusted forecasts
Does this person: Rarely Sometimes Frequently
Introduce further adjustments? 20.0% (8) 62.5% (25) 17.5% (7) Demand explanations for your adjustments? 17.5% (7) 30.0% (12) 52.5% (21) Have access to the original/unadjusted forecasts? 10.0% (4) 40.0% (16) 50.0% (20)
Table III. Perceptions of a high-quality forecast
Mean rating
A high-quality forecast is timely 6.31
A high-quality forecast has the smallest amount of error possible 6.29 A high-quality forecast has sound and justifi able basis and assumptions 6.24 A high-quality forecast includes scenarios and alternative forecasts covering a variety of
circumstances
6.14 A high-quality forecast has a tolerable (not necessarily minimal) amount of error 5.63
Which attributes of a forecast were most important to users when they assessed its quality? Table IV shows the extent to which the respondents agreed with each of set of statements relating to expectations. The highest ratings for expectations were given for the attributes of timeli-ness and forecasts having a sound and justifi able basis and assumptions. Interestingly, accuracy (as represented by the third statement in Table III) did not achieve the highest rating in users’ expecta-tions, though it was a close third. Thus H2 (that accuracy was the most important criterion) was not supported. However, users tended to have a higher expectation that their forecasts would have the smallest error possible, rather than merely a tolerable error (this difference in expectations is statis-tically signifi cant (t123= 3.99, p < 0.0001). Among all the aspects, forecasts having reasonable costs received the lowest ratings for expectations. The users expected to pay for their timely, well-justifi ed and accurate forecasts.
REASONS AND MOTIVATIONS BEHIND ADJUSTING OR NOT ADJUSTING THE PROVIDED FORECASTS
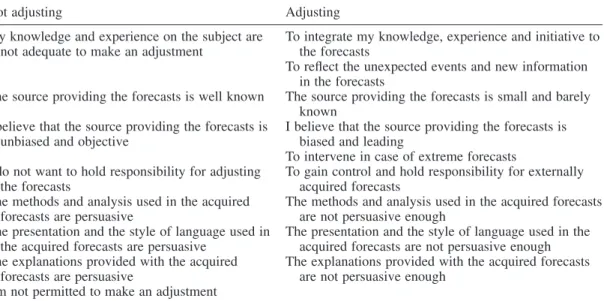
Potential reasons for adjusting or not adjusting forecasts are provided in Table V as matching pairs. Respondents were asked to indicate how frequently each reason led to a decision to adjust or not Table IV. Expectations of forecast users
Mean rating
A forecast should be timely 6.44
A forecast should have a sound and justifi able basis and assumptions 6.43 A forecast should have the smallest amount of error possible 6.38 A forecast should include scenarios and alternative forecasts covering a variety of circumstances 6.02 A forecast should have a tolerable (not necessarily minimal) amount of error 5.83
A forecast should have a reasonable cost 5.42
Table V. Reasons and motivations for adjusting/not adjusting the given predictions
Not adjusting Adjusting
My knowledge and experience on the subject are not adequate to make an adjustment
To integrate my knowledge, experience and initiative to the forecasts
To refl ect the unexpected events and new information in the forecasts
The source providing the forecasts is well known The source providing the forecasts is small and barely known
I believe that the source providing the forecasts is unbiased and objective
I believe that the source providing the forecasts is biased and leading
To intervene in case of extreme forecasts I do not want to hold responsibility for adjusting
the forecasts
To gain control and hold responsibility for externally acquired forecasts
The methods and analysis used in the acquired forecasts are persuasive
The methods and analysis used in the acquired forecasts are not persuasive enough
The presentation and the style of language used in the acquired forecasts are persuasive
The presentation and the style of language used in the acquired forecasts are not persuasive enough The explanations provided with the acquired
forecasts are persuasive
The explanations provided with the acquired forecasts are not persuasive enough
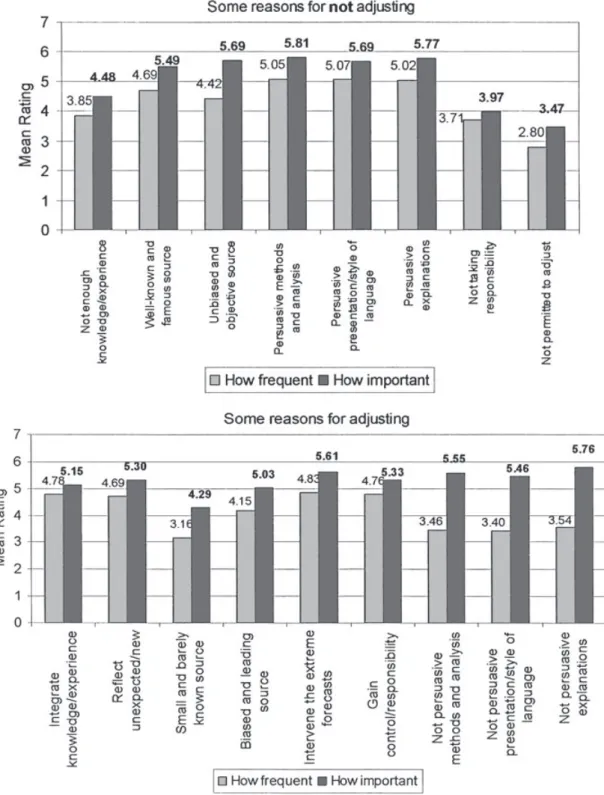
adjust on a scale from 1 (very rarely) to 7 (very frequently), as well as how important each reason was in the adjustment decision on a scale from 1 (not important at all) to 7 (very important). Figure 1 presents their mean responses.
It can be seen that the most frequent and important reason for refraining from making an adjust-ment was related to the persuasive power of the provided forecast. Forecasts that used persuasive methods and analysis and were persuasive in their style of language and presentation tended to be accepted without changes. Thus H5 (that forecasts accompanied by clear explanations of their ratio-nale are adjusted less frequently) is supported. Receiving the forecasts from a well-known source was also a frequently used and important reason for not adjusting, so that H6 was also supported. However, fewer forecasts were left unadjusted because respondents felt that they lacked the authority or expertise to change them, or because they did not want to take responsibility for the adjustment.
Where judgmental adjustments were applied, the most common motivations related to the percep-tion that the adjuster could make some contribupercep-tion to the forecasts by integrating their knowledge and experience, incorporating the effects of unexpected events or intervening when the forecast was judged to be extreme. Gaining control and responsibility for the forecast was also a frequent reason for adjustment. The absence of persuasive methods or explanations was a less frequent reason for adjustment, suggesting that the forecasts received tended to be well supported by analyses that were perceived to be justifi ed and well explained. Relatively few forecasts were adjusted because they came from a small or barely known source. This factor was also judged to be relatively unimportant by the respondents.
It is interesting to take a comparative look at the importance ratings for the reasons to adjust or not adjust where these could be paired (Figure 2). The desire to integrate one’s knowledge and experience was signifi cantly more important as a reason for making an adjustment (t122 = −2.40,
p = 0.018), suggesting that the respondents had confi dence in their ability to improve the forecasts
they received. Likewise, making an adjustment in order to take responsibility for the forecast was more important than not adjusting to avoid responsibility (t122= −5.03, p < 0.0001), suggesting that the respondents perceived themselves to be highly responsible for the forecasts. Moreover, the source of the forecasts was a more important factor in preventing an adjustment than in encouraging one (t122= 6.57, p < 0.0001 for well-known vs. barely known source, t122= 3.75, p < 0.0001 for objective vs. biased source). This may be because respondents tended to receive their forecasts from well-known sources anyway.
THE ROLE OF FEEDBACK
Practitioners receiving forecasts from multiple sources have to deal with and evaluate many forecasts at the same time. Without using some feedback mechanism this task can prove to be quite unman-ageable and burdensome given the accumulation of these forecasts over a period of time. Thus it seems reasonable to expect that the use of systematic or personal feedback will be more common amongst practitioners acquiring forecasts from multiple sources and the survey results were consis-tent with this. 41% of the multiple-source group claimed to utilize feedback information, while this was the case for less than half of the single-source group (19.4%) (the difference was signifi cant:
z = 2.46, p = 0.014).
H7 indicated that that forecasts will be adjusted more when feedback on their accuracy is available either because forecasters use feedback to assess the effectiveness of their adjustments or because
the feedback makes errors in the provided forecasts more salient and hence detracts from their cred-ibility. The survey provided evidence to support H7. 49% of frequent adjusters employed feedback compared to only 24.1% of rare adjusters (z = 2.24, p = 0.025).
The presence of feedback had the effect of signifi cantly reducing the importance of reasons for adjusting or not adjusting forecasts (see Table VI). By providing ‘hard evidence’ on the accuracy of forecasts, it appears that feedback reduces reliance on other attributes that practitioners use to assess the quality of forecasts (such as its origin from a well-known source or the persuasiveness of its rationale). On the other hand, feedback can allow practitioners to compensate for the existence of errors in the forecasts to some extent, particularly if these are systematic, and this may decrease their dependence on a ‘high-quality’ supplier.
EXPERIENCE OF USING FORECASTS AND ITS EFFECTS ON THE RESPONSES The respondents were divided into three distinct groups to refl ect their levels of experience of fore-cast use: the novice practitioners (those with less than 4 years’ experience), the familiar practitioners (those with 4–9 years’ experience) and the experienced practitioners (those with more than 9 years’ experience). To what extent was experience associated with different levels of expectations and different frequencies of adjustment?
Generally, there were no signifi cant differences between the three groups in their expectations concerning different aspects of forecast quality. The only signifi cant difference related to Figure 2. Relative importance of reasons for making or not making an adjustment
expectations that the forecast would produce a tolerable error that was not necessarily the minimum possible error. The novice group had a mean level of agreement that this was their expectation of 5.19, while the familiar group had a mean of 5.86 and the experienced group 6.24. One-way ANOVA indicated that this difference was signifi cant (F2,119 = 4.96, p = 0.008). This fi nding provides some evidence to suggest that, even though forecast users expect to obtain as accurate predictions as pos-sible, through experience and familiarity, they gain a more realistic expectation of the presence and nature of forecast errors.
Similarly, no signifi cant differences were found in the reported frequency of adjustment between the three groups, nor did they signifi cantly differ in their beliefs that adjustments improve accuracy. Thus there was no support for H3. As expected, fewer of the more experienced forecasters had someone checking their adjustments (40.6% of the novices, 30.6% of familiar practitioners and 24.4% of the experienced practitioners had their forecast adjustments checked), but even here the differences were not statistically signifi cant at the 5% level. Nor were there any signifi cant differ-ences in the importance and frequency of different reasons for adjusting or not adjusting. Overall, experience seems to have little effect on forecast expectations and attitudes to forecast adjustments.
PRACTITIONERS’ POSITION IN THE COMPANY AND ITS EFFECT ON THE RESPONSES
Among the respondents, there existed four distinct groups with respect to their position in the company: the partners/owners of the company, CEOs/members of the executive board, managers and staff. Did these groups differ in their expectations and forecasting behavior?
As with experience (which, of course, is likely to be associated with seniority), few differences in expectations were discernible between the four groups. In particular, the reported frequencies of adjustment between the four groups were not signifi cantly different. Nor did the groups differ sig-nifi cantly in their beliefs that adjustments improve accuracy. Thus there was no support for H4. The Table VI. Presence of feedback and importance ratings provided for the reasons behind adjusting vs. not adjusting
Importance of reasons for not adjusting
Well-known and reputable source Unbiased and objective source Systematic/personal feedback present 4.95 5.11
No feedback mechanism 5.79 6.01
Difference signifi cant? t63= −2.63, p = 0.011 t65= −2.83, p = 0.006 Importance of reasons for adjusting
No persuasive methods and analysis
No persuasive presentation/style of language No persuasive explanations Systematic/personal feedback present 5.09 4.72 5.23 No feedback mechanism 5.80 5.86 6.05
only statistically signifi cant distinction related to anticipations of the costs. The partners/owners provided a mean rating of 5.9 to the expectation that external forecasts should be obtained with a reasonable cost. The CEOs/members of the executive board gave a mean rating 4.7, the managers 5.1 and the staff 5.5 (F3,120= 2.79, p = 0.043). Interestingly, the partners/owners gave a signifi cantly higher mean rating for their expectations of a reasonable cost than for their perceptions of the impor-tance of these costs as an aspect of quality (5.9 vs. 5.4, t57= 2.31, p = 0.024).
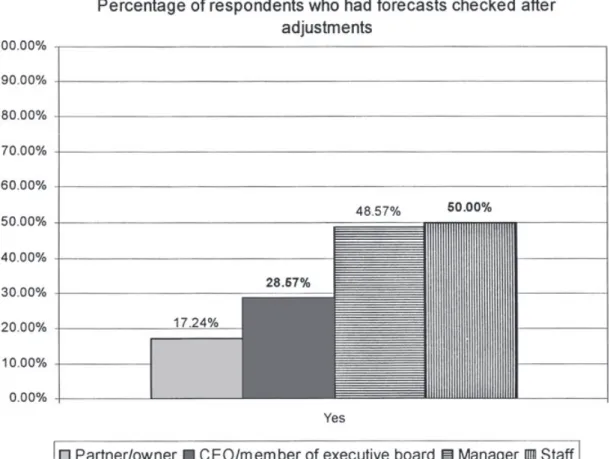
As expected, more senior respondents were less likely to have their forecast adjustments inspected and checked by another person (see Figure 3). The differences in the percentages among partners/ owners, managers, and staff were signifi cant (partners/owners vs. managers: z = −3.20, p = 0.001, partners/owners vs. members of staff: z = −1.98, p = 0.048).
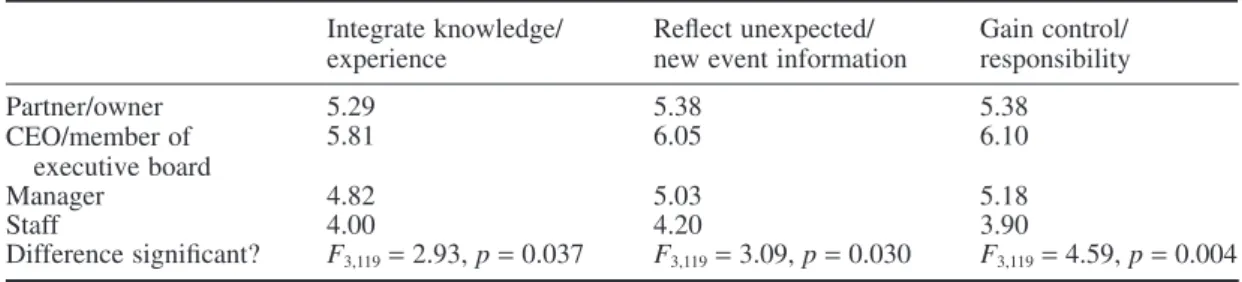
Although there were no signifi cant differences between the groups in their frequency of adjust-ment, there were differences in their motivations for deciding to adjust forecasts (see Table VII). It can be seen that more senior users tended to attach much higher importance to their knowledge and experience and their ability to estimate the effects of unexpected events. They also saw a greater need to gain control and take responsibility for the forecasts.
SUMMARY
Financial and economic forecasts are widely used by organizations to guide them in their decision making. These differ from forecasts that are usually employed in product demand forecasting and other areas in that they are frequently obtained from external sources, and hence may carry an explicit purchase cost. They will also often be based on expert judgment and will sometimes be accompanied by an explanation of how they were derived and the assumptions they were based on. This paper has provided insights into what these users expect from their forecasts, what they consider to be important aspects of quality and how frequently they modify these forecasts and why.
In general, the cost of the forecasts appears to be less important than aspects like timeliness, accuracy and underlying rationale. Adjustments tend to be made less when the arguments underlying the forecast are transparent and persuasive, and when the source is well known. More adjustments tend to be made when the forecaster sees an opportunity to integrate his or her knowledge and experience, where the underlying rationale is unpersuasive, and where there is a perceived need to take ownership of, and responsibility for, the forecast. However, the presence of feedback on forecast accuracy means that these factors have less prominence in decisions on whether to adjust forecasts. Surprisingly, experience of using forecasts and level of seniority within the organization have only weak effects on attitudes to forecasting and the propensity to adjust forecasts.
As important channels for knowledge sharing in organizations, forecasts carry signifi cant opera-tional consequences for both their providers and users. This study constitutes an initial step towards enhancing our understanding of the preferences, needs and expectations of forecast users and deci-sion makers in the fi nancial arena. Future work on forecast use and adjustment in diverse domains is needed to establish an improved forum for communicating and negotiating the differential needs of producers and consumers of forecasts.
REFERENCES
Collopy F, Armstrong JS. 1992. Expert opinions about extrapolation and the mystery of the overlooked disconti-nuities. International Journal of Forecasting 8: 575–582.
Diamantopoulos A, Mathews B. 1989. Factors affecting the nature and effectiveness of subjective revision in sales forecasting: an empirical study. Managerial and Decision Economics 10: 51–59.
Donihue MR. 1993. Evaluating the role judgment plays in forecast accuracy. Journal of Forecasting 12: 81–92. Fildes R, Goodwin P. 2007. Against your better judgment? How organizations can improve their use of
manage-ment judgmanage-ment in forecasting. Interfaces 37: 570–576.
Fildes R, Hastings R. 1994. The organisation and improvement of market forecasting. Journal of the Operational
Research Society 45: 1–16.
Table VII. Practitioner’s position and importance ratings provided for the reasons for making an adjustment Integrate knowledge/
experience
Refl ect unexpected/ new event information
Gain control/ responsibility Partner/owner 5.29 5.38 5.38 CEO/member of executive board 5.81 6.05 6.10 Manager 4.82 5.03 5.18 Staff 4.00 4.20 3.90
Goodwin P. 1996. Statistical correction of judgmental point forecasts and decisions. Omega 24: 551–559. Harvey N, Harries C, Fischer I. 2000. Using advice and assessing its quality. Organizational Behavior and Human
Decision Processes 81: 252–273.
Lim JS, O’Connor M. 1995. Judgmental adjustment of initial forecasts: its effectiveness and biases. Journal of
Behavioral Decision Making 8: 149–168.
Mahmoud E, Rice G, Malhotra N. 1988. Emerging issues in sales forecasting and decision support systems. Journal
of the Academy of Marketing Science 16: 47–61.
Mathews BP, Diamantopoulos A. 1989. Judgemental revision of sales forecasts: a longitudinal extension. Journal
of Forecasting 8: 129–140.
Mathews BP, Diamantopoulos A. 1990. Judgemental revision of sales forecasts: effectiveness of forecast selection.
Journal of Forecasting 9: 407–415.
Mentzer JT, Cox JE. 1984. Familiarity, application, and performance of sales forecasting techniques. Journal of
Forecasting 3: 27–36.
Önkal D, Gönül MS. 2005. Judgmental adjustment: a challenge for providers and users of forecasts. Foresight
1: 13–17.
Sanders NR, Manrodt KB. 1994. Forecasting practices in US corporations: survey results. Interfaces 24: 92– 100.
Sanders NR, Manrodt KB. 2003. The effi cacy of using judgmental versus quantitative forecasting methods in practice. Omega 31: 511–522.
Sanders N, Ritzman L. 2001. Judgmental adjustments of statistical forecasts. In Principles of Forecasting: A
Handbook for Researchers and Practitioners, Armstrong JS (ed.). Kluwer Academic: Norwell, MA, 2001; Ch.
13.
Taylor PF, Thomas ME. 1982. Short term forecasting: horses for courses. Journal of the Operational Research
Society 33: 685–694.
Turner DS. 1990. The role of judgment in macroeconomic forecasting. Journal of Forecasting 9: 315–345. Willemain TR. 1989. Graphical adjustment of statistical forecasts. International Journal of Forecasting 5: 179–
185.
Winklhofer HM, Diamantopoulos A. 2002. Managerial evaluation of sales forecasting effectiveness: a MIMIC modeling approach. International Journal of Research in Marketing 19: 151–166.
Witt S, Witt C. 1992. Modeling and Forecasting Demand in Tourism. Academic Press: London.
Yaniv I. 2004a. Receiving other people’s advice: Infl uence and benefi t. Organizational Behavior and Human
Decision Processes 93: 1–13.
Yaniv I. 2004b. The benefi t of additional opinions. Current Directions in Psychological Science 13: 75–78. Yaniv I, Kleinberger E. 2000. Advice taking in decision making: egocentric discounting and reputation formation.
Organizational Behavior and Human Decision Processes 83: 260–281.
Yokum JT, Armstrong JS. 1995. Beyond accuracy: comparison of criteria used to select forecasting methods.
International Journal of Forecasting 11: 591–597.
APPENDIX: QUESTIONNAIRE (This is a direct translation of the Turkish used on the original form) Dear participant,
This survey is a part of a research project conducted in Bilkent University Faculty of Business Administration with the aim of understanding the use of fi nancial and economic forecasts, expecta-tions from those forecasts and the adjustments made to those forecasts. There are no right or wrong answers. The important point is answering the questions according to what you really think or believe. After reading carefully, please attend to all questions in a way that will best refl ect your observations and thoughts. No personal information and names will be disclosed. The results will be used in a generalized manner and only for research purposes. Your time and effort for complet-ing this survey is extremely valuable for us.
Your name: Phone number:
1. What is the name of the company you are working for? 2. What is your position?
3. How long have you been in this position?
䊐 Less than 1 year 䊐 1–3 years 䊐 4–6 years 䊐 More than 9 years 4. Do you use fi nancial and economic forecasts in your company?
䊐 Yes
䊐 No (PLEASE ANSWER QUESTIONS 7, 8 & 9 AND THEN KINDLY SKIP TO QUESTION 32.)
5. What are the types of fi nancial and economic forecasts that are used in your company? (You may select more than one.)
䊐 Currency/parity 䊐 Stock price 䊐 Investment funds 䊐 Interest/bond 䊐 Macroeconomic 䊐 Other:
6. How long have you been using fi nancial and economic forecasts?
䊐 Less than 1 year 䊐 1–3 years 䊐 4–6 years 䊐 7–9 years 䊐 More than 9 years 7. What are your expectations from fi nancial and economic forecasts? (What do you expect them
to have and how should they be?)
8. Some expectations from fi nancial and economic forecasts are provided below. Please indicate the degree of your agreement by giving an appropriate value between 1–7.
(a) A forecast should have the smallest amount of error possible.
Strongly disagree 1 2 3 4 5 6 7 Strongly agree
(b) A forecast should have a tolerable (not necessarily minimal) amount of error.
Strongly disagree 1 2 3 4 5 6 7 Strongly agree
(c) A forecast should have a plausible and justifi able basis and assumptions.
Strongly disagree 1 2 3 4 5 6 7 Strongly agree
(d) A forecast should include scenarios and alternative forecasts covering a variety of circumstances.
Strongly disagree 1 2 3 4 5 6 7 Strongly agree
(e) A forecast should have a reasonable cost.
Strongly disagree 1 2 3 4 5 6 7 Strongly agree
(f) A forecast should be timely.
Strongly disagree 1 2 3 4 5 6 7 Strongly agree
9. As long as a fi rm reaches its targets, some error in forecasts is tolerable.
Strongly disagree 1 2 3 4 5 6 7 Strongly agree
10. Please select the most suitable answer.
䊐 The fi nancial and economic forecasts that we use are produced in our department. 䊐 The fi nancial and economic forecasts that we use are acquired externally (from banks,
IF THE MAJORITY OF FORECASTS ARE PRODUCED IN YOUR DEPARTMENT PLEASE PROVIDE ANSWERS TO THE FOLLOWING QUESTIONS BY CONSIDERING THE CASES WHEREYOU HAVE ACQUIRED EXTERNAL FORECASTS.
11. Do you acquire forecasts from different sources?
䊐 Yes. (We acquire forecasts from more than one source.)
䊐 No. (We acquire forecasts from a single source only.) (PLEASE SKIP TO QUESTION 13.)
12. When you acquire forecasts from more than one source, which of the following do you usually employ?
䊐 I choose a single source among them and use only that source.
䊐 The forecasts from these sources are distinct and are not suitable for combination.
䊐 I combine various forecasts and use the combination. I utilize a statistical method (simple average, weighted average etc.) for combination.
䊐 I combine various forecasts and use the combination. I do not utilize a statistical method, instead I combine according to my judgment and experience.
13. Do externally acquired forecasts include scenarios and alternative forecasts?
Almost never 1 2 3 4 5 6 7 Almost always
14. Do externally acquired forecasts include explanations about forecasts?
Almost never 1 2 3 4 5 6 7 Almost always
15. Do you apply adjustments/revisions on the externally acquired forecasts?
Almost never 1 2 3 4 5 6 7 Almost always
16. What is the most important reason for you when you choose not to adjust an acquired forecast?
17. What is the most important reason for you to apply an adjustment on an acquired forecast? 18. Some situations where externally acquired forecasts are not adjusted are provided below. Please
indicate how frequently they occur by giving each statement an appropriate value between 1–7.
(a) My knowledge and experience on the subject is not adequate to make an adjustment.
Very rarely 1 2 3 4 5 6 7 Very frequently
(b) The source providing the forecasts is well-known and famous.
Very rarely 1 2 3 4 5 6 7 Very frequently
(c) I believe that the source providing the forecasts is unbiased and objective.
Very rarely 1 2 3 4 5 6 7 Very frequently
(d) The methods and analysis used in the acquired forecasts are highly persuasive.
Very rarely 1 2 3 4 5 6 7 Very frequently
(e) The presentation and the style of language used in the acquired forecasts are highly persuasive.
Very rarely 1 2 3 4 5 6 7 Very frequently
(f) The explanations provided with the acquired forecasts are highly persuasive.
(g) I do not want to be responsible for the consequences of the adjustment.
Very rarely 1 2 3 4 5 6 7 Very frequently
(h) I’m not authorized to make an adjustment.
Very rarely 1 2 3 4 5 6 7 Very frequently
19. Some situations where externally acquired forecasts are not adjusted are provided below. Please indicate how important they are by giving each statement an appropriate value between 1–7.
(a) My knowledge and experience on the subject is not adequate to make an adjustment.
Not important at all 1 2 3 4 5 6 7 Very important
(b) The source providing the forecasts is well-known and famous.
Not important at all 1 2 3 4 5 6 7 Very important
(c) I believe that the source providing the forecasts is unbiased and objective.
Not important at all 1 2 3 4 5 6 7 Very important
(d) The methods and analysis used in the acquired forecasts are highly persuasive.
Not important at all 1 2 3 4 5 6 7 Very important
(e) The presentation and the style of language used in the acquired forecasts are highly persuasive.
Not important at all 1 2 3 4 5 6 7 Very important
(f) The explanations provided with the acquired forecasts are highly persuasive.
Not important at all 1 2 3 4 5 6 7 Very important
(g) I do not want to be responsible for the consequences of the adjustment.
Not important at all 1 2 3 4 5 6 7 Very important
(h) I’m not authorized to make an adjustment.
Not important at all 1 2 3 4 5 6 7 Very important
20. Some situations where externally acquired forecasts are adjusted are provided below. Please indi-cate how frequently they occur by giving each statement an appropriate value between 1–7. (a) To integrate my knowledge, experience and initiative into the forecasts.
Very rarely 1 2 3 4 5 6 7 Very frequently
(b) To refl ect the unexpected events and new information into the forecasts.
Very rarely 1 2 3 4 5 6 7 Very frequently
(c) The source providing the forecasts is small and barely-known.
Very rarely 1 2 3 4 5 6 7 Very frequently
(d) I believe that the source providing the forecasts is biased and leading.
Very rarely 1 2 3 4 5 6 7 Very frequently
(e) There are extreme forecasts present.
Very rarely 1 2 3 4 5 6 7 Very frequently
(f) To gain control of and take responsibility for externally acquired forecasts.
Very rarely 1 2 3 4 5 6 7 Very frequently
(g) The methods and analysis used in the acquired forecasts are not persuasive enough.
Very rarely 1 2 3 4 5 6 7 Very frequently
(h) The presentation and the style of language used in the acquired forecasts are not persuasive enough.
Very rarely 1 2 3 4 5 6 7 Very frequently
(i) The explanations provided with the acquired forecasts are not persuasive enough.
21. Some situations where externally acquired forecasts are adjusted are provided below. Please indicate how important they are by giving each statement an appropriate value between 1–7. (a) To integrate my knowledge, experience and initiative into the forecasts.
Not important at all 1 2 3 4 5 6 7 Very important
(b) To refl ect the unexpected events and new information into the forecasts.
Not important at all 1 2 3 4 5 6 7 Very important
(c) The source providing the forecasts is small and barely-known.
Not important at all 1 2 3 4 5 6 7 Very important
(d) I believe that the source providing the forecasts is biased and leading.
Not important at all 1 2 3 4 5 6 7 Very important
(e) There are extreme forecasts present.
Not important at all 1 2 3 4 5 6 7 Very important
(f) To gain control of and take responsibility for externally acquired forecasts.
Not important at all 1 2 3 4 5 6 7 Very important
(g) The methods and analysis used in the acquired forecasts are not persuasive enough.
Not important at all 1 2 3 4 5 6 7 Very important
(h) The presentation and the style of language used in the acquired forecasts are not persuasive enough.
Not important at all 1 2 3 4 5 6 7 Very important
(i) The explanations provided with the acquired forecasts are not persuasive enough.
Not important at all 1 2 3 4 5 6 7 Very important
22. Adjustments made to the forecasts improve their accuracy.
Almost never 1 2 3 4 5 6 7 Almost always
23. Adjustments applied done to the forecasts make them more persuasive.
Almost never 1 2 3 4 5 6 7 Almost always
24. Does anyone check your forecasts after you have applied your adjustments? 䊐 Yes
䊐 No (PLEASE SKIP TO QUESTION 30.)
25. Does this person introduce further adjustments on those forecasts?
Almost never 1 2 3 4 5 6 7 Almost always
26. Does this person expect explanations about the adjustments you have made?
Almost never 1 2 3 4 5 6 7 Almost always
27. Does this person access the original (unadjusted) forecasts?
Almost never 1 2 3 4 5 6 7 Almost always
28. I believe that further adjustments made on already adjusted forecasts improve their accuracy.
Strongly disagree 1 2 3 4 5 6 7 Strongly agree
29. I believe that further adjustments applied on already adjusted forecasts make them more persuasive.
30. Is there a feedback mechanism about the accuracy of forecasts in your company? 䊐 Yes, there is a systematic feedback mechanism.
䊐 No, there is no systematic feedback, however, some feedback applications are observed at personal level.
䊐 No, there are neither systematic nor personal feedback applications in the fi rm. (PLEASE SKIP TO QUESTION 32.)
31. Do you believe that those feedback applications are useful? How? 32. According to you, what is the meaning of a ‘high-quality forecast’?
33. The only criterion for appraising the quality of a forecast should be accuracy.
Strongly disagree 1 2 3 4 5 6 7 Strongly agree
34. A forecast satisfying my expectations can be considered to be a high-quality forecast.
Strongly disagree 1 2 3 4 5 6 7 Strongly agree
35. Some statements about the quality of forecasts are provided below. Please indicate the degree of your agreement by giving an appropriate value between 1–7.
(a) A high-quality forecast has a plausible and justifi able basis and assumptions.
Strongly disagree 1 2 3 4 5 6 7 Strongly agree
(b) A high-quality forecast includes scenarios and alternative forecasts covering a variety of circumstances.
Strongly disagree 1 2 3 4 5 6 7 Strongly agree
(c) A high-quality forecast has the smallest amount of error possible.
Strongly disagree 1 2 3 4 5 6 7 Strongly agree
(d) A high-quality forecast has a tolerable (not necessarily minimal) amount of error.
Strongly disagree 1 2 3 4 5 6 7 Strongly agree
(e) A high-quality forecast has a reasonable cost.
Strongly disagree 1 2 3 4 5 6 7 Strongly agree
(f) A high-quality forecast is timely.