INSTITUTE OF NATURAL AND APPLIED SCIENCES
CRYSTAL AND MOLECULAR STRUCTURE ANALYSIS OF
Dichloro[1,3-bis-(2-ethoxybenzyl)benzimidazole-2-ylidene] pyridine
palladium(II)AND Dichloro
-[1-(2,3,4,5,6-pentametilbenzil)-3-(2,3,5,6tetrametil) benzimidazol-2-yliden]Ruthenium (II)
BY SINGLE CRYSTAL X-RAY DIFFRACTION TECHNIQUE
Sirwan Salih HASAN
MASTER THESIS OF SCIENCE
PHYSICS DEPARTMENT
DİYARBAKIR
JUNE - 2015
INSTITUTE OF NATURAL AND APPLIED SCIENCES
CRYSTAL AND MOLECULAR STRUCTURE ANALYSIS OF
Dichloro[1,3-bis-(2-ethoxybenzyl)benzimidazole-2-ylidene] pyridine
palladium(II)AND Dichloro
-[1-(2,3,4,5,6-pentametilbenzil)-3-(2,3,5,6tetrametil) benzimidazol-2-yliden]Ruthenium (II)
BY SINGLE CRYSTAL X-RAY DIFFRACTION TECHNIQUE
Sirwan Salih HASAN
MASTER THESIS OF SCIENCE
PHYSICS DEPARTMENT
SUPERVISED BY
Assoc. Prof. Dr. Ömer ÇELIK
DİYARBAKIR
JUNE - 2015
I
I would like to acknowledge several people who supported me during my time as a Msc student.
Firstly, I would like to thank my supervisor Assoc. Prof. Dr. Ömer ÇELIK for his support, fruitful discussions, and meaningful input during all the time. I would also like to thank Assoc. Prof. Dr. Yusuf SELIM OCAK for filling the role of the secondary reviewer.
I would also like to thank to Fırat ANĞAY, for being there and support me in several ways.
Finally, I would like to thank my family and friends for their support during the time of my thesis.
Sirwan Salih HASAN
II
ACKNOWLEDGMENTS ... I CONTEXT ... II ÖZET...IV ABSTRACT ... V LIST OF TABLES ...VI LIST OF FIGURES ... VII LIST OF SYMBOLS ...IX
1. INTRODUCTION ... 1
2. LITERATURE SUMMARY ... 3
3. MATERIAL AND METHOD ... 7
3.1. Synthesis ... 7
3.1.1. Synthesis of Single Crystal of Dichloro-[1,3-bis-(2-etoksibenzil)benzimidazole-2-yliden] pyridine palladium (II)...7
3.1.2. Synthesis of Single Crystal of Dichloro -[1-(2,3,4,5,6-pentametilbenzil)-3-(2,3,5,6 tetramethyl) benzimidazole-2-yliden]Ruthenium (II)...8
3.2. X-ray Crystallography ... 8
3.2.1. Basic Principles of X-ray Crystallography...8
3.2.2. Crystallinity ...10
3.2.3. Historical Background of X-rays and Crystallography ...10
3.2.4. Diffraction of X-ray by crystals ...12
3.2.5. Crystal Structure and Symmetry ...14
3.2.6. Point Group ...18
3.2.7. Space Groups...18
3.2.8. Bragg’s Law...20
3.2.9. Miller Indices... 22
3.2.10. The Reciprocal Lattice and Ewald Sphere ...22
3.2.11. The structure factor ...24
III
3.3.2. Generation of X-rays...28
3.3.3. Synchrotron source X-ray generation ...31
3.3.4. X-ray Detectors ...31
3.3.5. The goniometer ...33
3.3.5.1. Goniometer head ...34
3.4. Single Crystal X-ray Diffraction ... 35
3.4.1. Introduction ...35
3.4.2. Experimental Set-up ...36
3.4.3. Data Collection Strategy ...37
3.4.4. Device Information ...38
3.4.5. Structure Solution...39
3.4.5.1. Stage 1 – Measurement of X-ray intensities...40
3.4.5.2. Stage 2 – The crystallographic phase problem and possible solutions....42
3.4.5.2.1 Patterson Methods ...43
3.4.5.2.2 Direct Methods ...44
3.4.5.3 Stage 3 - Structure Refinement ...44
4. FINDING AND DISCUSSION ... 47
4.1. Overview ... 47
4.2. Compound I: Dichloro[1,3-bis-(2-ethoxybenzyl)benzimidazole-2-ylidene] pyridine palladium(II) ... 47
4.3. Compound II: Dichloro-[1-(2,3,4,5,6-pentametilbenzil)-3-(2,3,5,6 tetramethyl) benzimidazole-2-ylidene] Ruthenium(II). ... 62
5. RESULTS AND SUGGESTION ... 83
IV
X-IŞINLARI KIRINIM METODU ILE
Dichloro[1,3-bis-(2-ethoxybenzyl)benzimidazole-2-ylidene] pyridine palladium(II)AND Dichloro -[1-(2,3,4,5,6-pentametilbenzil)-3-(2,3,5,6tetrametil) benzimidazol-2-yliden]Ruthenium (II)
KOMPLEKSLERININ KRISTAL VE MOLEKULER YAPI ANALIZI
YUKSEK LISANS TEZI
Sirwan Salih HASAN
DİCLE ÜNİVERSİTESİ FEN BİLİMLERİ ENSTİTÜSÜ
FIZIK ANABİLİM DALI 2015
Bu tez kapsaminda yapilan temel çalişma, X-Işınlarınları kristalografi çalışmasıdır. Içerik olarak, kimyasal formülleri arasinda siralanmis, Dichloro[1,3-bis-(2-ethoxybenzyl)benzimidazole-2-ylidene] pyridine palladium(II) ve Dichloro-[1-(2,3,4,5,6-pentametilbenzil)-3-(2,3,5,6 tetramethyl) benzimidazole-2-yliden]Ruthenium (II)metal kompleksinin molekül ve kristal yapilara aydinlatilmaktir.
I. ZnCl2(C8H6N2)2
II. II. ZnBr2(C8H6N2)2
Bilimsel ve endüstriyel alanda oldukça önemli olan bu komplekslerin yapilara, WINGX paket programa kapsaminda yer alan SHELXS97, SHELXL97, PARST97, PLATON2000 programlara ve CHEMDRAW ile ORTEPIII çizim programlara kullanilarak analiz edilmistir. Gerekli deneysel veriler, Dicle Üniversitesi Bilim ve Teknoloji Arastirma ve Uygulama Merkezi X-Isinlari laboratuarunda bulunan Bruker Breeze ApexII tipi kirinimmetre ile elde edilmistir.
V
CRYSTAL AND MOLECULAR STRUCTURE ANALYSIS OF Dichloro[1,3-bis-(2-ethoxybenzyl)benzimidazole-2-ylidene] pyridine palladium(II)AND Dichloro -[1-(2,3,4,5,6-pentametilbenzil)-3-(2,3,5,6tetrametil) benzimidazol-2-yliden]Ruthenium (II)
BY SINGLE CRYSTAL X-RAY DIFFRACTION TECHNIQUE
MASTER DEGREE THESIS
Sirwan Salih HASAN
DİCLE UNIVERSITY
INSTITUTE OF NATURAL AND APPLIED SCIENCES PHYSICS DEPARTMENT
2015
The fundamental study reported in this thesis is X-ray crystallography work. In the scope, crystal and molecular structures of two compounds Dichloro[1,3-bis-(2-ethoxybenzyl)benzimidazole-2-ylidene] pyridine palladium(II) and Dichloro-[1-(2,3,4,5,6-pentametilbenzil)-3-(2,3,5,6 tetramethyl) benzimidazole-2-ylidene] Ruthenium(II). (Which their chemical formula have been given as follows) were revealed.
I. C30H31Cl2N3O2Pd
II. II. C32H41Cl3N2Ru
The structures of these complexes (having big importance in scientific and industrial area) were analyzed by using SHELXS97, SHELXL97, PARST97, PLATON2000 programmes located in WinGX package program and CHEMDRAW with ORTEP molecular drawing programs. Required experimental data were collected by Bruker Breeze ApexII CCD type diffractometer in X-ray laboratory of Dicle University, Science and Technological Research and Application Center.
VI
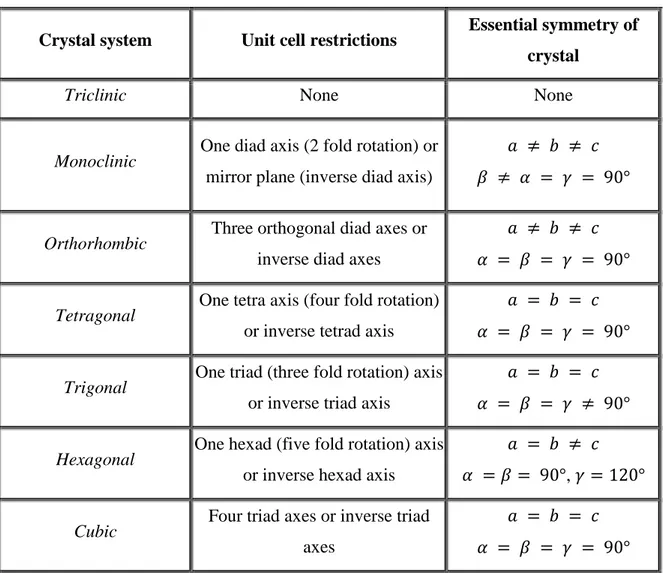
Table 3.1. The essential crystal symmetry and unit cell restrictions of the seven crystal
systems. ... 16
Table 4.1. Sumamry of crystallographic data for compound (I) ... 49
Table 4.2. Atomic bond lengths (Å) of compound (I) ... 52
Table 4.3. Atomic bond lengths (Å) of compound (I) ... 53
Table 4.4. Analysis of Short Ring-Interactions ... 54
Table 4.5. Hydrogen-bond geometry (Å, °) of compound (I) ... 55
Table 4.6. Fractional atomic coordinates and isotropic or equivalent isotropic displacement parameters (Å2) of compound (I) ... 60
Table 4.7. Atomic displacement parameters (Å2) of compound compound (I) ... 61
Table 4.8. Sumamry of crystallographic data for compound (II) ... 63
Table 4.9. The comparison of the peak differences in electron desnity map of previous studies... 65
Table 4.10. Dihedral angles formed by LSQ-planes. ... 66
Table 4.11. Analysis of Short Ring-Interactions ... 66
Table 4.12. Hydrogen-bond geometry (Å, °) of compound (II) ... 67
Table 4.13. Fractional atomic coordinates and isotropic or equivalent isotropic displacement parameters (Å2) of compound (II) ... 72
Table 4.14. Atomic displacement parameters (Å2) of compound (II) ... 75
Table 4.15. Atomic bond lengths (Å) of compound (II) ... 77
VII
Figure 3.1. Chemical scheme of C30H31Cl2N3O2Pd ... 7
Figure 3.2. Chemical scheme of C37H54Cl2N2Ru ... 8
Figure 3.3. A single crystal ... 10
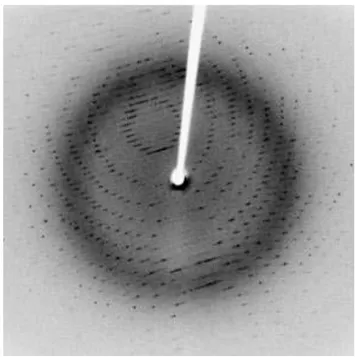
Figure 3.4. An example of a diffraction pattern. The particular position and symmetry of the spots is illustrated in addition to the varying intensities of the spots. ... 13
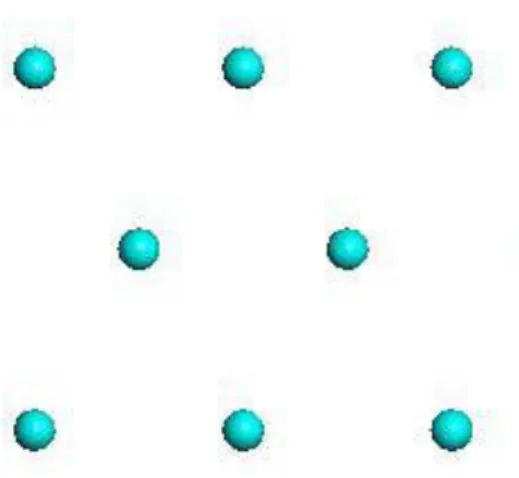
Figure 3.5. Demonstration of the crystal lattice, created by representing the constituent units with points ... 14
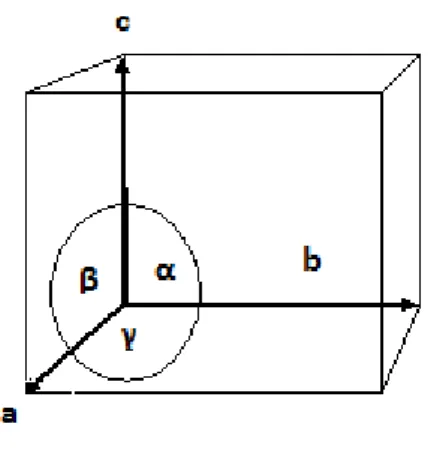
Figure 3.6. An example of a unit cell with the axes and angles labelled. ... 15
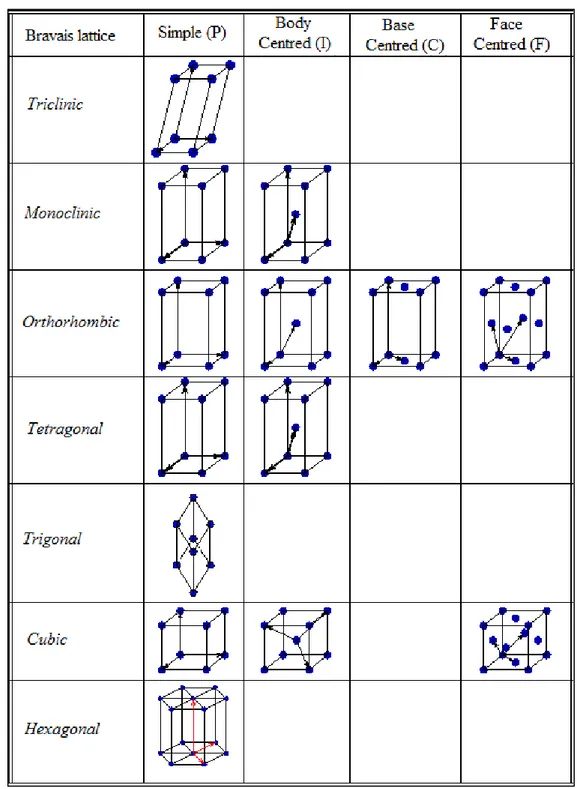
Figure 3.7. The fourteen Bravais lattices with the lattice points displayed. ... 17
Figure 3.8. The effect a 21 screw axis has upon a particular point... 19
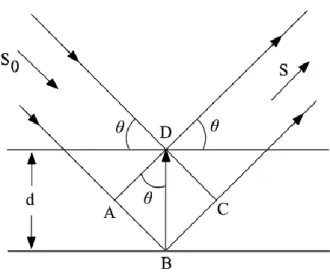
Figure 3.9. An X-ray beam makes angle θ with a set of planes with inter planar spacing d. For constructive interference n 𝝀 = 2dsinθ. ... 21
Figure 3.10. A pictorial representation of the 111 Miller plane. ... 22
Figure 3.11. A pictorial representation of the 010 Miller plane. ... 22
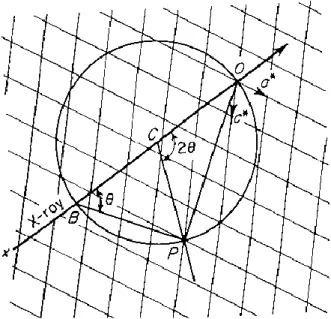
Figure 3.12. Diffraction in belongs to the reciprocal lattice. ... 23
Figure 3.13. Axial components of the point x,y,z ... 25
Figure 3.14. Schematic diagram for application of X-rays in modern science and technology ... 27
Figure 3.15. Emission of Kα and Kβ. ... 28
VIII
ray solutions- APEXII user manual version 1.22) ... 34
Figure 3.18. Schematic illustrating set-up for a single crystal X-ray diffraction experiment. ... 37
Figure 3.19. some components of SMART APEX system ... 39
Figure 3.20. A crystal mounted on the tip using epoxy. Pictures via a high magnification video camera present on the diffractometer. ... 41
Figure 4.1. Molecular structure of Compound (I) (Dichloro-[1,3-bis-(2-etoksibenzil)benzimidazole-2-yliden] pyridine palladium (II)) (ORTEP diagram) ... 50
Figure 4.2. Geometric Coordinate of the palladium atom ... 51
Figure 4.3. Intramolecular hydrogen bonds (dashed lines) of compound (I) ... 56
Figure 4.4. Unit Cell packing of compound (I) at (100) ... 57
Figure 4.5. Unit Cell packing of compound (I) at (010) ... 58
Figure 4.6. Unit Cell packing of compound (I) at (001) ... 59
Figure 4.7. Molecular structure of of Dichloro-[1,3-bis-(2-etoksibenzil)benzimidazole-2-yliden] pyridine palladium (II) (ORTEP diagram) ... 64
Figure 4.8. Geometric Coordinate of the ruthenium atom ... 65
Figure 4.9. Intramolecular hydrogen bonds (dashed lines) compound (II) ... 68
Figure 4.10. Unit Cell packing of compound (II) at (100) ... 69
Figure 4.11. Unit Cell packing of compound (II) at (010) ... 70
IX Symbols Definition α Alpha β Beta γ Gamma Å Ångstrom I Body centred C C centred ° Degrees F Face centred K Kelvin 3D Three dimensional XRD X-ray Diffraction CCD Charge-Coupled Device
CCDC Cambridge Crystallographic Data Center
CIF Crystallographic Information File
Goof Goodness of Fit
IP Image Plate area detector
ORTEP Oak Ridge Thermal Ellipsoids Plot
Rint Internal Reliability Index
RCM Ring-Closing Metathesis reaction
X
SMART Siemens Molecular Analysis Research Tool
wR weighted Reliability Index
hkl Miller Indices (hkl) mm Millimetre Mol Moles Nm Nanometre h Planck Constant P Primitive R1 R-factor σ Sigma fj Structure factor i.e. That is θ Theta V Volume λ Wavelength wR2 Weighted R-factor
1 1. INTRODUCTION
The technology of X-ray has developed into one of the most notable methods of structural analysis during the past century, as evidenced by how its discovery and enhancements play an important role in daily living. Versatility is an attribute of X-ray technology, offering widespread use in many areas. It is beneficial not only to the scientist, but also to health professionals and law enforcement officers. More importantly, the chemical structure determination of various molecules is indispensable to both physicists and chemists in an effort to gain insight into chemical problems. A few physical methods are utilized to determine material structures, and amongst these methods, X-ray diffraction techniques have been the most successful.
When the German physicist Wilhelm Röntgen discovered the X-ray in 1895, was speedily followed by the demonstration by von Laue of diffraction of X-rays by crystals (Friedrich et all., 1952). With the addition of W.L. Bragg’s diffraction theory in 1912, this non-destructive analytical technique has become extremely successful since it is one of few “fingerprinting” methods that can be used to accurately characterize both the identity and amount of compounds found in any crystalline system.
It is known that any material which is consisted of an ordered array of atoms will give a diffraction pattern. The three-dimensional structure determinations of compounds are most easily achieved by single-crystal X-ray diffraction. Single-crystal X-ray diffraction analysis method differs from other diffraction methods because the measurement of the diffraction pattern in this method is produced when the single crystal sample is oriented. The scattering of x-rays at long range ordered periodic systems is in general called x-ray diffraction. These systems are typically crystals. The scattering at these periodic structures cause constructive and destructive interference of the scattered waves resulting in spots of very high intensity. These spots are called Bragg peaks or Bragg reflections. The diffraction pattern produced depends on the current atoms, their locations, and thermal motion. Newer experiments use an X-ray detector based on the charge coupled device (CCD) camera technology, and the diffraction pattern from a single crystal yields a three dimension intensity distribution that appears as a series of “spots” in the detector image. From Fourier series analysis
2
and least-squares refinement of the intensities of the spots allows us accurate determination of the chemical identity and molecular structure of the sample.
In principle an X-ray diffraction analysis can be performed in any kind of material. Nevertheless in most of the cases the materials are solid samples. Only in some quite specific applications the samples are liquid and in very special cases gases. Furthermore in single crystal X-ray diffraction, as an additional distinction, the size of the single crystal should be small, preferably in the range about 0.1 to 0.2 mm (Klug et al., 1974). X-ray crystallography is therefore the only one capable of providing detailed information on interatomic distances, bond angles, molecular architecture, absolute configuration, thermal vibration parameters, crystal packing, as well as possible order-disorder and/or non-stoichiometry from the same experiment (Lee et al., 1994)
The X-ray structural analysis we will be provided with the information of the bond lengths, bond angles, conformation, coordination and other crystallographic information and details of the molecular structure of the Dichloro-[1,3-bis-(2-etoksibenzil)benzimidazole-2-yliden]pyridine palladium (II) and Dichloro-[1-(2,3,4,5,6-pentametilbenzil)-3-(2,3,5,6 tetramethyl) benzimidazole-2-yliden]Ruthenium (II)
The determination of a crystal structure normally proceeds in three stages. The first is the measurement of the intensities of the Bragg reflections and the calculation from them of amplitudes (observed structure factors), reduced to a common scale and corrected for various geometrical and physical factors, and observed structure amplitudes calculated. The second stage is solving the phase problem of X-ray diffraction, the problem that only the intensities of the diffraction pattern are recorded, whereas the phases of the reflections cannot be measured directly (the phase information is lost). We must therefore find a way to assign initial, approximation phases (solve the structure). For small molecules, for example, the structures can be solved in this thesis by so- called ‘direct methods’ using the SHELX-97 program. The third stage involves refining the approximate atomic positions in order to obtain the best possible agreement between the observed structure factors and the calculated structure factors.
3 2. LITERATURE SUMMARY
Crystallography is the most unambiguous method for determining structure of small molecules and macromolecules, and single crystal X-ray diffraction provides accurate and precise measurements of molecular dimensions.
The study reported in this thesis is an X-ray crystallography work. The most effective method to analyse crystal structure is the single-crystal X-ray diffraction method. According to this principle, the molecular and crystal structure of Dichloro[1,3-bis-(2-ethoxybenzyl)benzimidazole-2-ylidene] pyridine palladium(II), and Dichloro -[1-(2,3,4,5,6-pentametilbenzil)-3-(2,3,5,6tetrametil) benzimidazol-2-ylidene]Ruthenium(II) are reported in this study the synthesis. In structure refinements and solutions; the intensity data collected on the Bruker Smart ApexII diffractometer.
The molecular and crystal structure of samples are refined and solved by WinGX package program.
The first small molecule was crystallised in the tetragonal space group P41212.
The second small molecule was crystallised in the monoclinic space group P21/n. The
structure was solved with an R factor of 0.0697. In addition the crystal packing of two small molecules was analysed. The implications of the determined crystal structures are discussed in terms of the relevant literature in each case.
The results of X-ray structure analyses of two such complexes, namely, Bis(acetato-O)bis(pyridine-N)palladium(II) Monohydrate and Bis(acetato-O)bis-(diethylamine-N)palladium(II) was reported by SVETLANA V. et all., (1996) they found in both title complexes, the Pd atom has square planar coordination. Also they found the Pd-N bond is longer in Bis(acetato-O)bis-(diethylamine-N)palladium(II) 2.066(2) Å than in Bis(acetato-O)bis(pyridine-N)palladium(II) 2.010(4) Å.
Cheng et all., (2002) reported Dichloro[2,2’-hydroxy(ethoxy)methylene-dipyridine-k2N,N’]palladium(II). They found that in this complex the central Pd(II) atom is bonded to two pyridine N atoms and two terminal Cl atoms and the coordination geometry of the Pd atom is square planar with a slight tetrahedral distortion. The two
4
Pd-N distances calculated as 2.029(3) and 2.057(3) Å, and the N-Pd-N angle is 86.56(13)°. Also, the two Pd-Cl distances calculated as 2.2929(11) and 2.2959(11) Å, and the Cl-Pd-Cl angle is 90.84(5)°.
Also Hsueh et all., (2006) reported Dichloro{(E)-2,4,6-trimethyl-N-[1-(2-pyridyl)-ethylidene]aniline-k2N,N’}palladium(II) acetonitrile solvate. They solve molecular and crystal structure of this compound and found that the Pd atom has square planar coordination by two N and two Cl atoms and crystal packing is stabilized by C-H…Cl interactions. The two Pd-N distances calculated as 2.022(3) and 2.028(3) Å, and the N-Pd-N angle is 79.92(13)°. Also, the two Pd-Cl distances calculated as 2.2780(11) and 2.2916(11) Å, and the Cl-Pd-Cl angle is 90.37(5)°.
Ojwach et all. (2008) are reported synthesis, molecular structures, and activation of small molecules of (Pyrazol-1-ylmethyl)pyridine palladium complexes. They solve molecular and crystal structure of (Pyrazol-1-ylmethyl) pyridine palladium complexes. Pd-N and Pd-Cl bonds are calculated as 2.048(3) Å and 2.2802(10) Å’ respectively.
Preparation of the Pd(II) complexes containing 2-(4-R-1,2,3-triazol-1-yl)pyridine [R=C6H5 (1), NC5H4(2)] was described by Jindabot et all., (2013) in the report name Palladium(II) complexes featuring bidentate pyridine-triazole ligands: Synthesis, structures, and catalytic activities for Suzuki-Miyaura coupling reactions. They found both complexes crystallized in the P21/c space group. All non-hydrogen atoms were refined anisotropically while the hydrogen atoms were placed in calculated positions and not refined. However they found Crystal structures of 1 and 2 revealed a square planar geometry, Pd-N1, Pd-N2, Pd-Cl1 and Pd-Cl2 calculated as 2.054(5) Å, 2.014(5) Å, 2.271(2) Å and 2.274(2) Å’ respectively for complex (1) and 2.066(2) Å, 1.999(2) Å, 2.270(1) Å and 2.275(1) Å’ respectively for complex (2).
Çetinkaya et all., (1998) determined the crystal structure of complex Ru(II) by the X-ray diffraction in the report Ruthenium(II) complexes with 2,6-pyridyl-diimine ligands: synthesis, characterization and catalytic activity in epoxidation reactions. They found the Pd(II) atom has octahedral coordination.
5
Huxham et all., (2003) reported the synthesis, structural characterization, and in vitro anti-cancer activity of chloro(p-cymene) complexes of ruthenium(II) containing a disulfoxide ligand. The crystal structure of two complex R(II) [RuCl2(p-cymene)]2(m-BESE) and [RuCl(p-cymene)([RuCl2(p-cymene)]2(m-BESE)]PF6 was determined by X-ray crystallography.
The structure of two complexes was solved by direct methods and expanded used Fourier techniques; the H atoms was included at calculated positions, but not refined. They found the central Ru(II) atom is bonded to six C atoms, two Cl atoms and one S atom, the coordination geometry of the Ru(II) atom is square planar Pseudo tetrahedral coordinate.
Imhof et al., (2005) reported Tetrakis(tert-butyl isocyanide-2kC)dichloro-1kCl,3kCl-di-μ-cyano-1kN:2kC;2kC:3kN-bis[1,3(n4
)-cycloocta-1,5-diene]dirhodium(I)-ruthenium(II) They solve molecular and crystal structure of
[Rh2Ru(CN)2Cl2(C8H12)2(C5H9N)4]. They found the molecular structure of the Ru atom in a nearly ideal octahedral coordination geometry, whereas the Rh atoms are situated in square-planar ligand environments. The central ruthenium ion was located on a crystallographic twofold axis.
Chiririwa et all., (2011) reported Bis(acetonitrile-jN)dichlorido(g4-cycloocta-1,5-diene)ruthenium(II) acetonitrile monosolvate. They solve molecular and crystal structure of [RuCl2(C8H12)(C2H3N)2]. CH3CN, they found the coordination about the Ru(II) atom can thus be considered to be octahedral with a slightly trigonal distortion.
Lu et all., (2009) reported Synthesis, structure and catalytic activities for the hydrogen transfer reactions of the ruthenium(II) carbonyl chloride complexes with pyridine-2,6-diimine. They solve molecular and crystal structure of two Ru(II) carbonyl chloride complexes with pyridine-2,6-diimine, (L)Ru(CO)Cl2 (L=2,6-diacetylpyridinebis(2,4,6-trimethylanil), 1; L=2,6-diacetylpyridinebis(2,6-diisopropylanil), 2). The structure of two compound was determined by X-ray crystallography, which show the distorted octahedral geometry around Ru(II).
Brietzke et all., (2014) reported Crystal structure of (2,11-diaza[3.3](2,6)pyridinophane-k4N,N’,N’’,N’’’)(1,6,7,12-tetraazaperylen-k2N1,N12) ruthenium(II) bis(hexafluoridophosphate)acetonitrile 1.422-solvate . they solve crystal
6
structure of compound compound, [Ru(C14H16N4)(C16H8N4)](PF6)2.1.422CH3CN was used X-ray diffraction technology to this work, they found the Ru(II) atom was coordinated in a distorted octahedral geometry, particularly manifested by the Namine
-Ru-Namine angle of 153.79(10)°.
Ma et all., (2015) reported Ruthenium sensitizers with various 2-thiophenimidazo[4,5-f][1,10] phenanthroline based ancillary ligands and their performance for dye-sensitized solar cells. They solved molecular and crystal structure of three compounds C27H24Cl2N4RuS, C29H31BrCl2N4O2RuS and C28H31BrCl2N4O3RuS,
in each compounds found that the Ru(II) centre bonded to six C atoms, two N atoms and one Cl atom shows a pseudo-tetrahedral coordinate.
7 3. MATERIAL AND METHOD 3.1. Synthesis
The synthesis of our crystal which we refined and solved their molecular and crystal structure were synthesised by Dr. Sedat Yasar, his work group at the University of Inonu, Malatya, Turkey.
3.1.1. Synthesis of Single Crystal of
Dichloro-[1,3-bis-(2-etoksibenzil)benzimidazole-2-yliden] pyridine palladium (II)
The palladium-NHC complex was synthesized with method reported by Organ (O’Brien et all., 2006). In air, a pressure tube was charged with PdCl2 (87 mg, 0.5 mmol), NHC.HCl (0.55 mmol), and K2CO3 (345 mg, 2.5 mmol). 3 mL of pyridine was
added. The reaction mixture was heated with vigorous stirring for 10 h at 80 oC. The reaction mixture was then diluted with sufficiently dichloromethane (DCM) until the product was recovered. The DCM was evaporated, and the pyridine was vacuum-distilled. Residue solid was washed with hexane (2x10 mL) and diethyl ether (2x10 mL) and then dried in vacuo. Molecular structures of NHC–Pd–pyridine complexes were determined by NMR, LC-MS(ESI), IR and micro analyses. The chemical scheme of C30H31Cl2N3O2Pd can be seen in Figure 3.1.
8
3.1.2. Synthesis of Single Crystal of Dichloro -[1-(2,3,4,5,6-pentametilbenzil)-3-(2,3,5,6 tetramethyl) benzimidazole-2-yliden]Ruthenium (II)
1 salt ( 2.9 mmol), Cs2CO3 ( 2.9 mmol), [RuCl2(p-simen)]2 (1.45 mmol) and
molecular were vacuuming in elek schlenk at 100 oC. After that 30 mL of dry toluen was added, the reaction mixture was heated at 90 oC and after that It was heated for 4 h at 120 oC. Toluen was disposed at vacuum. CH2Cl2 was added over it and filtered.
After CH2Cl2 was added, claret red crystal was created. The chemical scheme of
C37H54Cl2N2Ru can be seen in Figure 3.2.
Figure 3.2. Chemical scheme of C37H54Cl2N2Ru
3.2. X-ray Crystallography
3.2.1. Basic Principles of X-ray Crystallography
Single-crystal X-ray diffraction, denoted to as X-ray crystallography, is a study of crystal structure by X-ray diffraction techniques. This causes to an understanding of the molecular and crystal structure of a substance. Because a single molecule does not have sufficient diffraction power, the regular arrangement of molecules in a crystal is a needful to reinforce scattering from one molecule by all others. Crystals are objects (molecules, atoms, and ions) coordinated in a regularly repeating pattern in three dimensions from smaller units, so-called ‘unit cells’. It generates the complete crystal by 3D translation along the unit cell axis.
9
The basis of X-ray crystallography is the interaction of matter in the crystalline case with X-rays. Since the wave-lengths of X-rays (in the nanometer range) are of the same domain of magnitude as of the interatomic distances within the crystal, the interaction results in the X-ray diffraction. This method can be used to determine the molecule crystal structure at atomic resolution: the composition of atoms, their relative orientation, and the chemical bonds between the atoms (both bond lengths and bond angles).
A simple analogy to help visualise the basic principles that underpin X-ray crystallography is that of a simple optical microscope. In both microscopy and crystallography it is useful to view radiation in terms of a travelling wave of energy as opposed to a particle (Eric Lifshin, 1999).
In the case of the optical microscope a light source provides visible light waves which pass through the sample under study and are subsequently diffracted. Each of these diffracted waves has a characteristic intensity and phase associated with it. These intensities and phases are then recombined by a lens in order to form an image.
As the name suggests X-ray crystallography utilises X-rays as opposed to visible light. They are used as they are easily accessible and possess wavelengths comparable to bond lengths allowing for visualisation down to the atomic level.
However the use of X-rays poses a problem – there is no known method capable of recombining the scattered X-rays and thus forming an image. The intensity of the diffracted waves can easily be determined by using an X-ray sensitive detector or photographic plate. Unfortunately the phase information of the waves has been lost. This is the physical basis of the phase problem that is inherently present within crystallography (Shafranovskii et al., 1962)
Instead a branch of mathematics known as Fourier series are used in place of a lens to recombine the scattered X-rays.
Technically the terms “scattered” and “diffracted” describe different wave-obstacle phenomenon. Scattering is results in the wave changing direction with no form of interference produced
10
In comparison diffraction wavelength results in a change of direction of the wave as well as the production of constructive and destructive interference. Therefore technically it is diffraction and not scattering that produces the patterns observed in crystallography (Woolfson et al., 1997).
3.2.2. Crystallinity
Crystalline materials consist of regular arrays of atoms, ions or molecules in three dimensions, with interatomic distances of approximately 1Å. In order for diffraction to occur, the wavelength of the incident light has to be of the same order of magnitude as the spacings of the diffraction grating (i.e. the crystal). Because of the periodic nature of their internal structures, crystals (figure 3.3) can act as a three dimensional diffraction grating to radiation of a suitable wavelength (X-rays), and the resulting diffraction pattern generated can be interpreted to give the internal positions of atoms within a crystal very accurately (L. Smart et al., 2001).
Figure 3.3. A single crystal
3.2.3. Historical Background of X-rays and Crystallography
X-ray technology has more than a hundred years of history and its discovery and development has revolutionized many areas of modern science and technology. X-rays were discovered by the German physicist Wilhelm Conrad Rontgen in 1895, who was honored with the Nobel Prize for Physics in 1901. In many languages today, X-rays are still referred to as Rontgen rays or Rontgen radiation. The mysterious light was found
11
that’s invisible to human eyes, but capable of penetrating opaque objects and exposing photographic films (S. P. Timoshenko et al., 1970). The density contrast of the object is disclosed on the developed film as a radiograph. Since then, X-rays have been developed for medical imaging, for example, for detection of bony structures and diseases in soft tissues such as pneumonia and lung cancer. X-rays have also been used to treat diseases. Radiotherapy employs high-energy X-rays to generate a curative medical intervention to the cancer tissues. A modern technology, tomotherapy, combines the precision of a computerized tomography scan with the potency of radiation treatment to selectively destroy cancerous tumors while minimizing harm to surrounding tissue. Today, medical diagnoses and treatments are still the most common use of X-ray technology. The phenomenon of X-ray diffraction by crystals was discovered in 1912 by Max Von Laue. The diffraction condition in a simple mathematical form, which is now known as the Bragg law, was formulated by Lawrence Bragg in the same year. The Nobel Prizes for Physics in two consecutive years (1914 and 1915) were awarded to von Laue and the senior and junior Bragg for the discovery and explanation of X-ray diffraction. X-ray diffraction techniques are based on elastic scattered X-rays from matter. Due to the wave nature of X-rays, the scattered X-rays from a sample can interfere with each other such that the intensity distribution is determined by the wavelength and the incident angle of the X-rays and the atomic arrangement of the sample structure, particularly the long-range order of crystalline structures.
The expression of the space distribution of the scattered X-rays is referred to as an X-ray diffraction pattern. The atomic level structure of the material can then be determined by analyzing the diffraction pattern. Over its hundred-year history of development, X-ray diffraction techniques have developed into many specialized fields.
Each has its specialized instruments, samples of interests, theory, and practice. Single crystal X-ray diffraction (SCD) is a technique used to solve the complete structure of crystalline materials, typically in the form of single crystals. The technique started with simple inorganic solids and grew into complex macromolecules. Protein structures were first determined by X-ray diffraction analysis by Max Perutz and Sir John Cowdery Kendrew in 1958 and both shared the 1962 Nobel Prize in Chemistry.
12
Today, protein crystallography is the dominant application of SCD. X-ray powder diffraction (XRPD), alternatively powder X-ray diffraction (PXRD), got its name from the technique of collecting X-ray diffraction patterns from packed powder samples. Generally, X-ray powder diffraction involves the characterization of the crystallographic structure, crystallite size, and orientation distribution in polycrystalline samples.
X-ray diffraction (XRD), by definition, covers single-crystal diffraction and powder diffraction as well as many X-ray diffraction techniques. However, it has been accepted as convention that SCD is distinguished from XRD. By this practice, XRD is commonly used to represent various X-ray diffraction applications other than SCD. These applications include phase identification, texture analysis, stress measurement, percent crystallinity, particle (grain) size, and thin film analysis. An analogous method to X-ray diffraction is small-angle X-ray scattering (SAXS) technique. SAXS measures scattering intensity at scattering angles within a few degrees from the incident angle. SAXS pattern reveals the material structures, typically particle size and shape, in the nanometres to micrometres range. In contrast to SAXS, other X-ray diffraction techniques are also referred to as wide-angle X-ray scattering (WAXS) (BOB, 2009).
3.2.4. Diffraction of X-ray by crystals
In theory a single molecule could be irradiated in order to produce a diffraction pattern. However in practice this would lead to an immeasurably weak pattern and rapid degradation of the molecule by the X-rays. Crystals are highly ordered structures which are composed of a regular arrangement of units (these units could be atoms, molecules or ions) that is repeated infinitely in three dimensions. Therefore instead of having one unit in a particular orientation there are now in effect an infinite number – this leads to “reinforcement” of the diffraction pattern and hence an averaged data set. In addition due to the huge amount of identical units radiation damage is usually negligible.
13
Figure 3.4. An example of a diffraction pattern. The particular position and symmetry of the spots is
illustrated in addition to the varying intensities of the spots.
To create diffraction pattern a crystal is bathed in a beam of X-rays. The regular arrangement of the atoms present in the crystal acts as a three dimensional diffraction grating. The incident X-rays interact with the electrons of the crystal via inelastic collisions which causes diffraction. The result is a pattern consisting of spots which possesses three important properties directly related to the crystal under study Figure 3.4.
The position, symmetry and intensity of the spots all hold information that must be extracted.
However, one diffraction pattern is not sufficient to allow for structure determination. This is because that only a small number of reflections will be excited at the particular angle of the stationary crystal. As a result the crystal must be slowly rotated (through small increments) whilst still fully immersed within the X-ray beam. In modern day diffractometers this a a fully automated, computer controlled process which results in the maximum number of reflections being recorded.
14
The X-rays most commonly used in “home” laboratory based experiments are monochromated MoKα (λ = 0.71Ǻ) and CuKα (λ = 1.54 Ǻ). These particular wavelengths are favoured as they are comparable with the distances under study. (E.g. C-C = 1.54 Ǻ). This helps to ensure appreciable diffraction occurs.
3.2.5. Crystal Structure and Symmetry
As a consequence of their highly ordered structure, crystals also display a high degree of symmetry. This symmetry is described by a number of different concepts which are subsequently defined.
As previously mentioned crystals are composed of a regular, repeating arrangement of units. If each of the constituent units was represented by a single point then the resulting array would be representative of the repeating nature of the crystal. This array of points (related to each other by translational symmetry) is known as the lattice of the crystal Figure 3.5.
Figure 3.5. Demonstration of the crystal lattice, created by representing the constituent units with points
An extension upon the theme of lattice points is the unit cell. A unit cell is a parallelogram consisting of four lattice points. Crystals are defined by their unit cells they describe the simplest “building block” that is repeated in three dimensions to produce the bulk crystal (Cullity, 1956). Each unit cell is defined in terms of lattice points. The lattice is the basic network of points on which the repeating unit (the contents of the unit cell) may be imagined to be laid down so that the regularly repeating structure of the crystal is obtained. Thus the lattice establishes the repeating pattern (Moore, 2008).
15
A unit cell is characterised by three vectors a, b and c which lie along the x, y and z directions respectively. Also of importance are the angles between these vectors – α alpha, β beta and γ gamma. Convention dictates that alpha is the angle between vectors b and c, beta is the angle between vectors a and c whilst gamma is the angle between a and b (Figure 3.6).
Figure 3.6. An example of a unit cell with the axes and angles labelled.
These vectors and the angles between them give rise to the seven crystal systems which are used to describe the geometry of the unit cell. Rotational and reflection symmetry place restrictions of the allowed vector lengths and angles. These restrictions allow for classification into seven groups – triclinic, monoclinic, orthorhombic, tetragonal, trigonal, hexagonal and cubic. The aforementioned restrictions are given in Table 3.1.
16
Table 3.1. The essential crystal symmetry and unit cell restrictions of the seven crystal systems.
Crystal system Unit cell restrictions Essential symmetry of
crystal
Triclinic None None
Monoclinic One diad axis (2 fold rotation) or
mirror plane (inverse diad axis)
𝑎 ≠ 𝑏 ≠ 𝑐 𝛽 ≠ 𝛼 = 𝛾 = 90°
Orthorhombic Three orthogonal diad axes or
inverse diad axes
𝑎 ≠ 𝑏 ≠ 𝑐 𝛼 = 𝛽 = 𝛾 = 90°
Tetragonal One tetra axis (four fold rotation)
or inverse tetrad axis
𝑎 = 𝑏 = 𝑐 𝛼 = 𝛽 = 𝛾 = 90°
Trigonal One triad (three fold rotation) axis
or inverse triad axis
𝑎 = 𝑏 = 𝑐 𝛼 = 𝛽 = 𝛾 ≠ 90°
Hexagonal One hexad (five fold rotation) axis
or inverse hexad axis
𝑎 = 𝑏 ≠ 𝑐 𝛼 = 𝛽 = 90°, 𝛾 = 120°
Cubic Four triad axes or inverse triad
axes
𝑎 = 𝑏 = 𝑐 𝛼 = 𝛽 = 𝛾 = 90°
Introducing translational symmetry into the seven crystal systems (which only include rotational and reflection symmetry) forms the Bravais (or space) lattices. There are 14 possible Bravais lattices which involve four different ways of centring the lattice points Figure 3.7. The possible lattice centrings are:
- Simple (Primitive) (P) – Lattice points are located at the corners of the unit cell. - Body Centred (I) – All primitive points included plus an additional point at the
centre of the unit cell.
- Base Centred (C) – All primitive points included plus an additional point at the centre of one face of the unit cell.
- Face Centred (F) – All primitive points included plus an additional points at the centre of each face of the unit cell.
17
18 3.2.6. Point Group
A point group is a mathematical descriptor for a group of symmetry operations that pass through a central point. These symmetry operations must leave at least one point unchanged and the appearance of the object unaltered.
There are four symmetry operations associated with point groups
1. n-fold rotation axes: a rotation through ( 360o/n ) which leaves the object
unaltered (where n is an integer).
2. Mirror planes: involves a reflection which takes place with respect to a mirror plane.
3. Inversions: involves moving every point x, y, z to -x, -y, -z. 4. Improper rotations: a rotation followed by an inversion.
Compared to the point groups for an isolated object (such as a single molecule) there are 230 possible crystallographic space groups. This is because there are 32 possible ways to combine the point group symmetry operations with the translational symmetry inherently present within crystals (crystallographic restriction theorem) (Molloy, 2004).
3.2.7. Space Groups
The combination of non-translational and translational symmetry elements combined with the fourteen Bravais lattices, generate 230 unique combinations of packing three-dimensional space known as space groups. These space groups are unequally distributed across the seven crystal systems, and determination of a space group from crystal data is achieved by looking at absences within the data.
Space groups describe the symmetry operations present in an infinitely repeating three dimensional pattern (crystals are as an approximation to infinite repeating structures). Therefore each space group is a combination of the point group symmetry operations with translational (or space) symmetry operations.
19
A typical example of space group is P 21/m –Where P is the type of Bravais
lattice – Primitive in this example.
The letters following the P represent the symmetry operations which lie along a special direction in the crystal. In this example 21 represents a 21 screw axis in the
direction of the unique axis of the monoclinic crystal system. The ‘/m’ represents an ordinary reflection plane which is perpendicular to the unique 21 axis.
The space groups and their associated symmetry operations are systematically detailed in the International Tables for Crystallography (Hahn, 1983).
In addition to the symmetry operations possessed by point groups there are two space symmetry operations which may be contained within space groups. These operations are termed glide planes and screw axes.
A screw axis is a combination of a rotation of (360/n) followed by an appropriate translation parallel to the axis of rotation to preserve the translational repetition (where n is an integer). For example a 21 screw axis consists of a twofold
rotation axis (360°/2) followed by a translation along half of the lattice axis that is parallel to the rotation Figure 3.8
Figure 3.8. The effect a 21 screw axis has upon a particular point (Max Perutz et al., 1996).
A glide plane is a combination of a reflection in a mirror plane followed by a translation. There are five possible glide planes – denoted a, b, c, n and d. For example a c glide plane consists of a reflection in the xy plane followed by a translation along half of the c axis (Helmer, 1994).
20
Screw axes and glide planes can cause the systematic absence of certain reflections in a diffraction pattern. These systematic absences can help in the assignment of space groups as the absences are well known and are listed in the International Tables for Crystallography (although space group ambiguities do exist), while space group diagrams provide information as to the position of all symmetry operators within a unit cell (W. Clegg, 2005).
3.2.8. Bragg’s Law
Shortly after the discovery of X-ray diffraction, William Henry Bragg and his son, William Lawrence Bragg, discovered that the geometry of the process is like to the reflection of light through a plane mirror (Bragg et all., 1983).. A consequence of the three-dimensional periodicity of a crystal structure is that perpendicular to certain directions it is possible to construct sets of many planes that are parallel with each other, equally spaced, and contain identical atomic arrangements. If an incident X-ray beam makes an angle θ with such a set of planes, the "reflected" beam also makes an angle θ with the planes, as in the case of optical reflection. It, of course, follows that the angle between the incident and reflected rays is 2θ.
Generally, the operation consists of the scattering of X-rays via the electron clouds surrounding the atoms of the crystal. The observed pattern is come from the constructive and destructive interference of the radiation scattered by all of the atoms, and the analogy to ordinary reflection is a result of the regularity of the atomic arrangement in a crystal.
Since there are large numbers of parallel planes involved in scattering X-rays, reflections from successive planes will interfere with each other, and there will be constructive interference only when the difference in path length between rays from successive planes is equal to a whole number of wavelengths. This is explained in Figure 3.7 where X-rays of wavelength λ are incident at angle θ on a set of planes with spacing d. and shows X-rays being diffracted from a series of parallel planes. In order for constructive interference, and hence diffraction to occur, the path difference (AB+BC) must equal an integral value of wavelengths (n) (W. Clegg et all., 2001).
21
Figure 3.9. An X-ray beam makes angle θ with a set of planes with inter planar spacing d. For
constructive interference n 𝝀 = 2dsinθ.
If 𝐴𝐵 + 𝐵𝐶 = 𝑛𝜆 .
Where n is some integer.
From elementary geometry
𝐴𝐵 = 𝐵𝐶 = 𝑑𝑠𝑖𝑛𝜃 Eq.(3.1)
Therefore,
2𝑑𝑠𝑖𝑛𝜃 = 𝑛 𝜆. Eq.(3.2)
And this is the well-known Bragg's law. Equation 3.2 provides no information other than that given by the Laue equations, but the interpretation of X-ray diffraction patterns is frequently easier in terms of Bragg's law since only one measured angle is required (Donald, 1975).
22 3.2.9. Miller Indices
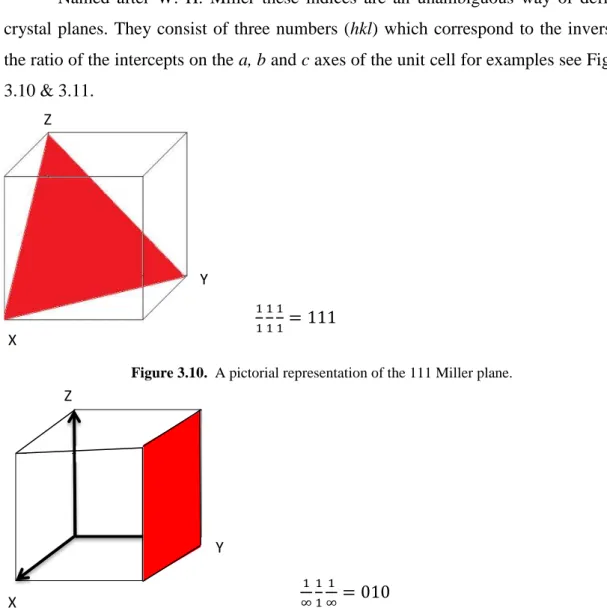
Named after W. H. Miller these indices are an unambiguous way of defining crystal planes. They consist of three numbers (hkl) which correspond to the inverse of the ratio of the intercepts on the a, b and c axes of the unit cell for examples see Figures 3.10 & 3.11.
111111= 111
Figure 3.10. A pictorial representation of the 111 Miller plane.
∞1 11∞1 = 010
Figure 3.11. A pictorial representation of the 010 Miller plane.
3.2.10. The Reciprocal Lattice and Ewald Sphere
A single diffraction event (reflection) occurs when an entire set of parallel planes constructively interfere to creat the diffracted X-ray beam. The use of constructs such as the reciprocal lattice and Ewald sphere aid in determining geometrically where the reflections will happen and satisfy Bragg’s equation. The reciprocal lattice is related to the real crystal lattice axes (𝑎,,) with axes a*, b*, c*, such that a*(a*=1/a) is perpendicular to 𝑏 and 𝑐, b* (b*=1/b) is perpendicular to 𝑎 and 𝑐, and c* (c*=1/c) is perpendicular to 𝑎 and 𝑏. Each reciprocal lattice point corresponds to a set of Miller
Z X Y Z X Y
23
indices, ℎ𝑘𝑙. Considering Bragg’s equation, the diffraction angle 𝜃 is inversely related to the interplanar spacing 𝑑ℎ𝑘𝑙. This means that large unit cells will create small angles of diffraction, resulting in many reflections at a convenient angle from the incident beam. The opposite is true for small unit cells, which will produce fewer reflections. P.P.Ewald developed a construction of geometrical to help visualize which Bragg planes are in the correct direction to diffract. Corresponding to the Figure 3.12, the Ewald sphere has a radius equal to 1/𝜆, with its center 𝐶. Points 𝑃,, and 𝑂 are on the sphere. As the crystal is rotated about point 𝑂, a reciprocal lattice point 𝑃 occurs in relate with the circle. As incident X-rays passes through the crystal (line 𝑋𝑂) at an angle 𝜃, the reflected X-ray diverges from point 𝐶 at angle 2𝜃 through point 𝑃101. The lines
𝑂𝑃 and 𝐵𝑃 are drawn; the length of 𝑂𝑃 (or 000 to 101) is 1/𝑑ℎ𝑘𝑙. The length of 𝑂𝐵 is 2/𝜆, the diameter of the sphere. The angle 𝐵𝑃𝑂 is equal to 𝑠𝑖𝑛𝜃.
𝑠𝑖𝑛 𝜃 = 𝑂𝑃/𝐵𝑂 = (1/𝑑ℎ𝑘𝑙)/(2/𝜆) Eq. (3.3)
Rearranged, this equation gives Bragg’s law. The Ewald Sphere and the reciprocal lattice show that when a reciprocal lattice point falls on the sphere, a reflection will occur, thus Bragg’s law is satisfied. Ewald’s sphere shows which ℎ𝑘𝑙 planes are in the proper orientation to diffract, and how each reciprocal lattice point must be arranged with respect to the X-ray beam.
24 3.2.11. The structure factor
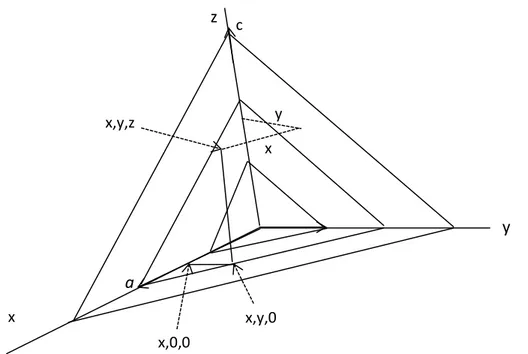
The structure factor is the resultant of N waves scattered in the direction of the reflection hkl by the n atoms in the unit cell. Each of these waves has an amplitude proportional to fj, the scattering factor of the atom and a phase σj with respect to the origin of the unit cell. Before the structure factor can be calculated, an expression for the phases in terms of the positions of the atoms and the indices of the reflection is needed. Such an expression can be derived by reference to Figure 3.11.
From the definition of the indices, the set of plane hkl cuts a into h, b into k, and
c into l divisions. Since there is a phase difference of one cycle (2л radius, or 360o) between reflections from successive planes of any given set hkl, it is clear that the phase difference for unit translations along the axes or along any lines parallel to these axes 2лh, 2лk, and 2лl radians, respectively. For a fraction of a unit translation the phase difference will be that fraction of the phase difference for a unit translation.
In Figure 3.13 it can be seen that the phase difference in radians between the two points 0,0,0 and x,y,z, for the set of planes hkl is the sum of the phase difference between the ends of vectors parallel to the axes and joining the two points. Thus if coordinates are expressed in fractions of a unit cell edge, the phase difference between 0 and x,0,0 is (2лh)x, that between x,0,0 and x,y,0 is (2лk)y, and that between x,y,0 and
x,y,z is (2лl)z. Hence the total phase difference in radians between the origin and the
point x,y,z is
25 a x,y,0 x,0,0 x,y,z c y x
Figure 3.13. Axial components of the point x,y,z
Since the scattering factor of an atom is given in terms of an equivalent number of electrons, the structure factor likewise measured in electrons. The value calculated for the structure factor is that number of electron which if scattering in phase would show the same diffracting power as the actual set of electrons distributed throughout the unit cell (Lipson, 1966).
To determine the structure factor in exponential form we need the following equation 𝑒𝑥 = 1 + 𝑥 +𝑥2 2! + 𝑥3 3! + ⋯ Eq. (3.5) cos 𝑥 = 1 −𝑥2!2+𝑥4!4− ⋯ Eq. (3.6) sin 𝑥 = 𝑥 −𝑥3!3+𝑥5!5+ ⋯ Eq. (3.7)
Substituting 𝑥 = 𝑖𝜎 in the expression for the exponential, Eq. (3.5), and multiplying both sides of the equation by f, we have
𝑓𝑒𝑖𝜎 = 𝑓 (1 + 𝑖𝜎 −𝜎2 2! − 𝜎3 3! + 𝜎4 4! + ⋯ ) Eq. (3.8) z y x
26 𝑓𝑒𝑖𝜎 = 𝑓 [1 −𝜎2 2! + 𝜎4 4! + ⋯ + 𝑖 (𝜎 − 𝜎3 3! + 𝜎5 5! − ⋯ )] Eq. (3.9)
Or 𝑓𝑒𝑖𝜎 = 𝑓(cos 𝜎 +𝑖 sin 𝜎) Eq. (3.10)
The right hand side of Eq. (3.10) is simply a complex number in polar form and represents a wave with amplitude f and phase angle σ. The left hand side of Eq. (3.10) is thus a compact representation for the structure factor:
𝐹 = ∑ 𝑓𝑗𝑒𝑖𝜎𝑗
𝑗 Eq. (3.11)
Where fj is, as previously, the scattering factor of the jth atom and σj phase with
respect to the origin of the unit cell. Substituting in Eq. (3.11) the phase difference as given in Eq. (3.4),
𝐹ℎ𝑘𝑙 = ∑ 𝑓𝑗𝑒2𝜋(ℎ𝑥𝑗+𝑘𝑦𝑗+𝑙𝑧𝑗) Eq. (3.12)
This is the exponential form of the structure factor (Mellor et al., 1955).
Equation (3.12) represents the structure factor in a way that gives direct access to the three coordinates in direct space and the three indices in reciprocal space. A more compact, if less explicit, notation takes the three indices as characterizing a reciprocal space vector h and the three coordinates as defining a direct space vector r. the dot product of these two vectors is defined as
𝒉 ∙ 𝒓 = ℎ𝑥 + 𝑘𝑦 + 𝑙𝑧 Eq. (3.13)
So Eq. (3.12) can be written as: 𝐹𝒉 = ∑ 𝐹𝑗𝑒2𝜋𝑖(𝒉∙𝒓) Eq. (3.14)
This notation can be carried on to trigonometric expressions as well. Thus,
𝐹𝒉 = ∑ 𝑓𝑗{cos 2𝜋(𝒉 ∙ 𝒓) + sin 2𝜋(𝒉 ∙ 𝒓)} Eq. (3.15) We shall use this form where compactness is more important than explicit reference to the individual vector components.
27 3.3. X-rays and X-ray Generator
3.3.1 X-rays
The diffraction of X-rays by crystals was first demonstrated by Walther Friedrich, Paul Knipping and Max von Laue; seventeen years after Wilhelm Konrad Röntgen X-rays discovered in 1895. From their experimental X-ray diffraction on a copper sulphate crystal, they concluded that X-rays are electromagnetic radiation with wave lengths of the order 10-8 cm (a unit of length equivalent to Angstrom unit, 1Å) (Martin, 2003). X-rays having wave length of more than about 2 Å are known as ‘soft’ X-rays. They are significantly absorbed through the air and strongly by water, and wave lengths of 0.2 Å or less are very penetrating. The range of wave lengths between about 0.5 Å and 1.6 Å is the most suitable for X–ray crystallography. These waves are sufficiently penetrating to study samples up to a millimetre or so in size, but are scattered strongly by matter (Blow et al., 2002). X-ray crystallography is used extensively nowadays in the elucidation of crystal and molecular structures, the wide application of X-rays is shown in Figure 3.14.
Figure 3.14. Schematic diagram for application of X-rays in modern science and technology (Lee et al.,
1994).
X-rays
Spectroscopy and spectrometry
Diffraction Medical an Industrial
Application
Small Molecules Macromolecules
Partial Crystalline substances Single Crystal
Powders (e.g. metal and alloys)
28 3.3.2. Generation of X-rays
X-rays are a form of electromagnetic radiation which possess wavelengths within the range of 0.01 nm (0.1 Ǻ) to 10 nm (100 Ǻ) with wavelengths in the range 0.2 – 3 Ǻ being useful in crystallography they are produced when accelerated electrons while penetrating through the target material and moving through the orbital electron cloud of atoms of the target are rapidly decelerated by the resistive force. Due to this deceleration of the bombarding electrons, their energy is emitted in the form of X-ray. This spectrum of X-ray radiation continuously varies in intensity from a lowest wavelength value known as short-wavelength limit. This radiation spectrum named as continuous or general radiation. When the accelerating potential for the bombarding electrons is increased, then these bombarding even after being decelerated still possess sufficient energy to knock off electrons from different orbits of the target atoms. When K-shell electrons are knocked off, then the target atoms are raised up to a potential energy corresponding to the K-shell. The electrons from the higher energy levels like L-shell or M-L-shell then jump down to the K-L-shell to fill up the vacancy and lower down the potential energy of the target atoms. These processes emit radiation of specific wavelengths which are characteristic of the target atom as they depend on the atomic number (Z) of the atoms of the target. These radiations being dependent on the atomic number are named as characteristic radiation (Sanat, 2008).
Figure 3.15. Emission of Kα and Kβ.
X-ray consists of an electric field and magnetic field vector which are perpendicular to each other. These vectors oscillate in a sinusoidal manner perpendicular to the direction of propagation. Thus X-rays are the favoured form of
29
radiation in crystallography as they possess wavelengths comparable to bond lengths and can also be easily generated in a “home” laboratory setting. A more recent method of generating much more intense and finely tuneable X-rays using a synchrotron source is also now widely used.
Figure 3.16. A schematic diagram of an X-ray tube (L.J. Poppe et al., 2001)
In Figure 3.16 the X-ray tubes used in modern day crystallography are known as filament (or Coolidge) tubes and date back to 1913. They consist of an evacuated glass enclosure which contains a tungsten filament and a disk of a target metal thats responsible for the production of the characteristic wavelength of the X-rays. The most commonly used target metals are Molybdenum (wavelength = 0.71 Ǻ), Copper (1.54 Ǻ) and Silver (0.56 Ǻ).
To initiate the production of X-rays the tungsten filament is heated by passing an electric current through it. This results in the production of electrons which are accelerated by a potential difference and directed towards the target metal. If the potential difference is sufficiently high (typically 50kV) the electrons will possess enough energy to cause ionisation of inner core electron’s of the target metal. To compensate an electron in a higher atomic energy level for the metal will drop in energy to take the place of the ejected electron. This results in the emission of a photon with a characteristic wavelength. The characteristic wavelength produced is dependent upon the metal atom energy levels from which each electron is ejected. For example MoKα
30
Molybdenum whilst MoKβ emission corresponds to a movement between the L and K
shells (λ = 0.63λ).
This characteristic wavelength created is defined by Equation (3.16).
λ =
ℎ𝑐𝐸1−𝐸2 Eq(3.16)
Where :
- h= Planck constant (6.6261 x 10⁻³⁴ J s) - c = Speed of light (2.9989 x 10⁸ m/s) - E1 = Lower energy level of target atom - E2 = Higher energy level of target atom
The spectra purity of the X-ray beam onto the crystal is created by using filters to remove background and other unwanted wavelengths whilst a beryllium window allows the X-rays to leave the tube head with minimum absorption.
This method of X-ray production can be considered quite inefficient as the vast majority of the energy carried by the electrons is converted into heat rather than X-rays (literature sources mention 1% X-ray conversion8). The heating of the target is largely compensated by a water cooling system which prevents melting of the target material up to certain current limits. An additional disadvantage of this method is that the X-rays generated are quite divergent which may pose a problem if small crystals are under study.
An improved method of generating X-rays in the home laboratory is known as a rotating anode. In this apparatus the target metal is cylindrical and is spun about its axis. This allows the energy of the X-rays to be spread out over a larger overall area thereby reducing the heating problem. As a result much higher electrical currents can be introduced which creates a much higher flux density. This method of X-ray generation is important especially for molecules which possess large unit cells such as proteins which are often in large complexes.
31 3.3.3. Synchrotron source X-ray generation
Synchrotrons were initially developed as a tool in particle physics to accelerate beta particles (electrons and positrons). It is observed that when such particles are accelerated through magnetic fields at relativistic speeds they lose energy in the form of electromagnetic radiation (this radiation covers the entire EM spectrum not just X-rays).
When the beta particles pass through the magnetic fields they change direction. This causes the tangential emission of radiation. Although emission of radiation occurs at non relativistic speeds, a feature of relativity known as the Lorentz transformation means that the radiation is emitted in a highly collimated fashion at speeds approaching that of the speed of light. This emission of radiation was first observed in 1946 at a 70MeV synchrotron in Schenectady by F. R. Elder et al (Elder et al., 1947). Today many synchrotron sources are now operational as nationally and internationally shared facilities.
Synchrotrons consist of a linear accelerator (LINAC) which creates high energy electrons (around 10MeV). These electrons are subsequently injected into a small accelerator (known as a booster synchrotron) which increases the energy of the electrons to around 500MeV. Once this point has been reached the electrons are injected into the main synchrotron ring where the energy is further increased via multiple passes through radio frequency cavities. This produces X-rays which extends to the necessary short wavelengths and are much more intense and well collimated than laboratory based sources. This allows for extremely fast data collection times and smaller crystals to be studied. The continuous spectrum allows for the fine tuning of the selected wavelengths using monochromators. Alternatively the whole ‘white’ X-ray spectrum may be used in Laue diffraction experiments
3.3.4. X-ray Detectors
The diffracted beams intensities are measured by intercepting the beams with something which has a sensitivity to X-rays. X-ray detectors respond to the energy of the diffracted beam, called intensity, which (at a given wave length) is proportional to the number of photons it delivers. Nowadays the diffracted spots are usually recorded
32
on image plates rather than on X-ray films, the classical method, or by an electronic detector. Electronic areas detectors feed the signals they detect directly in a digitized form into a computer, hence its name. Various forms of X-ray detectors can be available; some may count single photons, some providing only measurements of count rate or total flux, others measuring the energy, position, and incidence time of each X-ray. Among the numerous types of area detectors which are currently used, we shall concentrate on the two most popular types namely:
The charge-coupled devices (CCD)
The image plate (IP).
These two types of device fulfil some of the most important requirements for X-ray area detectors, such as high detective quantum efficiency (DQE), wide dynamic range, linearity of response, high spatial resolution, large active area, uniformity of response, and high count-rate capability.
The IP is a plastic plate, possibly flexible, which is coated with small crystals of photo-stimulable phosphors embedded in an organic binder. The photo-stimulable phosphor stores a fraction of the absorbed X-ray energy. In a second step, when the IP is activated by visible light, it emits photo-stimulated luminescence (PSL) which is proportional to the absorbed X-ray intensity. The PSL is then collected by high-quantum-efficiency photomultiplier tube (PMT) and converted to a digital image which can be further processed. The residual image on the IP can be completely erased by illumination with visible light in order to be ready for the next measurement.
The DQE, defined as the square of signal-to-noise ratio of the input over the square of the signal-to-noise ratio of the output, exhibits excellent performance in comparison with any other detectors. The dynamic range of the IP is of the order of 1:105 s. The amplitude of the IP signal per X-ray photon depends on the energy of the X-ray photon. Therefore, when different energies of X-rays are recorded in the IP, in Laue diffraction for example, the IP must be calibrated (Ted Janssen et al., 2007).
The CCD is another type of area detector which has been widely accepted as detectors for collecting X-ray diffraction images for both macromolecules and