Dergi web sayfası:
www.agri.ankara.edu.tr/dergi www.agri.ankara.edu.tr/journalJournal homepage:
TARIM BİLİMLERİ DERGİSİ
—
JOURNAL OF AGRICUL
TURAL SCIENCES
22 (2016) 377-384
Assessment of Inverse Distance Weighting (IDW) Interpolation on
Spatial Variability of Selected Soil Properties in the Cukurova Plain
Tülay TUNÇAYa, İlhami BAYRAMİNb, Fırat ATALAYc, İlhami ÜNVERbaSoil, Fertilizer and Water Resources Center Research Institute, Ankara, TURKEY
bAnkara University, Faculty of Agriculture, Department of Soil Science and Plant Nutrition, Ankara, TURKEY cHacettepe University, Faculty of Engineering, Department of Mining Engineering, Ankara, TURKEY
ARTICLE INFO
Research Article
Corresponding Author: Tülay TUNÇAY, E-mail: [email protected], Tel: +90 (312) 315 65 60 Received: 03 November 2014, Received in Revised Form: 18 August 2015, Accepted: 18 August 2015
ABSTRACT
This study attempts to evaluate interpolation technique for mapping spatial distribution of some soil characteristics at the Lower Seyhan River Basin in Cukurova (Turkey). These soil characteristics may help to improve agricultural land management practices. In the study area, 7 parallel transects each having 150 m of length were selected at 5 m intervals, and 104 soil samples were collected. In these samples, calcium carbonate, organic matter, cation exchange capacity and clay content (from particle size distribution) were determined. Inverse distance weighting (IDW) interpolation and employing of GIS technology were applied on the results. Calcium carbonate, organic matter, cation exchange capacity and clay content values derived from IDW interpolation were consistent with the results of the soil analysis. The verity of the interpolation technique was tested by employing cross validation. Interpolation of organic matter values showed a high mean error in 30-60 cm depth (2.82%) while this high deviation was not the case with the other parameters studied.
Keywords: Geographic information systems; Geostatistic; Inverse distance weighing; Cukurova (Turkey); Spatial variability
Ağırlıklı Ters Uzaklık İnterpolasyon Yöntemiyle Çukurova’da Kimi
Toprak Karakteristiklerinin Konumsal Dağılımının Tahmini
ESER BİLGİSİ
Araştırma Makalesi
Sorumlu Yazar: Tülay TUNÇAY, E-posta: [email protected], Tel: +90 (312) 315 65 60 Geliş Tarihi: 03 Kasım 2014, Düzeltmelerin Gelişi: 18 Ağustos 2015, Kabul: 18 Ağustos 2015
ÖZET
Bu çalışmada Çukurova Aşağı Seyhan Nehir Havzasındaki kimi toprak karakteristiklerinin konumsal dağılımının belirlenmesi için interpolasyon yöntemi kullanılmıştır. Bu toprak karakteristikleri tarımsal arazi yönetimini geliştirmede katkı sağlamaktadır. Çalışma alanında 150 m uzunluğa sahip, 5 m aralık ile 7 paralel transect seçilerek ve 104 adet toprak örneği alınmış ve bu örneklerde kalsiyum karbonat, organik madde, katyon değişim kapasitesi ve kil (tane büyüklüğü
Assessment of Inverse Distance Weighting (IDW) Interpolation on Spatial Variability of Selected Soil Properties..., Tunçay et al
1. Introduction
It is known that precision farming or site-specific management aims to improve production efficiency within the field for agricultural planning and policy making both in regional and national levels. Geospatial measurements consist of spatial characterization of soil variability including calcium carbonate content, particle size distribution (Piikki et al 2013), cation exchange capacity and organic matter content (Frogbrook & Oliver 2001) which have recently become more useful and therefore gained particular interest. Soil properties may vary greatly depending on parent material, topography, vegetation cover and climate. These all factors affect the spatial distribution of the soil properties (Shi et al 2009). Namely, critical important relationship between the yield and soil properties and topographic characteristics for precision agriculture was reported (Drummond et al 2003). Dengiz (2010) reported that alluvial soils, formed by rivers as accumulated sediment deposited at different times, showed large variation in their properties over short distances. Geospatial measurement of some soil properties has become one of the most useful tools for rational agricultural practices (Corwin 2005). There have been a number of conflicting reports on the use of statistics to predict interpolation methods and their parameters as well. For example, Mabit & Bernard (2010), studied spatial distribution and content of soil organic matter (SOM) in an agricultural field in eastern Canada using ordinary kriging and inverse distance weighting power two. Gotway et al (1996) obtained better results when using inverse distance weighting (IDW) than kriging for soil organic matter and nitrogen contents distribution.
Cross validation method was employed in this study using the Pronet software program. Given the variability of the results obtained by the previous studies mentioned, in this study it is aimed to identify the spatial variability of various soil parameters at the study area and to evaluate the accuracy of IDW interpolation for determining the values related to these parameters because of the inadequate sample points available around the study area. It is supposed that this would enable the identification of the areas where remediation is required for improving the crop growth, and for applying appropriate land management processes.
2. Material and Methods
2.1. Description of the study areaThis study was carried out at Lower Seyhan Basin, an alluvial plain of southern Turkey. The study area included 104 ha of irrigated agricultural land which was located within a multi-directional drainage system (WGS84; E 679312-681014, N 4079399-4081100) (Figure 1). Detailed information about study area and its climate characteristics was clearly described in Tunçay et al (2013). Seven parallel transects each having 150 m of length were designated at 5 m intervals within the study area. In total, 104 soil samples were collected at different soil horizons from 24 different points (as being 0, 50, 100 and 150 m in the 1st, 3rd, 5th and 7th transects; at 25, 75 and 125 m in the 2nd and 6th transects; and at 50 and 100 m in the 4th transect) (Tunçay et al 2013).
dağılımından) belirlemesi yapılmıştır. Sonuçlara ağırlıklı ters uzaklık interpolasyon yöntemi (ATU) ve CBS teknolojisi uygulanmıştır. ATU interpolasyon yönteminden elde edilen kalsiyum karbonat, organik madde, katyon değişim kapasitesi ve kil değerleri ile toprak analiz sonuçları benzerlik göstermiştir. İnterpolasyon tekniğinin doğruluğunu belirlemek için çapraz doğrulama yapılmıştır. Organik madde değerlerinin 30-60 cm derinliğindeki interpolasyonu, en yüksek ortalama değişim değeri (% 2.82) göstermiş, diğer parametrelerde bu durum gözlenmemiştir.
Anahtar Kelimeler: Coğrafi bilgi sistemleri; Jeoistatistik; Ağırlıklı ters uzaklık; Çukurova (Türkiye); Konumsal değişkenlik
Ağırlıklı Ters Uzaklık İnterpolasyon Yöntemiyle Çukurova’da Kimi Toprak Karakteristiklerinin Konumsal..., Tunçay et al
Figure 1- The research area
Şekil 1- Araştırma alanı
2.2. Sampling design, soil analysis and spatial prediction methods
The study area is accommodated on an alluvial plain, and it is conspicuous that the soil properties may vastly display significant spatial variability in short distances at alluvial soils. Soil samples from each horizon were individually taken, air dried, crushed and sieved (2 mm). Particle size distribution was determined by using hydrometer method (Sheldrick & Wang 1993), calcium carbonate (CaCO3) by Sheibler calcimeter (Çağlar 1949), organic matter (OM) by Walkey Black method (Richards 1954), cation exchange capacity (CEC) by using NH4OAc (pH 7.0) and NaOAc (pH 8.2) (Rhoades 1982). IDW via using the GemcomSurpac 3D software program was used for evaluating the results. For each sample point, soil samples were carried to a depth of 150 cm and employed for availing five different depths (from 30 to 150 cm) of soil layer maps for each individual
property and parameter p (p; 2). The accuracy of IDW is established on the number of definite samples those were employed for estimation. The allocation of close sample locations were fixed at 24, and each soil sample point was evaluated with 4-5 soil horizons, determined by the soil profile properties within the context of this research. The interpolation procedures are abundant in the literature (Franzen & Peck 1995; Gotway et al 1996). Estimated values are interpolated based on the data from surrounding locations using Equation 1.
3
characteristics was clearly described in Tunçay et al (2013). Seven parallel transects
each having 150 m of length were designated at 5 m intervals within the study area. In
total, 104 soil samples were collected at different soil horizons from 24 different points
(as being 0, 50, 100 and 150 m in the 1st, 3rd, 5th and 7th transects; at 25, 75 and 125 m
in the 2nd and 6th transects; and at 50 and 100 m in the 4th transect) (Tunçay et al 2013).
Figure 1- The research area
Şekil 1- Araştırma alanı
2.2. Sampling design, soil analysis and spatial prediction methods
The study area is accommodated on an alluvial plain, and it is conspicuous that the soil properties may vastly display significant spatial variability in short distances at alluvial soils. Soil samples from each horizon were individually taken, air dried, crushed and sieved (2 mm). Particle size distribution was determined by using hydrometer method
(Sheldrick & Wang 1993), calcium carbonate (CaCO3) by Sheibler calcimeter (Çağlar
1949), organic matter (OM) by Walkey Black method (Richards 1954), cation
exchange capacity (CEC) by using NH4OAc (pH 7.0) and NaOAc (pH 8.2) (Rhoades
1982). IDW via using the GemcomSurpac 3D software program was used for evaluating the results. For each sample point, soil samples were carried to a depth of 150 cm and employed for availing five different depths (from 30 to 150 cm) of soil layer maps for each individual property and parameter p (p; 2). The accuracy of IDW is established on the number of definite samples those were employed for estimation. The allocation of close sample locations were fixed at 24, and each soil sample point was evaluated with 4–5 soil horizons, determined by the soil profile properties within the context of this research. The interpolation procedures are abundant in the literature (Franzen & Peck 1995; Gotway et al 1996). Estimated values are interpolated based on the data from surrounding locations using Equation 1.
)
(
)
(
*
xo
1wi
Z
xi
Z
ni (1)Where;
wi
,
weight assigned to the value at each location; Z (χi) and n, number ofclose neighboring sampled data points used for estimation. Weights are established using Equation 2. n i p i p i
d
d
wi
1/
1
/
1
(2) (1) Where; 3total, 104 soil samples were collected at different soil horizons from 24 different points (as being 0, 50, 100 and 150 m in the 1st, 3rd, 5th and 7th transects; at 25, 75 and 125 m in the 2nd and 6th transects; and at 50 and 100 m in the 4th transect) (Tunçay et al 2013).
Figure 1- The research area Şekil 1- Araştırma alanı
2.2. Sampling design, soil analysis and spatial prediction methods
The study area is accommodated on an alluvial plain, and it is conspicuous that the soil properties may vastly display significant spatial variability in short distances at alluvial soils. Soil samples from each horizon were individually taken, air dried, crushed and sieved (2 mm). Particle size distribution was determined by using hydrometer method (Sheldrick & Wang 1993), calcium carbonate (CaCO3) by Sheibler calcimeter (Çağlar 1949), organic matter (OM) by Walkey Black method (Richards 1954), cation exchange capacity (CEC) by using NH4OAc (pH 7.0) and NaOAc (pH 8.2) (Rhoades 1982). IDW via using the GemcomSurpac 3D software program was used for evaluating the results. For each sample point, soil samples were carried to a depth of 150 cm and employed for availing five different depths (from 30 to 150 cm) of soil layer maps for each individual property and parameter p (p; 2). The accuracy of IDW is established on the number of definite samples those were employed for estimation. The allocation of close sample locations were fixed at 24, and each soil sample point was evaluated with 4–5 soil horizons, determined by the soil profile properties within the context of this research. The interpolation procedures are abundant in the literature (Franzen & Peck 1995; Gotway et al 1996). Estimated values are interpolated based on the data from surrounding locations using Equation 1.
) ( ) ( * xo 1wiZ xi Z ni (1)
Where;wi,weight assigned to the value at each location; Z (χi) and n, number of
close neighboring sampled data points used for estimation. Weights are established using Equation 2. n i p i p i d d wi 1 / 1 / 1 (2)
, weight assigned to the value at each location; Z (χi) and n, number of close neighboring sampled data points used for estimation. Weights are established using Equation 2.
3
each having 150 m of length were designated at 5 m intervals within the study area. In
total, 104 soil samples were collected at different soil horizons from 24 different points
(as being 0, 50, 100 and 150 m in the 1st, 3rd, 5th and 7th transects; at 25, 75 and 125 m
in the 2nd and 6th transects; and at 50 and 100 m in the 4th transect) (Tunçay et al 2013).
Figure 1- The research area
Şekil 1- Araştırma alanı
2.2. Sampling design, soil analysis and spatial prediction methods
The study area is accommodated on an alluvial plain, and it is conspicuous that the soil properties may vastly display significant spatial variability in short distances at alluvial soils. Soil samples from each horizon were individually taken, air dried, crushed and sieved (2 mm). Particle size distribution was determined by using hydrometer method
(Sheldrick & Wang 1993), calcium carbonate (CaCO3) by Sheibler calcimeter (Çağlar
1949), organic matter (OM) by Walkey Black method (Richards 1954), cation
exchange capacity (CEC) by using NH4OAc (pH 7.0) and NaOAc (pH 8.2) (Rhoades
1982). IDW via using the GemcomSurpac 3D software program was used for evaluating the results. For each sample point, soil samples were carried to a depth of 150 cm and employed for availing five different depths (from 30 to 150 cm) of soil layer maps for each individual property and parameter p (p; 2). The accuracy of IDW is established on the number of definite samples those were employed for estimation. The allocation of close sample locations were fixed at 24, and each soil sample point was evaluated with 4–5 soil horizons, determined by the soil profile properties within the context of this research. The interpolation procedures are abundant in the literature (Franzen & Peck 1995; Gotway et al 1996). Estimated values are interpolated based on the data from surrounding locations using Equation 1.
)
(
)
(
*
xo
1wi
Z
xi
Z
ni (1)Where;
wi
,
weight assigned to the value at each location; Z (χi) and n, number ofclose neighboring sampled data points used for estimation. Weights are established using Equation 2. n i p i p i
d
d
wi
1/
1
/
1
(2) (2)Where; di, denotes the distance between point i and the unknown point; p, exponent parameter. Weighting is remarkably dependent on p, such that, an increase in distance would cause an exponential decrease in weighting. In this study, a power of 2 and a skewness value of <1 was employed in IDW (Agris 1998).
3. Results and Discussion
3.1. Descriptive statistics result of the soil
properties
Soil analysis revealed that the clay content of the study area ranged between 41.2-84.4% and increased with increasing depth. Organic matter content ranged between 0.11-2.76% (Table 1). Table 1- Descriptive statistics for selected soil properties
Çizelge 1- Seçilen toprak özelliklerinin tanımlayıcı istatistikleri
Variable Min Max Mean Median Skewness Kurtosis SD CV (%)
CaCO3 (%) 21.3 34.6 29.19 29.65 -0.33 -1.13 3.46 11.87
OM (%) 0.11 2.76 0.97 0.75 0.90 -0.14 0.62 64.30
CEC (meq 100 g-1) 21.8 45.2 35.10 35.42 -0.31 -0.33 4.66 13.28
Clay (%) 41.2 84.4 61.83 61.89 0.18 -0.05 8.89 14.39
Assessment of Inverse Distance Weighting (IDW) Interpolation on Spatial Variability of Selected Soil Properties..., Tunçay et al
3.2. Selected soil parameter related inverse distance weighting process, resulting maps and cross validation of the results
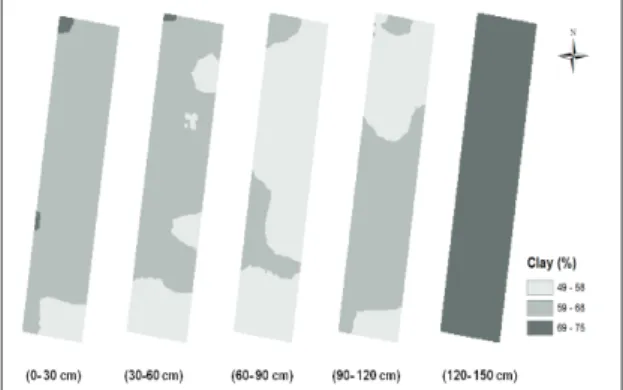
Organic matter content values revealed that the greatest variability of the different soil parameters analyzed had the ratio of 43.42% for the coefficient of variation. The mean overall clay content was 61.43% ranging between 49.1-75.9%. These conditions were attributed to the inferior drainage properties and high clay content, especially in the subsurface horizons that restricting the downward movement of water. Table 2 displays the descriptive statistics of the selected soil properties via using IDW method. As the sediment charges occupying the alluvial plain formed from materials carried by the Seyhan River and Tarsus Stream from Taurus Mountains that have calcareous parent material (Öner et al 2005; Atalay 2011), the content of free carbonates was found above 20% almost everywhere and every depth of the studied area. While the calcium carbonate calcium carbonate contents in the research area changed between 24.3-33.3%, it was higher than 28% at 60-90 and 90-120 cm depths (Figure 2). Due to the steady slow precipitation of the fine fluvial material at the rather flat soil surface, the clay content was always more than 49% in the studied area. While the organic matter content was barely below 1% in the surface soil, it was only between 0.2 and 0.9% after 60 cm depth (Figure 3). 3.3. Clay content (using particle size distribution) The particle size distribution suggested relatively narrow particle fractionation in the research area. Almost no coarse fraction was detected in the analyzed soil samples. In the top four layers (0-30, 30-60, 60-90 and 90-120 cm, respectively), clay
contents generally varied between 49-68%. The deepest layer (120-150 cm) contained between 68-75% clay mostly (Figure 4). Langella et al (2012) reported that obtained interpolation surface using Table 2- Descriptive statistics of some soil properties using inverse distance weighting (IDW) method
Çizelge 2- Bazı toprak özelliklerinin ağırlıklı ters uzaklık kullanılarak elde edilen tanımlayıcı istatistikleri
Variable Min Max Mean Median Skewness Kurtosis SD CV (%)
CaCO3 (%) 24.3 33.3 29.33 29.54 -0.50 -0.55 2.08 7.10
OM (%) 0.24 2.28 0.98 0.86 0.54 -0.74 0.43 43.42
CEC (me 100 g-1 ) 27.6 40.8 34.90 35.15 -0.21 -0.41 2.31 6.62
Clay (%) 49.1 75.9 61.43 61.44 -0.01 0.02 4.37 7.13
Figure 2- Soil layer mapping of estimated calcium carbonate contents
Şekil 2- Toprak tabakasında tahmin edilen kireç değerleri haritası
Figure 3- Soil layer mapping of estimated organic matter contens
Şekil 3- Toprak tabakasında tahmin edilen organik madde değerleri haritası
inverse distance weighting is influenced mostly by nearby points. They also stated that the highest accuracy was obtained using 81 neighboring points in prediction of clay content distribution of topsoil. We have performed inverse distance weighting using 104 neighbor points in our research area.
Figure 4- Soil layer mapping of estimated clay percentages
Şekil 4- Toprak tabakasında tahmin edilen kil değerleri haritası
3.4. Calcium carbonate and organic matter contents
Calcium carbonate content in the soil profiles in general were increased with the increased soil depth whereas decreasing contents were determined through the deepest two layers (90-120 and 120-150 cm). This sinusoidal change in lime contents may be attributed to different geological ages. Some 96% of the top soil layer contained 24-27% limestone while 88.05% of the just underlying layer had 28-30% calcium carbonate (Figure 2). Calcium carbonate contents changing relatively in a narrow range along the profile could be regarded as an indicator for the development of an indistinct clay accumulation zone in the soil. In this area, no steady change was observed in percentage of calcium carbonate contents along the profiles at sampling points and between the sampling locations in general. This finding suggested that the accumulation horizon has been still developing in the soil under the impact of “calcification” processes.
An irregular decrease along the profile was noted with the organic matter contents in the study area (Figure 3). According to the previous results obtained throughout the whole area, lime content, organic matter content and pH values distributed randomly (Tunçay et al 2013). The amounts of organic matter in the topsoil were significantly higher than in the deeper layers. The amount of organic matter was always less than three percent even in the surface soil, in spite of the favorable climate and soil characteristics for plant growth in the region, but not enough to support accumulation of organic matter more than a definite level. The pressure of intensive grazing at the region may also be responsible for this soil organic matter scarcity. Gotway et al (1996) obtained more reliable results than kriging for soil organic matter and nitrogen contents when using IDW. Inigo et al (2012) compiled the results for the comparison of mean values of paired up data on organic mat ter quantities at the surface and at depth for obtaining good interpretable values.
3.5. Cation exchange capacity (CEC)
Two important factors which are the most affecting parameters on cation exchange capacity of soils are clay content and organic matter amount. In addition to that, significant correlations between CEC and other soil properties including sand and silt percentages, pH, bulk density and EC, have been observed (Horn et al 2005; Jung et al 2006). Clay content in our study essentially ranged from 49-75% (Figure 4). The high amount of clay fraction explains relatively high CEC values in Figure 5 and when high clay content is coexisted with excess rate of exchangeable sodium, this may result in higher water saturation percentages and also explain the most frequently low hydraulic permeability which may be often close to zero in the field. This suggests that special precautions and measures should be taken to improve soil structure in eliminating those adverse physical properties. In addition to this fact, water ponding on land surface during preliminary surveys before the establishment of the experimental design was observed which most likely due to this high clay content and heavy seasonal precipitation.
Assessment of Inverse Distance Weighting (IDW) Interpolation on Spatial Variability of Selected Soil Properties..., Tunçay et al
Obviously, the available drainage system was not sufficiently effective. Salinity and sodification problems could not be avoided in deep soil despite the innovator underground drainage net established some 30-35 years ago. This might have resulted from the poor maintenance of the system, high clay content in the deep soil or the resulting low hydraulic permeability.
Clay content was between 49-68% in the upper soils (0-45 cm) which was less in the deeper layers (Figure 4), while clay content was again found higher at deeper parent material (>120 cm). The general high levels of cation exchange capacity were parallel to the content of clay colloids in soil. Accordingly, cation change capacity ranged between 33-36 meq 100 g-1 at 45-60 cm depth, 26-33 meq 100 g-1 at 60-105 cm and 33-42 meq 100 g-1 at 120-150 cm depth (Figure 5). The relative high levels of cation change capacity in the upper horizons could be depended on higher organic matter amount at the surface. Cross validation was performed including all of the variables in order to determine the accuracy of IDW interpolation for each different depth (Table 3). Mostly, the results of interpolation were consistent with those of soil analysis for CaCO3, organic matter, CEC and clay contents. For the different parameters examined, organic matter had the highest mean error (2.82%) in 30-60 cm depth while it was 2.72%
in 120-150 cm, and attributed to the variability of spatial stratification.
Soil CaCO3 content gave the lowest mean error values ranging between 0.02-0.72% (Figure 2).
IDW performance and accuracy are the proximity in location and depth of the known soil characteristics such as organic matter, calcium carbonate contents, clay content and cation exchange capacity (Robinson & Metternicht 2006). It was observed that the majority of data with low skewness delivered the best results with a power of 2.
Figure 5- Soil layer mapping of estimated CEC values
Şekil 5- Toprak tabakasında tahmin edilen katyon değişim kapasitesi değerlerinin haritası
Table 3- Cross-validation results for four soil properties
Çizelge 3- Dört toprak özelliği için çapraz doğrulama sonuçları
CaCO3 (%) MEV MEP (%) Organic matter (%) MEV MEP (%)
0-30 cm 0.01 0.02 0-30 cm 0.01 0.75
30-60 cm 0.22 0.72 30-60 cm 0.02 2.82
60-90 cm 0.15 0.45 60-90 cm 0.01 1.72
90-120 cm 0.04 0.12 90-120 cm 0.01 1.44
120-150 cm 0.08 0.26 120-150 cm 0.02 2.72
CEC (meq 100 g-1) MEV MEP (%) Clay (%) MEV MEP (%)
0-30 cm 0.16 0.42 0-30 cm 0.66 1.03
30-60 cm 0.08 0.25 30-60 cm 0.48 0.87
60-90 cm 0.14 0.46 60-90 cm 0.57 1.06
90-120 cm 0.06 0.17 90-120 cm 0.31 0.50
120-150 cm 0.21 0.56 120-150 cm 0.52 0.77
Kravchenko & Bullock (1999) reported that the data with high skewness (>2.5) were often best estimated with a power of four and for most of the soil properties with low skewness (<1) where a power of one yielded the most accurate estimates.
Estimating the spatial variability of physical and chemical soil properties is a prerequisite for soil and crop-specific management and construction of an ecological environment (Pal et al 2010; Sharma et al 2011; Wang & Shao 2013). Mueller et al (2001), reported that when the RMSE for IDW was minimized with small distance exponents, the field average approach performed well compared to other procedures (kriging, nearest neighbor interpolation).
4. Conclusions
Land use and land management are key parameters for sustainable crop production and desirable, productive soil properties which integrate a variety of environmental processes and human practice in landscape. It is extremely important defining a suite of indicators for site specific management. These indicators must be focused on and be targeted improvement of the physical, biological and chemical properties of the soils in the research region. This paper is focused on spatial interpolation and it is integrated within a GIS to provide and to help developing environmental models especially fitting into in alluvial plains. In addition, the distribution pattern of soil characteristics was mapped in the study area using geostatistical methods. Inverse distance method was employed and evaluated for analyzing the features of some soil characteristics, and its parameters such as minimum and maximum sample numbers, maximum radius etc. Mean error and mean error percentages for interpolation accuracy along with limiting soil sample point all over the study area were computed.
Calcium carbonate, organic matter, cation exchange capacity and clay content values obtained from IDW interpolation were consistent with the soil analysis results, thus enabling the extension of the obtained values to any similar none-sampled region. On the whole, the data obtained from the
study can be utilized for site-specific management, inclusive of the establishment parameters estimation and testing the performance of the present irrigation and drainage systems and also evaluating the land-use practices.
Acknowledgements
This study was financially supported by the Ankara University Scientific Research Coordination Office (Project No. 09 B 4347001).
References
Agris (1998). AgLink reference manual. Version 5.3, AGRIS Corp., Rosewell, GA, pp. 147-171
Atalay İ (2011). Toprak Oluşumu, Sınıflandırılması ve Coğrafyası. Meta Basımevi, İzmir
Corwin D L (2005). Geospatial measurement of apparent soil electrical conductivity for characterizing soil spatial variability. In: A` lvarez-Benedı´ J & Mun˜ oz-Carpena R (Eds), Soil-Water-Solute Characterization:
An Integrated Approach, USA, pp. 55-69
Çağlar K Ö (1949). Toprak Bilgisi, Ankara Üniversitesi Ziraat Fakültesi Yayınları: 10, Ankara
Dengiz O (2010). Morphology, physico-chemical properties and classification of soils on terraces of the Tigris River in the South-east. Tarım Bilimleri
Dergisi-Journal of Agricultural Sciences 16: 205-212
Drummond S T, Sudduth K A, Joshi A, Birrell S J & Kitchen N R (2003). Statistical and neural methods for site-specific yield prediction. Transactions of the
American Society of Agricultural Engineers 46(1):
1-10
Franzen D W & Peck T R (1995). Field soil sampling density for variable rate fertilization. Journal of
Production Agriculture 8: 568-574
Frogbrook Z L & Oliver M A (2001). Comparing the spatial predictions of soil organic matter determined by two laboratory methods. Soil Use and Management
17: 235-244
Gotway C A, Ferguson R B, Hergert G W & Peterson T A (1996). Comparison of kriging and inverse-distance methods for mapping soil parameters. Soil Science
Society of America Journal 60: 1237-1247
Horn A L, Düring R A & Gath S (2005). Comparison of the prediction efficiency of two pedotransfer functions
Assessment of Inverse Distance Weighting (IDW) Interpolation on Spatial Variability of Selected Soil Properties..., Tunçay et al
for soil cation-exchange capacity. Journal of Plant
Nutrition and Soil Science 168: 72-374
Inigo V, Alonso-Martirena J I, Marin A & Jimenez-Ballesta R (2012). Spatial property variability in a humid natural Mediterranean environment: La Rioja, Spain. Spanish Journal of Soil Science 2(1): 281-299
Jung W K, Kitchen N R, Sudduth K A & Anderson S H (2006). Spatial characteristics of claypan soil properties in an agricultural field. Soil Science Society
of America Journal 70: 1387-1397
Kravchenko A N & Bullock D G (1999). A comparative study of interpolation methods for mapping soil properties. Agronomy Journal 91(3): 393-400
Langella G, Basile A, Bonfante A, Manna P & Terribile F (2012). The LIFE+SOILCONSWEB project: A web based spatial decision support system embedding DSM engines. In: Proceedings of the 5th Global
Workshop on Digital Soil Mapping, 10-13 April,
Sydney, Australia, pp. 482
Mabit L & Bernard C (2010). Spatial distribution and content of soil organic matter in an agricultural field in eastern Canada, as estimated from geostatistical tools. Earth Surface Process and Landforms 35:
278-283
Mueller T G, Pierce F J, Schabenberger O & Warncke D D (2001). Map quality for site-specific fertility management. Soil Science Society of America Journal
65: 1547-1558
Öner E, Hocaoğlu B & Uncu L (2005). Tarsus ovasının jeomorfolojik gelişimi ve Gözlükule höyüğü. Türkiye
Kuaterner Sempozyumu TURQUA-V Bildiriler Kitabı,
2-5 Haziran, İstanbul, Türkiye, s. 82-89
Pal S, Panwar P & Bhatt V K (2010). Analysis and in-terpretation of spatial variability of soil properties is a
keystone in site-specific management. Indian Journal
of Soil Conservation 38(3): 178-183
Piikki K, Söderström M & Stenberg B (2013). Sensor data fusion for topsoil clay mapping. Geoderma 199:
106-116
Richards L A (1954). Diagnosis and Improvement of Saline and Alkalin Soils. U.S. Department of Agriculture, Handbook, 60, 109, Riverside
Rhoades J D (1982). Cation exchange capacity. In: A L Page, R H Miller & D R Keeney (Eds), Methods of
Soil Analysis. Part 2: Chemical and Microbiological Properties (2nd ed.), American Society of Agronomy,
Madison, Wisconsin, USA, pp. 149-157
Robinson T P & Matternicht G (2006). Testing the perfor mance of spatial interpolation techniques for mapping soil properties. Computers and Electronics
in Agriculture 50: 97-108
Sharma P, Shukla K & Mexal G (2011). Spatial variability of soil properties in agricultural fields of southern New Mexico. Soil Science 176(6): 288-302
Sheldrick B H & Wang C (1993). Particle size distribution. In: M R Carter (Eds.) Soil Sampling and Methods of
Analysis, Canadian Society of Soil Science, Lewis
Publishers, Ann Arbor, pp. 499-511
Shi W, Liu J, Du Z, Song Y, Chen C & Yue T (2009). Surface modeling of soil pH. Geoderma 150: 113-119
Tunçay T, Bayramin İ, Tercan A E & Ünver İ (2013). Spatial variability of some soil properties: A case study of Lower Seyhan river basin in Turkey.
Zemdirbyste-Agriculture 100(2): 213-219
Wang Y Q & Shao M A (2013). Spatial variability of soil physical properties in a region of the loess plateau of PR China subject to wind and water erosion. Land