EXPERIMENTAL ANALYSIS OF THE OUTPUT PERFORMANCE OF THE ABRASIVE EFFECT OF DUST ON PHOTOVOLTAIC CELLS
Hüseyin BENLİ1,*
, Mert GÜRTÜRK2, Neslihan Koçdemir ERTÜRK3
1Technical Vocational School, Fırat University, 23119 Elazig, [email protected],
ORCID:0000-0002-4057-8750
2Department of Energy Systems Engineering, Technology Faculty, Fırat University, 23119 Elazig, [email protected],
ORCID:0000-0003-0380-5704 3
Department of Energy Systems Engineering, Technology Faculty, Fırat University, 23119 Elazig, [email protected], ORCID:0000-0003-4523-6984
Received Date: 24.08.2020 Accepted Date: 23.12.2020
ABSTRACT
This article presents an evaluation of the power-voltage (P-V) and I-V characteristics of PV cells after exposure to artificial dust spraying. The dusted cells and other clean cells have been to the tested, exposed to five different radiation ranges, and used a solar simulator. In the experiment, a solar simulator analyzer was used to define the PVs' electrical performance, meantime a Sandblasting Cabinet and Atomic Force Microscope were used to inspect the properties abrasive of the dust on the cells. A significant reduction in both I-V and P-V properties was observed when dust accumulation on the surface of photovoltaic solar cells was compared to the same parameters of the clean cells. The average yield loss rate of solar cells exposed to dust spraying has decreased by 5-25% compared to clean cells, considering the inclination angle of the cells.
Keywords: Photovoltaic cell; dust effect; solar energy; dust spraying; renewable energy.
1. INTRODUCTION
The solution to the world's energy deficit problem is in renewable energy sources, and it is an undoubted fact that these resources are sustainable and clean, when besides being used correctly and rationally. PV panels are now one of the most realistic, fast, and clean renewable energy sources accepted by many countries. The reason for the rapid growth of solar panels in many countries is the price reduction, ease of maintenance, and installation. Although Turkey is a developing country, with insufficient energy resources, and excessive energy consuming it is a country that entirely dependent on foreign energy sources. Based on Turkey’s geological location and economic conditions solar energy has a significant market compared to other renewable energy sources. In 2017, 37% of Turkey’s electricity production obtained from natural gas, 33% from coal, 20% from hydraulic energy, 6% from wind, 2% from geothermal energy, and 2% from other sources. Turkey's energy consumption and production are approximately equal to each other. In 2017, consumption was 294.9 billion kWh and electricity generation was 295.5 billion kWh. As of the end of June 2018, the total installed capacity of the PV solar power plant is 4,726 MW. All sources except renewable energy sources, including solar, biomass, and wind, for example, hydro (dam) and geothermal resources are
completely in use. The last established power cycle plants are natural gas conversion plants, fed by Iran and Russia. The country almost pays 40% of its total exports for energy. Therefore, this situation makes it dependent on the neighbors. Currently, the government in power is trying to increase the diversity of energy and increase the rate of clean and renewable energy [1].for this reason, besides the construction of two numbers 4800 MWe nuclear power plants, it also aims to increase the use of wind and PV potential.
In recent years, very detailed and sensitive researches on the effect on PV modules have been conducted on dust accumulation [2–4]. Gholami et al. [5] examined the factors that constituted the accumulation of dust and the decrease in power loss in PV panel applications. Gholami et al. [6] have shown that the accumulation of dust on the panel in an arid environment for 70 days was 6,0986 g/m2 and this deposition caused a power reduction of 21.47% in Tehran, Iran. The factors affecting the accumulation of dust were investigated to research the PV performance effect of dust accumulation. Fountoukis et al. [7] have shown that decreasing the atmospheric pollution value, for example, decreasing the density of the particulate matter, decreased the PV energy losses in Doha, Qatar for a year, Saidan et al. [8] have investigated the loss of efficiency due to dust accumulation on PVs, daily, weekly and monthly in Baghdad, Iraq. Dust accumulation resulted in a decrease in the yield of PV at 6.24%, 11.8%, and 18.74%. Al Shehri et al. [9] have investigated the effect of dust accumulation on solar panels in an environment where dust and sandstorms are common in a dry climate where solar radiation is highest. They have shown that cleaning with using nylon brushes, as a different cleaning method is not effective when compared to water and fine cleaning. They showed that the nylon brushes did not provide adequate cleaning. Mehmood et al. [10] have shown that the accumulation of dust and mud in a damp environment negatively affects the optical, tissue, and mechanical properties of PVs. Researchers showed the morphological and elemental analysis of total dust and examined the micro-level adhesion forces between protective transparent substrates and dust particles. Jiang et al. [4] have created considering the wind cleaning process, building a more accurate model to estimate energy output for PV modules due to accumulated dust. Lu and Zhao, [11] have conducted a numerical study to investigate the dust accumulation on a PV system and its effect. They carried out their work using experimental and fluid dynamics simulation. Menoufi et al. [12] have studied the electrical performance of PV panels exposed to artificial dust in Nile, Egypt. Ahmed and Mohammed, [13] have investigated the thermal and electrical performance of the dust on a hybrid solar collector. They investigated the effects of the dust particles of different sizes, the amounts of different released dust particles, and the effects of gravitational force based on the dust accumulation rate on PV panels. Fountoukis et al. [14] have investigated both the modeling and experimental study of dust accumulation of the loss of energy efficiency in PV panels in a dry climate. Lay-Ekuakille et al. [15] have studied the possibility of modeling and experimental efficiency by using the relevant parameters which allow the deposition of dust and pollutant on the PV panels. Mejia et al. [16] have investigated the efficiency losses between concentrated solar power and flat PV due to dust accumulation. They showed that CPV caused losses greater than flat PV due to contamination. They calculated that this loss was 71%. Tanesab et al. [17] have investigated the seasonal effects of dust on the performance of PV panels in two different climate zones, Perth, Western Australia, and tropical climate zone Teygana Timur (NTT) Indonesia. Wang et al. [18] have shown that dust accumulation in PV modules is dependent on environmental and weather conditions, resulting in a decrease in energy production over time.
As mentioned above, many types of researchers describe how the dust factor that accumulated on the photovoltaic panels affects the yield. In this study, it was investigated how the dust particles in high
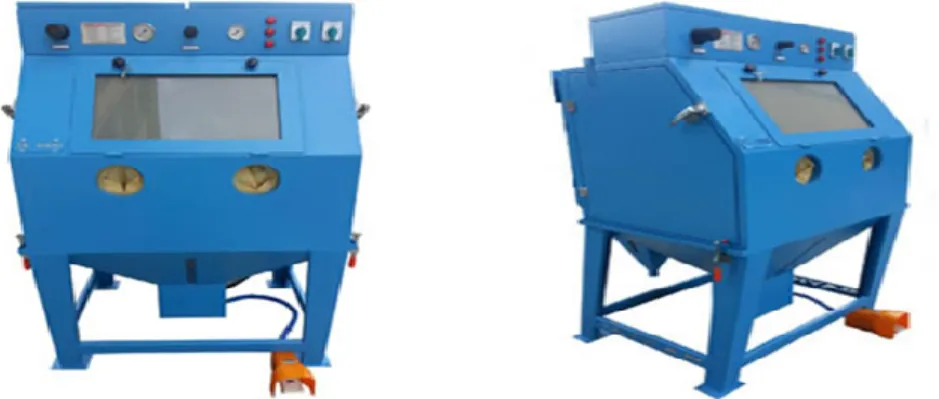
wind velocities adhered to the cells, and the damage on the cell surface affected the P-V and I-V values in PV cells. The cells were tested at different tilt angles and measurements were made. For the homogeneous and balanced distribution of dust particles in the cells used in the experiments, a sandblasting device was used in particular. As a result of the experiments, it was found that the sand particles caused a significant decrease in the efficiency at high tilt angle values with the impact effect. A special device used for cleaning metal parts was used to ensure homogenous sandblasting in PV cells during operation. The device used for this purpose is the SK-1400 product of SAYKAR company, (www. saykar.net). The cells placed in the device were kept at 200,300,400,500,600,700,800 and 900 tilt angles and were sprayed fine glass sand for two minutes. The material used in the air pressurized sandblasting systems is grade C, 310-400-micron glass grit particles. Photographs of the sandblasting Cabinet (SK-1400) are given in Figure 1.
Figure 1.Sandblasting Cabinets (SK 1000) Saykar.net. 2. EXPERIMENTAL PROCEDURE
There are four methods commonly used to clean the surface of the solar panel: natural, mechanical, electromechanical, and electrostatic. Further research and ideas are needed to reduce the negative impact of dust accumulation on PVs. In this study, the reason for using the sandblasting device to measure dust accumulation and its effect is that wood resins frequently encountered in this region of Turkey are adhered to the panels as a result of encountering dust and insects and carried away by the wind. It is a very demanding and long process to remove them. Dust last long in panels. The most precise and optimum form of calculating the abrasive effect of the dust sprayed on photovoltaic cells is to design an experiment in which the dust particles adhered regularly. Then the process performed, the power output of the cells (directly exposed to the glass sand spray) was measured. The power output was then compared with similar clean (dust-free) cells for comparison. The photographing of the cells after sand spraying was done by Atomic Force Microscopy. The photographs are given in Figure 2.
Figure 2 Atomic Force Microscope XE-100E (Park System).
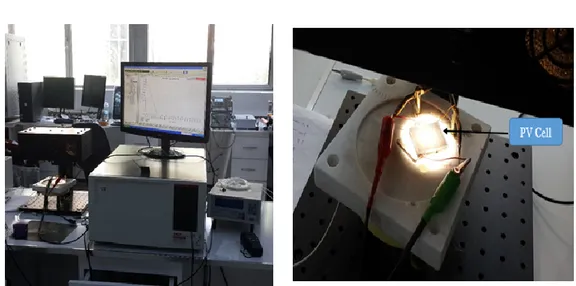
To perform measurements under outdoor actual test conditions, a solar analyzer “Model 4200-SCS” is used. The model of the device manufactured and marketed by Keithley Company is 4200-SCS. A photograph of the solar analyzer is given in Figure 3. Detailed information about the solar simulator is given in ref. [19], (www.keithley.com) is used which allows to trail the P-V and I-V curves and let the main parameters of the PV cell: Short circuit current (
I
sc), Fill Factor (FF
), Maximum power (P
max), Open circuit voltage (V
oc), andI
maxV
max respectively.The basic equations used in this experimental study are as follows [20]:
0exp
1
s pvq V
IR
I
I
I
akT
(1) 0ln
sc ocI
kT
V
a
q
I
(2)Based on the I-V curve constituted by Eqs. (1) and (2),
P
max,V
oc andI
scwere composed and then filling factor (FF
) can be calculated using the following equations 3 and 4 [20].max oc sc
P
V I FF
(3) max max sc ocI
V
FF
I V
(4)
Figure 3 Solar simulator and experiment of PV cell. 2.1. Properties of Dust Used in Spraying
Glass sand is also known as glass grit or glass powder in the market. It is more suitable to be
used at air pressurized sandblasting systems. Glass Sand, which is used in applications, is
made of 100% consumer post, recycled bottle glass. Glass Sand has very low particles,
giving a whiter, cleaner result in the applications using. The cornered particles in the crushed
glass allow a thrusting surface profile to be formed and to remove coatings such as paint,
alkyds, epoxy, polyurea vinyl, elastomers, and coal tar. Table 1 shows the physical and
chemical properties of the glass sand. The photograph of the glass sand is given in Figure 4.
Table 1 Glass sand Physical and chemical characteristics.
GLASS SAND PHYSICAL
CHARACTERISTICS
Glass Sand - Specific Gravity 2,45 g/cm3 Glass Sand - Average Bulk Density 1,50 g/cm3
Glass Sand's Hardness 47 HRC
Glass Sand's Durability Low
Glass Sand's Free Flow Feature 97 % minimum Glass Sand's Moisture Absorption High
Glass Sand's Radioactivity Characteristic No Glass Sand's Magnetic Characteristic No
GLASS SAND CHEMICAL
CHARACTERISTICS
SiO2 >% 65 Glass Sand does not enter a reaction with oxygen.
Al2O3 : % 0,5-2 Glass Sand does not contain free silica.
CaO : %8-11 Glass Sand has inert structure.
Fe2O3 < % 0,2 Glass Sand is not flammable.
K2O < %1,5 Glass Sand does not contain cancerogenic substances.
Na2O : %13-15
GLASS SAND ABRASIVE GRADES
Grade C 310-400 micron glass grit particles
Figure 4 The view of glass sand. 3. RESULT AND DISCUSSION
Due to increasing oil prices and the high exchange rate, Turkey's energy production costs are constantly increasing. In January and December of 2018, the Turkish lira depreciated by about 58% against the US dollar. In recent days, electricity and natural gas usage prices have increased by about 50%. However, due to the rational use of renewable energy sources, a steady downward trend is observed in energy costs in many countries. The emergence of new firms and technologies in the production of PV panels and the increase in efficiency led to a decrease in costs and thus a significant increase in its use. The success of many countries in panel production has also made it easier to reach them. The same success was not achieved in the production of wind turbines. Because the production of wind turbines requires higher technology, which limits its use and production. The use of PVs which has a very high demand in our country, due to the increasing exchange rate and inflation since 2018, investments in this field have completely stopped except for previous investments. However, there is a rapid return to clean energy in the world, especially renewable energy.
As previously described, the power output of the cells varies depending on both the current and the voltage. The curves of the change and abrasive effect of sand spraying on PV cells, Figs. 5 and 6 are given. The abrasive effect of the dust on the cells was investigated in two separate sections (P-V and I-V).
3.1. Effect of Abrasive Effect of Dust on the Power output of PV Cell
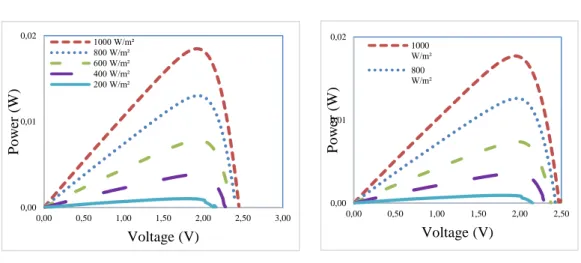
As mentioned before, experiments were conducted using five different solar irradiance values; 200, 400, 600, 800, and 1000 W/m2. Many researchers have shown that the accumulation of dust on PV panels is one of the most important reasons for the decrease in the power output that can be achieved. Power losses in PV cells were examined in two parts. Firstly, individual cells were measured, and then the cells having different properties were subjected to glass sand spraying in the sandblasting chamber. At low radiation intensities (200, 400 and 600 W/m2) the power drop is very low, and the power drop at 800 and 1000 W/m2 radiation values increases. This decrease is between 10-20%. The ratio of power output drop on cells 800,700 and 600 is carried out at a low rate. The reason for this is that as the angle of inclination becomes smaller, a portion of the sprayed glass sand cannot hold on to
0,00 0,01 0,02 0,00 0,50 1,00 1,50 2,00 2,50 P o w er ( W ) Voltage (V) 1000 W/m² 800 W/m² 600 W/m² 400 W/m² 200 W/m² 0,00 0,01 0,02 0,00 0,50 1,00 1,50 2,00 2,50 P o w er ( W ) Voltage (V) 1000 W/m² 800 W/m² 600 W/m²
the cell. Consequently, it is a decrease in the amount of dust falling to a lower area. It should be remembered that each cell used before the experiments has different characteristics. The power output tilt angle of 400 and 500 is quite high, this loss which is between 10-20 percent.
As the tilt angle value increases, the power output is low except for a 900 angle of inclination. The power output value increases after 50 0 of the tilt angle because the accumulation of dust is more likely to accumulate in the lower part of the cells, and the cells do not have any contact with the sand sprayed in any amount. This is something to be expected. In each cell subjected to sand blasting, the spray gun is held upright. At low inclination angles, the amount of sand contacting the cell decreases. The power drop at the tilt angle of 200 was very low.
The reason for the further drop in this angle range is since sand spraying is concentrated in a restricted area. Briefly, the P-V curves vary considerably between before and after each cell. The P-V exchange curves were given before and after the experiment in Figure 5.
Non using dust spraying (Before 900) Using dust spraying (After 900)
Non using dust spraying (Before 800) Using dust spraying (After 800)
0,00 0,01 0,02 0,00 0,50 1,00 1,50 2,00 2,50 3,00 P o w er ( W ) Voltage (V) 1000 W/m² 800 W/m² 0,00 0,01 0,02 0,00 0,50 1,00 1,50 2,00 2,50 3,00 P o w er ( W ) Voltage (V) 1000 W/m² 800 W/m² 600 W/m² 400 W/m² 200 W/m²
0,00 0,01 0,02 0,00 0,50 1,00 1,50 2,00 2,50 3,00 P o w er ( W ) Voltage (V) 1000 W/m² 800 W/m² 600 W/m² 400 W/m² 200 W/m² 0,00 0,01 0,02 0,00 0,50 1,00 1,50 2,00 2,50 3,00 P o w er ( W ) Voltage (V) 1000 W/m² 800 W/m² 600 W/m² 400 W/m² 200 W/m² 0,00 0,01 0,02 0,00 0,50 1,00 1,50 2,00 2,50 P o w er ( W ) Voltage (V) 1000 W/m² 800 W/m² 600 W/m² 400 W/m² 200 W/m²
Non using dust spraying (Before 700) Using dust spraying (After 700)
Non using dust spraying (Before 600) Using dust spraying (After 600)
0,00 0,01 0,02 0,00 0,50 1,00 1,50 2,00 2,50 P o w er ( W ) Voltage (V) 1000 W/m² 800 W/m² 600 W/m² 400 W/m² 200 W/m²
0,00 0,01 0,02 0,00 0,50 1,00 1,50 2,00 2,50 3,00 P o w er ( W ) Voltage (V) 1000 W/m² 800 W/m² 600 W/m² 0,00 0,01 0,02 0,00 0,50 1,00 1,50 2,00 2,50 P o w er ( W ) Voltage (V) 1000 W/m² 800 W/m² 600 W/m² 400 W/m² 200 W/m² 0,00 0,01 0,02 0,00 0,50 1,00 1,50 2,00 2,50 3,00 P o w er ( W ) Voltage (V) 1000 W/m² 800 W/m² 600 W/m² 400 W/m² 200 W/m² 0,00 0,01 0,02 0,00 0,50 1,00 1,50 2,00 2,50 P o w er ( W ) Voltage (V) 1000 W/m² 800 W/m² 600 W/m² 400 W/m² 200 W/m²
Non using dust spraying (Before 500) Using dust spraying (After 500)
Non using dust spraying (Before 400) Using dust spraying (After 400)
Non using dust spraying (Before 300) Using dust spraying (After 300)
0,00 0,01 0,02 0,00 0,50 1,00 1,50 2,00 2,50 3,00 P o w er ( W ) Voltage (V) 1000 W/m² 800 W/m² 600 W/m² 400 W/m² 200 W/m² 0,00 0,01 0,02 0,00 0,50 1,00 1,50 2,00 2,50 P o w er ( W ) Voltage (V) 1000 W/m² 800 W/m² 600 W/m² 400 W/m² 200 W/m²
Non using dust spraying (Before 200) Using dust spraying (After 200)
Figure 5 Change of P-V curves of dust spraying.
Non using dust spraying (Before 900) Using dust spraying (After 900)
0,00 0,01 0,02 0,00 0,50 1,00 1,50 2,00 2,50 3,00 C u rr en t (I ) Voltage (V) 1000 W/m² 800 W/m² 600 W/m² 400 W/m² 200 W/m² 0,00 0,01 0,02 0,00 0,50 1,00 1,50 2,00 2,50 C u rr en t (I ) Voltage (V) 1000 W/m² 800 W/m² 600 W/m² 400 W/m² 200 W/m² 0,00 0,01 0,02 0,00 0,50 1,00 1,50 2,00 2,50 3,00 P o w er ( W ) Voltage (V) 1000 W/m² 800 W/m² 600 W/m² 400 W/m² 200 W/m² 0,00 0,01 0,02 0,00 0,50 1,00 1,50 2,00 2,50 P o w er ( W ) Voltage (V) 1000 W/m² 800 W/m²
0,00 0,01 0,02 0,00 0,50 1,00 1,50 2,00 2,50 C u rr en t (I ) Voltage (V) 1000 W/m² 800 W/m² 600 W/m² 400 W/m² 200 W/m² 0,00 0,01 0,02 0,00 0,50 1,00 1,50 2,00 2,50 C u rr en t (I ) Voltage (V) 1000 W/m² 800 W/m² 600 W/m² 400 W/m² 200 W/m²
Non using dust spraying (Before 800) Using dust spraying (After 800)
Non using dust spraying (Before 700) Using dust spraying (After 700)
0,00 0,01 0,02 0,00 0,50 1,00 1,50 2,00 2,50 3,00 C u rr en t (I ) Voltage (V) 1000 W/m² 800 W/m² 600 W/m² 400 W/m² 200 W/m² 0,00 0,01 0,02 0,00 0,50 1,00 1,50 2,00 2,50 3,00 C u rr en t (I ) Voltage (V) 1000 W/m² 800 W/m² 600 W/m² 400 W/m² 200 W/m²
0,00 0,01 0,02 0,00 0,50 1,00 1,50 2,00 2,50 3,00 Cu rr en t (I ) Voltage (V) 1000 W/m² 800 W/m² 600 W/m² 400 W/m² 200 W/m²
Non using dust spraying (Before 600) Using dust spraying (After 600)
Non using dust spraying (Before 500) Using dust spraying (After 500)
0,00 0,01 0,02 0,00 0,50 1,00 1,50 2,00 2,50 3,00 C u rr en t (I ) Voltage (V) 1000 W/m² 800 W/m² 600 W/m² 400 W/m² 200 W/m² 0,00 0,01 0,02 0,00 0,50 1,00 1,50 2,00 2,50 Cu rr en t (I ) Voltage (V) 1000 W/m² 800 W/m² 600 W/m² 400 W/m² 200 W/m² 0,00 0,01 0,02 0,00 0,50 1,00 1,50 2,00 2,50 C u rr en t (I ) Voltage (V) 1000 W/m² 800 W/m² 600 W/m² 400 W/m² 200 W/m²
0,00 0,01 0,02 0,00 0,50 1,00 1,50 2,00 2,50 3,00 C u rr en t (I ) Voltage (V) 1000 W/m² 800 W/m² 600 W/m² 400 W/m² 200 W/m² 0,00 0,01 0,02 0,00 0,50 1,00 1,50 2,00 2,50 C u rr en t (I ) Voltage (V) 1000 W/m² 800 W/m² 600 W/m² 400 W/m² 200 W/m²
Non using dust spraying (Before 400) Using dust spraying (After 400)
Non using dust spraying (Before 300) Using dust spraying (After 300)
0,00 0,01 0,02 0,00 0,50 1,00 1,50 2,00 2,50 3,00 C u rr en t (I ) Voltage (V) 1000 W/m² 800 W/m² 600 W/m² 400 W/m² 200 W/m² 0,00 0,01 0,02 0,00 0,50 1,00 1,50 2,00 2,50 C u rr en t (I ) Voltage (V) 1000 W/m² 800 W/m² 600 W/m² 400 W/m² 200 W/m²
Non using dust spraying (Before 200) Using dust spraying (After 200) Figure 6. Change of I-V curves of dust spraying.
3.2. Effect of Abrasive Effect of Dust on I-V Characteristic of PV Cell
When the I-V curves are taken into consideration, the highest loss occurs similarly to the P-V curves. At low radiation intensities (200, 400 and 600 W/m2), the reduction in I-V curves is very low, this change is between 0-10%, and this change is increased at 800 and 1000 W/m2 radiation values, this change occurs 10-20 %. At the 800 and 700 tilt angles, a small reduction in I-V curves was observed in the low radiation values after sand blasting (200,400,600 W/ m2). The I-V curves show a decrease in the radiation values of 800 to 1000 W/m2 and this change varies between 5-15%. In the same way, the decreases in the 600 and 500 tilt angles in the I-V curves and the high radiation values (800 and 1000 W/m2) are in the 5-15% range. The decrease in low irradiation values is very limited. The I-V exchange curves were given before and after the experiment in Figure 6. Two photographs of every one cell photographed by electron microscopy are given in Figure 7.
a (900) b (900) 0,00 0,01 0,02 0,00 0,50 1,00 1,50 2,00 2,50 C u rr en t (I ) Voltage (V) 1000 W/m² 800 W/m² 600 W/m² 400 W/m² 200 W/m² 0,00 0,01 0,02 0,00 0,50 1,00 1,50 2,00 2,50 3,00 C u rr en t (I ) Voltage (V) 1000 W/m² 800 W/m² 600 W/m² 400 W/m² 200 W/m²
a (800) b (800)
a (700) b (700)
a (500) b (500)
a
(400) b (400) a (300) b (300)
a (200)
b (200) Figure 7 The views of the cells after the dust spraying in different tilt angles. 4. CONCLUSIONS
The use of solar energy, known as the cleanest energy source in the world, contributes to the reduction of greenhouse gas emissions while at the same time meeting a significant part of the world's energy needs. The emergence of new, cheaper and more efficient products with PV panel technology is considered to be the most useful source for countries that have energy deficit problems. The frequent use of PV Panel technologies has brought many problems such as use, cleaning, maintenance, operation, and pollution. At present, the biggest problem experienced by many enterprises is the loss of power and efficiency due to pollution. Most of the recent studies are related to the identification and elimination of the factors causing these losses.
In this study on different tilt angles, the effect of dust spraying on the transmittance of PV cells have been investigated. Dust particles were uniform and in the same form, all of them being special sand with a spherical shape. In this study, the effects of dust spraying on the cells at different tilt angles were photographed by electron microscopy. It was also evident from the photographs and the results that the effect of the sprayed dust on the surface of the cells increased as the angle of inclination increased, and I-V and P-V curves decreased as a result.
These dust deposits indicate a deterioration of the panel surfaces and consequently prevent a certain part of the incoming solar radiation. In this study, the sands used was the same properties and the cells were subjected to real sand spraying at the determined angle values.
At low radiation intensities (200, 400 and 600 W/m2) the power drop is very low, and the power drop at 800 and 1000 W/m2 radiation values increases. This decrease is between 10-20%. At low radiation intensities (200, 400, and 600 W /m2), the reduction in I-V curves is very low, this change is between 0-10%, and this change is increased at 800 and 1000 W/m2 radiation values, this change occurs 10-20 %.
The average degradation rate of efficiency of the solar cells exposed to the dust spraying is 5-25 % compared to exposure periods of the clean cells.
this study show that the increased inclination angle increases the damage on the PV cell. All of them are permanent on the cell, which also reduces solar permeability.
ACKNOWLEDGMENTS
The authors would like to acknowledge the support of Fırat University. Nu. TBMYO.17.01.
REFERENCES
[1] Kok, B., Benli, H. (2017), Energy diversity and nuclear energy for sustainable development in Turkey. Renew. Energy, 111, 870–877. https://doi.org/10.1016/j.renene.2017.05.001
[2] Jiang Y., Lu L. (2016), Experimentally investigating the effect of temperature differences in the particle deposition process on solar photovoltaic (PV) modules. Sustainability. 8 (11),1091.
https://doi.org/10.3390/su8111091
[3] Darwish, ZA., Kazem, HA., Sopian, K, Al-Gou, M.A., Alawadhi, H. (2015), Effect of dust pollutant type on photovoltaic performance. Renew. Sustain. Energy Rev. 41, 735–744.
https://doi.org/10.1016/j.rser.2014.08.068
[4] Jiang, Y., Lu, L., Ferro, A.R., Ahmadi, G. (2018), Analyzing wind cleaning process on the accumulated dust on solar photovoltaic (PV) modules on flat surfaces. Solar Energy. 159, 1031– 1036. https://doi.org/10.1016/j.solener.2017.08.083
[5] Gholami, Aslan., Ahmad, Saboonchi A.A.A., (2017), Experimental study of factors affecting dust accumulation and their effects on the transmission coefficient of glass for solar applications. Renewable Energy. 112, 466–473.
[6] Gholami, A., Khazaee, I., Eslami, S., Zandi, M., and Akrami E. (2018). Experimental investigation of dust deposition effects on photo-voltaic output performance. Solar Energy. 159, 346–352. https://doi.org/10.1016/j.solener.2017.11.010
[7] Fountoukis, C., Figgis, B., Ackermann, L., and Ayoub, M.A. (2018). Effects of atmospheric dust deposition on solar PV energy production in a desert environment. Solar Energy. 164, 94–100.
https://doi.org/10.1016/j.solener.2018.02.010
[8] Saidan, M., Albaali, A.G, Alasis, E., and Kaldellis, J.K. (2016). Experimental study on the effect of dust deposition on solar photovoltaic panels in desert environment. Renewable Energy. 92, 499–505. https://doi.org/10.1016/j.renene.2016.02.031
[9] Al Shehri, A., Parrott, B., Carrasco, P., Al Saiari, H., and Taie, I. (2016). Impact of dust deposition and brush-based dry cleaning on glass transmittance for PV modules applications. Solar Energy. 135, 317–324. https://doi.org/10.1016/j.solener.2016.06.005
[10] Mehmood, U., Al-Sulaiman, F.A., and Yilbas, B.S. (2017). Characterization of dust collected from PV modules in the area of Dhahran, Kingdom of Saudi Arabia, and its impact on protective
transparent covers for photovoltaic applications. Solar Energy. 141, 203–209.
https://doi.org/10.1016/j.solener.2016.11.051
[11] Lu, H., Zhao, W. (2018). Effects of particle sizes and tilt angles on dust deposition characteristics of a ground-mounted solar photovoltaic system. Applied Energy. 220, 514–526.
https://doi.org/10.1016/j.apenergy.2018.03.095
[12] Menoufi, K., Farghal, H.F.M., Farghali, A.A., and Khedr, M.H. (2017). Dust accumulation on photovoltaic panels: A case study at the East Bank of the Nile (Beni-Suef, Egypt). Energy Procedia. 128, 24–31. https://doi.org/10.1016/j.egypro.2017.09.010
[13] Ahmed, O.K., Mohammed, Z.A. Dust effect on the performance of the hybrid PV/Thermal collector. Therm. Sci. Eng. Prog. 2017; 3, 114–122. https://doi.org/10.1016/j.tsep.2017.07.003
[14] Fountoukis, C., Ackermann, L., Ayoub, M.A., Gladich, I., Hoehn, R.D., and Skillern, A. (2015). Impact of atmospheric dust emission schemes on dust production and concentration over the Arabian Peninsula. Model Earth Syst. Environ. 2, 115. https://doi.org/10.1007/s40808-016-0181-z
[15] Lay-Ekuakille, A., Ciaccioli, A., Griffo, G., Visconti, P., and Andria, G. (2018). Effects of dust on photovoltaic measurements: A comparative study. Meas. J. Int. Meas. Confed. 113, 181–188. https://doi.org/10.1016/j.measurement.2017.06.025
[16] Mejia, F., Kleissl, J., and Bosch, J.L. (2013). The effect of dust on solar photovoltaic systems. Energy Procedia. 49, 2370–2376. https://doi.org/10.1016/j.egypro.2014.03.251
[17] Tanesab, J., Parlevliet, D., Whale, J., and Urmee, T. (2017). Seasonal effect of dust on the degradation of PV modules performance deployed in different climate areas. Renewable Energy. 111, 105–115. https://doi.org/10.1016/j.renene.2017.03.091
[18] Wang, P., Xie, J., Ni, L., Wan, L., Ou, K., Zheng,L., and Sun, K. (2018). Reducing the effect of dust deposition on the generating efficiency of solar PV modules by super-hydrophobic films. Solar Energy. 169, 277–283. https://doi.org/10.1016/j.solener.2017.12.052
[19] Gürtürk, M., Benli, H., and Ertürk, N.K. (2018). Effects of different parameters on energy - Exergy and power conversion efficiency of PV modules. Renewable and Sustainable Energy Reviews. 92, 426–439. https://doi.org/10.1016/j.rser.2018.04.117.
[20]
Sze, S.M. (1969). Physics of semiconductor devices, John Wiley and Sons NY.NOMENCLATURE A area (m2)
a
ideality factorFF
fill factorI current (A)