Araştırma Makalesi
Adıyaman Üniversitesi
Mühendislik Bilimleri Dergisi
12 (2020) 14-23
VEZİR GRAFLARININ GİRVAN NEWMAN KÜMELEME
ALGORİTMASI İLE MODÜLERLİĞİ
Serkan GÜLDAL
1*, Michael M. LIPSCOMB
2, Murat M. TANIK
31 Adiyaman University, Faculty of Arts and Science, Department of Physics, Adiyaman, 02040, Turkey
2-3 University of Alabama in Birmingham, School of Engineering, Department of Electrical and Computer Engineering,
Birmingham AL, 35294, USA
Geliş tarihi: 23.03.2020 Kabul tarihi: 12.05.2020
ÖZET
Kümeleme veri bilimcileri tarafından teknolojik uygulamalar için yaygın olarak kullanılan veri analiz tekniğidir. Yapılan analizlerin bir kısmı veriler arasındaki ilişkiyi tanımlamaktadır ve güçlü ilişkiler, kümeleme algoritmaları aracılığıyla alt kümeler oluşturur. Kümelerin düğümleri arasındaki işlevsel ilişkiler, araştırılmamış ağ özelliklerini ortaya çıkarmaktadır. Bu çalışmada, Girvan-Newman Kümeleme algoritması ile Vezir graflarının (N-Vezir problemi graf gösterimi) ilişkisel özelliklerini araştırdık. Araştırmamız yüksek simetrik düğümlerin alt topluluklarda simetriye yol açmadığını gösterdi. Tahta büyüklüğüne göre farklı düğüm dereceleri artarken, oluşan alt kümelerin sayısı da düzensiz olarak artmaktadır. Ayrıca, maksimum modülerlik puanı alt topluluk sayısından daha yavaş artış göstermektedir.
Anahtar Kelimeler: Girvan-Newman; Vezir Grafları; N-Vezir Problemi
THE MODULARITY OF QUEEN GRAPHS BY GIRVAN-NEWMAN
CLUSTERING ALGORITHM
ABSTRACT
The clustering of a given data set is a technique widely utilized data analysis method by data scientists for technological applications. Some portion of the analysis defines the relations between data, and strong relations are identified as sub-communities by means of clustering algorithms. The collected functional relations between the clusters’ nodes extract the uninvestigated network properties. In this study, we investigated the relational properties of Queen graphs (graph representation of the N-Queens problem) by the Girvan-Newman Clustering algorithm. Our investigation showed that the highly symmetric degree of nodes does not lead the symmetry in the sub-communities. While the distinct number of degrees increases with respect to board size, the number of subcommunities increases irregularly. Additionally, the maximum modularity score increases slower than the number of subcommunities.
Keywords: Girvan-Newman; Queens Graph; N-Queens Problem
1. Introduction
N-Queens is a combinatorics problem extended from the 8-Queens problem [1, 2]. The N-Queens problem requires the combination of N queens on the NxN board such that none of the queens can attack the other. The problem was widely investigated by famous mathematicians such as Gauss [1, 2], Polya [3], and Lucas [4]. Likewise, the N-Queens problem is the subject of current research, including quantum computation [5-7], and genetic algorithm [8, 9]. Additionally, the N-Queens problem is utilized in
* e-posta: 1 [email protected] ORCID ID: https://orcid.org/0000-0002-4247-0786 2 [email protected] ORCID ID: https://orcid.org/0000-0001-9980-2326 3 [email protected] ORCID ID: https://orcid.org/0000-0002-9437-725X
ADYU Mühendislik Bilimleri Dergisi 12 (2020) 14-23
computer science to demonstrate various algorithms such as permutation generation, backtracking, and the divide-and-conquer paradigm [10]. The N-Queens problem is one of the well-known examples of an NP-hard type problem. This is a class of problem that is “at least as hard as the hardest problems in NP” [11].
In this study, we investigated the relational information between cells if there is a queen placed. For that, the Girvan-Newman Clustering (GNC) algorithm was applied to the queen graph.
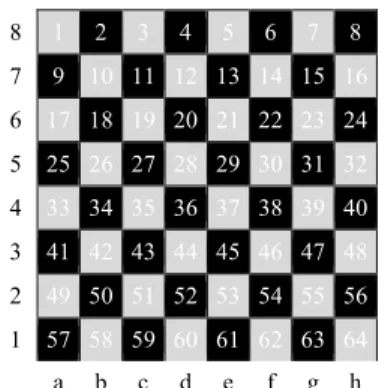
The queen graph was converted from the considered board. Every cell was indexed by a number to represent the nodes in the graph. Edges were generated from the queen moves, so that rows, columns, and diagonal elements had edges connected to them. An example of this is shown in Figure 1, in which an 8x8 board is presented by indexed cells. The corresponding graph is shown in Figure 2. Every cell is represented by a node in the graph. Edges connect the overlapping nodes.
8 1 2 3 4 5 6 7 8 7 9 10 11 12 13 14 15 16 6 17 18 19 20 21 22 23 24 5 25 26 27 28 29 30 31 32 4 33 34 35 36 37 38 39 40 3 41 42 43 44 45 46 47 48 2 49 50 51 52 53 54 55 56 1 57 58 59 60 61 62 63 64 a b c d e f g h
Figure 1. 8x8 board is defined by indexing every cell with the sequence of numbers from 1 to 64
The 8-Queens graph is color-coded with respect to degrees of nodes and is presented in Figure 2. The first ring (purple colored nodes) contains the nodes with 21 degrees. The second ring (green colored nodes) contains the nodes with 23 degrees. The third-degree nodes (orange-colored nodes) contain the nodes with 25 degrees. Lastly, the nodes in the center (blue colored nodes) are the nodes with 27 degrees. This is the maximum capacity that a node can cover on an 8x8 board. A similar ring form is presented for all the Queen graphs.
Color code Degree Percentage in the graph (%)
21 43.75
23 31.25
25 18.75
27 6.25
Figure 2 8-Queens graph is color-coded with respect to the degree of the nodes
In this paper is presented the results of the Girvan-Newman Clustering (GNC) algorithm applications on queen graphs to extract relational states between placed queens by means of N-Queens [12, 13].
In the following section, we share the degree properties of Queen graphs. Next, the GNC algorithm and application on the Queen graph is discussed. Then a discussion is had on the results of GNC application and relation with related graph properties. Finally, concluding remarks are provided.
ADYU Mühendislik Bilimleri Dergisi 12 (2020) 14-23
2. Queen Graphs’ Degree Revisit
The Girvan-Newman Clustering (GNC) algorithm uses edge- betweenness to extract the subnetworks in a specified graph. In this way, the degree of the graph (queen graphs in this study) inherently defines the clusters. Figure 2 shows the degree of the nodes' proportional distribution of the 8-Queens graph. While the outer ring with degree 21 is the majority, the nodes with degree 27, the center of the board, contains the least number of nodes in the 8-Queens graph.
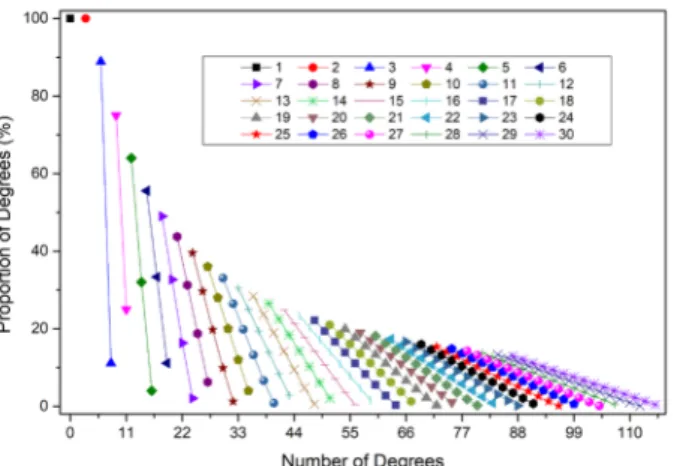
The distinct type of degree distribution of the Queen graphs is shown with respect to the specified graph in Figure 3. 1-Queens and 2-Queens each have one distinct degree of nodes which have 0 and 3 degrees respectively.
With the increasing number of nodes for greater cells, more distinct degrees emerge. 3-Queens has 2 distinct degrees: 6 and 8. Similarly, 4-Queens has 2 distinct degrees: 9 and 11. The increase in the distinct degrees follows a continuous trend as shown in Figure 4.
Figure 3 Proportionality of degrees for the given graph distribution gap closes by increasing the board
size
Figure 4. Increase of Distinct Degree of N-Queens (N=1-30)
3. Girvan-Newman Clustering of Queens Graphs
There are several clustering algorithms, which are used to extract information about the relationships in the networks. Such algorithms include minimum-cut [14], hierarchical clustering [15], modularity maximization [16], statistical inference [17], Girvan–Newman Clustering (GNC) algorithm [12], and clique-based methods [18].
In our study, we applied GNC to identify the relations between queens. GNC is a divisive method that uses edge betweenness. It progressively removes edges one-by-one until no edge is left in the given
ADYU Mühendislik Bilimleri Dergisi 12 (2020) 14-23
graph. In each step, edge betweennesses are recalculated, and edge(s) with maximum edge betweenness is or are removed. Additionally, a modularity score is calculated in each step so that the graph with the maximum modularity score corresponds to the most stable combination of the collection of clusters.
The clusters represent the strongly connected community of queens. Functional relations are defined by modularity in small communities. Our analysis was done by means of Gephi with a GNC plugin [19]. We applied 2 to 30-Queens. Further details of applications will be discussed in the Results and Discussion section that follows.
There are various modularity scoring algorithms. In our calculations, the modularity score, which is a measure of network quality, is formulated as follows [20]:
𝑄𝑄 =1 2 � �𝐴𝐴𝑖𝑖𝑖𝑖− 𝑘𝑘𝑖𝑖𝑘𝑘𝑖𝑖 𝑀𝑀 � 𝑠𝑠𝑖𝑖𝑠𝑠𝑖𝑖 𝑖𝑖,𝑖𝑖 (1) where 𝑠𝑠𝑖𝑖𝑠𝑠𝑖𝑖 is 1 if 𝑖𝑖 and 𝑗𝑗 are in the same group. M stands for the number of edges in the graph. 𝑘𝑘𝑖𝑖
is the degree of node 𝑖𝑖 and 𝑘𝑘𝑖𝑖 is the degree of node 𝑗𝑗. 𝐴𝐴𝑖𝑖𝑖𝑖 is the adjacency matrix.
4. Results and discussion
In our study, we investigated the functional relations between queens by means of the Girvan-Newman Clustering (GNC) algorithm. The most stable sub-communities (a.k.a. clusters) were identified based on the modularity score.
GNC is not applicable to 1-Queen since no edge exists. Thus, our investigation was limited from 2 to 30. In Figure 6, applications of GNC on N-Queens graphs (N=2-6 and 16-18) are shown. 2-Queens is the graph which has 4 nodes and 6 edges. Removing the first and the second edges from the 2-Queens graph has no effect on the modularity score, as shown in Figure 6.a. Removing the rest of the edges reduces the modularity. Thus, the maximum modularity score for 2-Queens graph is 0.0, and there is only 1 community.
Figure 6.b presents the GNC application on a 3-Queens graph. The 3-Queens graph has 9 nodes and 28 edges. Modularity score jumps from 0 to 0.06122446 by the 12th edge. 2 clusters are identified
with the maximum modularity score. The major cluster has 5 nodes, and the minor cluster has 4 nodes, which are at the corners of the board.
The 4-Queens graph consists of 16 nodes and 76 edges. It reaches to the maximum modularity score, 0.012551993, with the 7 clusters (See Figure 6.c). 4-Queens’ modularity score follows a combination of 2-Queens and 3-Queens. The modularity score of 4-Queens decreases to a negative value which indicates less interaction and then increases to the maximum value, 0.012551993.
The other noticeable behavior is that one of the clusters contains the majority of the queens (10 out of 16). On the other hand, the other 6 clusters are made of single queens. This is a similar trend in the greater boards except for 17-Queens, which is discussed in the following paragraphs.
In Figure 6.d, the GNC as applied to the 5-Queens problem, and the most stable clustered graph, is shown. 5-Queens has 25 nodes and 160 edges. The modularity score did not change across a relatively long period of time. The graph loses an edge in every step. One reason could be the symmetric structure of the edges. GNC results show that there are 7 clusters with a maximum modularity score of 0.07257812. Although the number of clusters is the same as the 4-Queens, a higher maximum modularity score is found for 5-Queens. There are 2 major clusters that have 8 and 12 nodes. The other 5 clusters have only one node.
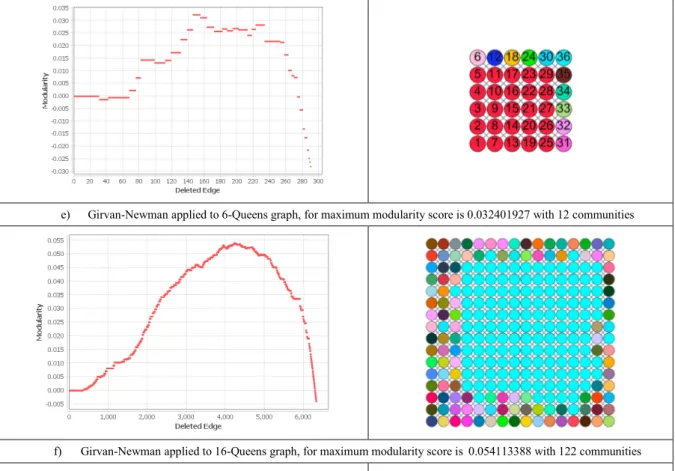
The next example, 6-Queens, is shown in Figure 6.e. The 6-Queens graph has 36 nodes and 290 edges. The 6-Queens graph has 15 clusters with 0.032401927 maximum modularity score. There is only one major community, which has 25 elements. This resembles from 5-Queens to 6-Queens added to the board weakens the connectivenes. All clusters have only one node, the major cluster.
ADYU Mühendislik Bilimleri Dergisi 12 (2020) 14-23
For greater board slides, the trend follows with an exception, that being 17-Queens. 16-Queens graph is built by 256 nodes and 6320 edges, and 18-Queens graph is built by 324 nodes and 9078 edges. 16-Queens and 18-Queens are divided 122 and 172 communities with the maximum modularity scores of 0.054113388 and 0.05395335, respectively. Both graphs are made of one major graph and many clusters with single nodes. The 17-Queens graph, on the other hand, has 289 nodes and 7616 edges, and it is divided into 82 clusters with 0.18264371 maximum modularity score. 12 of all clusters contain 17 nodes, which are aligned on the row on the board, so there are 12 major clusters. One cluster contains 16 nodes, which are similar in the same row. The rest of the clusters, 69 clusters, have one node only. Additionally, there is a steady drop in modularity score for every step of GNC after the maximum modularity score. GNC shows the central cells on the board have stronger relations than surrounding cells.
Similar clustering is seen for 27, and 28-Queens, and partially for 25, 26, and 29-Queens. This highlights the strong relationship for being in the same row, but that is not the case for the N-Queens problem.
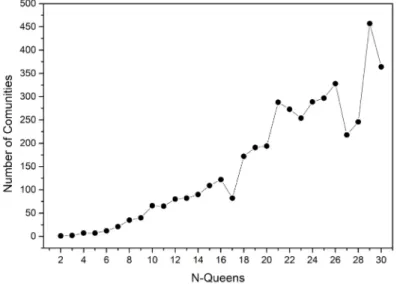
We have given some of the GNC applications in detail, but our investigation is not limited to them. The overall results are summarized in Figure 7 and Figure 8.
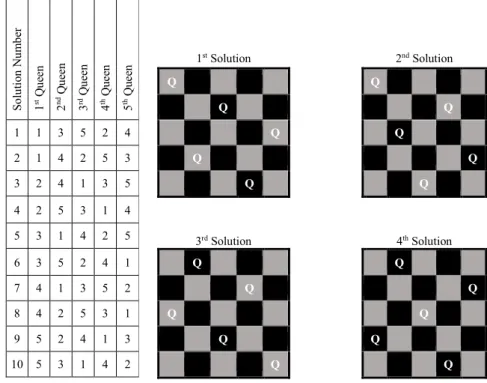
The results of the GNC tells us relational appropriateness to place queens. Figure 6.d presents a GNC application on 5-Queens. The result shows that the first 2 columns (or rows if we consider rotational symmetry) of the first 4 rows/columns are strongly related, and the next 3 columns/rows of the first 4 rows/columns are strongly related. This implies that the first two columns/rows cannot have queens closer to each other. Similarly, the next three columns/rows cannot have 3 queens close to each other.
In Figure 5, all 10 solutions of 5-Queens are listed in the form of arrays. Orders in the arrays show the row number, and the numbers stand for the column number of the particular queen. Additionally, the first 4 solutions are shown in the form of a board. In Figure 6.d, GNC results reflect the solution since placed queens column 1 and column 2 cannot be listed consecutively since they are in the same community (Green colored community). Likewise, columns 3, 4, and 5 cannot be listed one after the other (Purple colored community). This is clearly shown in the 5-Queens solutions.
So lu tio n N um be r 1 st Qu ee n 2 nd Qu ee n 3 rd Qu ee n 4 th Q ue en 5 th Q ue en 1 st Solution 2nd Solution Q Q Q Q 1 1 3 5 2 4 Q Q 2 1 4 2 5 3 Q Q 3 2 4 1 3 5 Q Q 4 2 5 3 1 4 3rd Solution 4th Solution 5 3 1 4 2 5 6 3 5 2 4 1 Q Q 7 4 1 3 5 2 Q Q 8 4 2 5 3 1 Q Q 9 5 2 4 1 3 Q Q 10 5 3 1 4 2 Q Q
ADYU Mühendislik Bilimleri Dergisi 12 (2020) 14-23
a) Girvan-Newman applied to 2-Queens graph, for maximum modularity score is 0.0 with 1 community
b) Girvan-Newman applied to 3-Queens graph, for maximum modularity score is 0.06122446 with 2 communities
c) Girvan-Newman applied to 4-Queens graph, for maximum modularity score is 0.012551993 with 7 communities
ADYU Mühendislik Bilimleri Dergisi 12 (2020) 14-23
e) Girvan-Newman applied to 6-Queens graph, for maximum modularity score is 0.032401927 with 12 communities
f) Girvan-Newman applied to 16-Queens graph, for maximum modularity score is 0.054113388 with 122 communities
g) Girvan-Newman applied to 17-Queens graph, for maximum modularity score is 0.18264371 with 82 communities
h) Girvan-Newman applied to 18-Queens graph, for maximum modularity score is 0.05395335 with 172 communities Figure 6 Girvan- Newman Clustering algorithm is applied N-Queens (N=2-6 and 16-18) graphs
ADYU Mühendislik Bilimleri Dergisi 12 (2020) 14-23
GNC algorithm is a machine learning algorithm that extracts information from a network of data. We intend to understand the strength of queens’ relations when they are placed on the board. When we emphasize the boundaries between cells, we can develop a divide-and-conqueror algorithm to solve the N-Queens problem. The GNC algorithm extracts the cluster by edge betweenness and modularity score of the graph.
In Figure 7, the maximum modularity score increases slowly with an increase in board size compared to the increase in the number of clusters (See Figure 8). This emphasizes that the stability of the clusters is similar to increasing the board size with the number of communities. Additionally, 17-Queens have an intense peak with a comparatively small decrease in the number of communities.
Figure 8 shows the number of clusters. There is a dramatic increase with respect to the board size because of the number of one node clusters.
Figure 7. The maximum modularities from 2 to 30-Queens graphs by the Girvan-Newman Clustering
algorithm
Figure 8. The number of communities from 2 to 30-Queens graphs by the Girvan-Newman Clustering
algorithm
5. Conclusion
In this paper, we have applied the Girvan-Newman Clustering algorithm to extract the functional relations between queens. The purpose was to open new paths for algorithms to solve the N-Queens
ADYU Mühendislik Bilimleri Dergisi 12 (2020) 14-23
problem. Application results show no explicit correlation between the board size and the number of communities in the scope of our range.
The examination of Queen graphs shows no direct relationship with the number of communities and the maximum modularity score. Thus, it extracts irregularity about the relations.
In future studies, we purpose to develop an algorithm to solve the N-Queens problem under the light of this study. The core of the planned algorithm is based on the divide-and-conqueror by communities identified in the Girvan-Newman Clustering algorithm. Dividing to the small parts is not a common case for combinatorics problems.
Acknowledgment
The authors declare no conflict of interest.
References
[1] C. F. Gauß, H. C. Schumacher, and C. A. F. Peters, Briefwechsel zwischen. Altona: Esch, 1860.
[2] J. Gingsburg, "Gauss's arithmetrization of the problem of n queens," Scripta Math. 5, pp. 63-66, 1939.
[3] G. Polya, "Uber die 'doppelt-periodischen' losungen des n-damen-problems," Mathematische Unterhaltungen und Spiele, pp. 364-374, 1918.
[4] É. Lucas, Recreations mathematiques. Vol. 4. Paris: Blanchard, 1960.
[5] V. Torggler, P. Aumann, H. Ritsch, and W. Lechner, "A Quantum N-Queens Solver," Quantum, vol. 3, 03/02 2018.
[6] F. Souza and F. Mello, "N-Queens Problem Resolution Using the Quantum Computing Model," IEEE Latin America Transactions, vol. 15, pp. 534-540, 03/01 2017.
[7] A. Draa, S. Meshoul, H. Talbi, and M. Batouche, "A Quantum-Inspired Differential Evolution Algorithm for Solving the N-Queens Problem," Int. Arab J. Inf. Technol., vol. 7, pp. 21-27, 01/01 2010.
[8] S. Ss, R. Stephen, and V. Irudayaraj, "Survey on N-Queen Problem with Genetic Algorithm," INTERNATIONAL JOURNAL OF COMPUTER SCIENCES AND ENGINEERING, vol. 6, pp. 54-58, 03/01 2018.
[9] S. Nag and U. Sarkar, "An Adaptive Genetic Algorithm for Solving N-Queens Problem," 12/21 2017.
[10] E. Cengiz, S. Seyed, and T. Murat, "Different perspectives of the N-Queens problem," in Proceedings of the, A. C. M. annual conference Communications, ACM, 2 Penn Plaza, Suite 701, New York, NY 10121-0701, USA, 1992.
[11] Z. Wang, D. Huang, J. Tan, T. Liu, K. Zhao, and L. Li, "A parallel algorithm for solving the n-queens problem based on inspired computational model," (in English), Bio Systems, vol. 131, pp. 22-9, 2015.
[12] M. Girvan and M. E. J. Newman, "Community structure in social and biological networks," vol. 99, no. 12, pp. 7821-7826, 2002.
[13] S. Güldal, "Connectives of Knights Covering Problem By Girvan-Newman Clustering," presented at the SDPS 2019 Workshop, Madrid, Spain, 25-26, November 2019,
[14] M. E. J. J. T. E. P. J. B. Newman, "Detecting community structure in networks," journal article vol. 38, no. 2, pp. 321-330, March 01 2004.
[15] S. C. J. P. Johnson, "Hierarchical clustering schemes," journal article vol. 32, no. 3, pp. 241-254, September 01 1967.
[16] M. E. J. Newman, "Fast algorithm for detecting community structure in networks," Physical Review E, vol. 69, no. 6, p. 066133, 06/18/ 2004.
[17] L. Lee Johnson, C. B. Borkowf, and P. A. Shaw, "Chapter 21 - Hypothesis Testing," in Principles and Practice of Clinical Research (Third Edition), J. I. Gallin and F. P. Ognibene, Eds. Boston: Academic Press, 2012, pp. 255-270.
ADYU Mühendislik Bilimleri Dergisi 12 (2020) 14-23
[18] G. Ouyang, D. K. Dey, and P. J. J. o. C. Zhang, "Clique-Based Method for Social Network Clustering," journal article April 02 2019.
[19] M. Bastian, S. Heymann, and M. Jacomy, "Gephi: an open source software for exploring and manipulating networks," in International AAAI Conference on Weblogs and Social Media, 2009.
[20] M. E. J. Newman, "Modularity and community structure in networks," vol. 103, no. 23, pp. 8577-8582, 2006.