www.arccjournals.com/www.legumeresearch.in
*Corresponding author’s e-mail: [email protected].
1Department of Crop and Animal Production,Vocational School of Technical Sciences, University of Bingol, Turkey. 2Department of Animal Science, Faculty of Agriculture, University of Bingol, Turkey.
3Department of Landscape and Ornamental Plants, Vocational School of Technical Sciences, University of Bingol, Turkey.
Print ISSN:0250-5371 / Online ISSN:0976-0571
Examination of plant length, dry stem and dry leaf weight of bitter vetch
[Vicia ervilia (L.) Willd.] with some non-linear growth models
Adil Bakoglu1, Senol Celik2, Kagan Kokten* and Omer Kilic3 Department of Field Crops, Faculty of Agriculture,
University of Bingol, Turkey.
Received: 31-12-2015 Accepted: 06-05-2016 DOI:10.18805/lr.v0iOF.11182
ABSTRACT
In this study, the aim is to determine the best model for plant length, dry stem and dry leaf weight in different species of bitter vetch by using non-linear growth models. In the study, IFVE 3977-SEL 2802, HAT-14, IFVE 3977-SEL 2802 and Mardin Population bitter vetch species were used as materials. Bertalanffy, Logistic, and Gompertz models were used. At the end of the study, the best models identifying plant length of bitter vetch Logistic in IFVE 3977-SEL 2802 species and Bertalanffy model in IFVE 3351-SEL 2804, HAT-14 and Mardin Population species. Dry stem weight was identified best with Logistic model in IFVE 3977-SEL 2802 and HAT-14 species, Bertalanffy model in IFVE 3351-SEL 2804 and Gompertz model in Mardin population species. Dry leaf weight was identified best with Gompertz model in IFVE 3977-SEL 2802 and Mardin Population, Logistic model in IFVE 3351-SEL 2804 and HAT 14 species.
Key words: Bitter vetch, Growth models, Plant characteristics. INTRODUCTION
The gene center of bitter vetch [Vicia ervilia (L.)Willd.], a type of forage legumes, is grown in the Mediterranean countries (Vavilov, 1949). The bitter vetch, which is an annual plant, has a length of 20-60 centimeters (Soya et al., 2004).
Bitter vetch is generally cultivated for its grains and can be found in every part of Turkey except Northeast Anatolian region (Davis, 1969). Bitter vetch seed is a precious source of concentrate feed and especially used in feeding breeding bulls (Saglamtimur et al., 1998).
Among the landraces collected from different parts of Turkey, plants which have best yield and can be suitable for mechanized agriculture were selected. To that end, Ekiz and Ozkaynak (1984) examined 51 landraces and stated these landraces had great differences in morphological, biological and agricultural characteristics. In the later studies where relatively good plants were chosen (Ekiz, 1988; Ayhan, 1989; Ev and Ekiz, 1994), baselines with better characteristics like plant length, sub-vetch length and seed yield were revealed. There have been studies on identification of growth in plants by using mathematical models. Some researchers made mathematical modeling in growth in some plants as following: Zur et al. (1983) in soy bean; Dwyer and Stewart (1986) and Cerreto and Blackmer (1990) in corn; Joliffe et
al. (1988) in orchard grass and perennial ryegrass; Mustears
(1989) in underground clover; Damgaard et al. (2002) in
White goosefoot; Zahedi and Jenner (2003) in wheat. Karadavut and Tozluca (2005) stated that above ground fresh and dry weight and underground fresh and dry weight of rye was identified better by Weibull model and underground dry weight was identified better by Richards model. Tezel et al. (2005) examined the growth of wheat by using Richards, Logistic, MMF and Gompertz models. Karadavut et al. (2010a) stated that dry matter accumulation in corn, silage corn and corn grains, was best identified by Richards model. Karadavut et al. (2010b) stated that the growth of corn was identified better by Richards, Logistic and Gompertz models than other non-linear models.
The aim of this study is to model plant length, dry stem and dry leaf weights of 4 types of bitter vetch by using growth models and to compare bitter vetch types.
MATERIALS AND METHODS
This study was conducted in Bingol University Faculty of Agriculture Research and Application field, in 2014 and 2015. Tentative ran domized blocks were established 3 times repetitively according to experimental design. Three plants (IFVE 3977-SEL 2802, IFVE 3351-SEL 2804 and HAT-14) of the plant materials which wer e used in experiment were provided from GAP International Agricultural Research and Training Centre, one plant (Mardin Population) was provided from a farmer who was engaged in agriculture. In bitter vetch genotypes which were examined, plant length, dry stem weight and dry leaf weight were measured on a weekly basis in two years,
starting appr oximately a mon th after October, and measurements were taken for 6 weeks. Measurements were made by collectin g th ree plants fr om each par cel. Calculations were made over 2 years average of plant length (cm), dry stem weight (g) and dry leaf weight (g) variables’ mean values.
In the study, Bertalanffy (Beverton and Holt, 1957), Logistic (Graybill and Iyer, 1994) and Gompertz (Winsor, 1932) models were used to examine plant length, dry stem and dry leaf weight of 4 different species of bitter vetch for weeks. Parameter values of the models were given as Coefficient of Determination (R2), Adjusted Coefficient of Determination (Adj-R2), Mean Square Error (MSE) and Basic Mean Square Error (BMSE).
Statistical analyses were made by using SPSS 22.0 statistical program. During iteration, 1.0 E-8 was used as convergence criterion (Akbas et al., 2001)
RESULTS AND DISCUSSION
Plant length: In the study the plant length of IFVE
3977-SEL 2802, IFVE 3351-3977-SEL 2804,HAT-14 and Mardin Population types of bitter vetch wer e examin ed. Measurement values related to plant lengths and standard errors are given in Table 1 and Table 2.
Dry stem weight: Measurement values of the dry stem
weight (g) of IFVE 3977-SEL 2802, IFVE 3351-SEL 2804, HAT-14 and Mardin Population types of bitter vetch and standard errors are given in Table 3 and Table 4.
Dry leaf weight: Measurement values of dry stem weight
(g) of IFVE 3977-SEL 2802, IFVE 3351-SEL 2804, HAT-14 and Mardin Population types of bitter vetch and standard errors are given in Table 5 and Table 6.
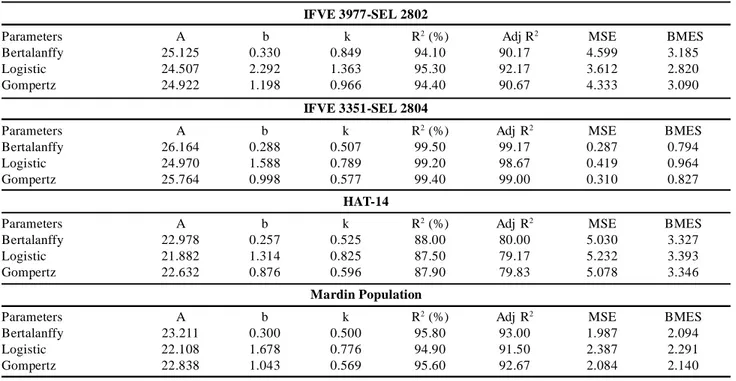
As seen in Table 2, in IFVE 3977-SEL 2802 type of bitter vetch in Bertalanffy model the findings were as follows: R2=94.10, Adj-R2=90.17, MSE=4.599 an d
IFVE 3977-SEL 2802
Parameters A b k R2 (%) Adj R2 MSE BMES
Bertalanffy 25.125 0.330 0.849 94.10 90.17 4.599 3.185
Logistic 24.507 2.292 1.363 95.30 92.17 3.612 2.820
Gompertz 24.922 1.198 0.966 94.40 90.67 4.333 3.090
IFVE 3351-SEL 2804
Parameters A b k R2 (%) Adj R2 MSE BMES
Bertalanffy 26.164 0.288 0.507 99.50 99.17 0.287 0.794
Logistic 24.970 1.588 0.789 99.20 98.67 0.419 0.964
Gompertz 25.764 0.998 0.577 99.40 99.00 0.310 0.827
HAT-14
Parameters A b k R2 (%) Adj R2 MSE BMES
Bertalanffy 22.978 0.257 0.525 88.00 80.00 5.030 3.327
Logistic 21.882 1.314 0.825 87.50 79.17 5.232 3.393
Gompertz 22.632 0.876 0.596 87.90 79.83 5.078 3.346
Mardin Population
Parameters A b k R2 (%) Adj R2 MSE BMES
Bertalanffy 23.211 0.300 0.500 95.80 93.00 1.987 2.094
Logistic 22.108 1.678 0.776 94.90 91.50 2.387 2.291
Gompertz 22.838 1.043 0.569 95.60 92.67 2.084 2.140
Table 2: Plant length model parameters of bitter vetch.
A, b, k: Model parameters, (A:Asymptoticlength; b: Integration constant, k: Maturing index, R2: Determination coefficients, Adj R2: Adjusted determination coefficients, MSE: Residual Mean of Squares, BMES: Mean of Basic Square Error.
Table 1: Plant length statistics of bitter vetch
IFVE 3977-SEL 2802 IFVE3351-SEL 2804 HAT-14 Mardin Population
Week 1 8.150 1.076 9.367 0.638 9.400 0.721 7.550 0.775 2 14.083 1.332 15.000 1.317 13.417 0.898 13.667 0.910 3 22.500 1.565 18.667 0.989 19.833 1.108 16.333 0.709 4 24.000 2.309 22.000 2.049 19.583 1.753 19.583 1.695 5 22.083 2.973 22.667 2.092 17.917 1.791 18.833 2.774 6 25.550 3.498 24.730 3.926 23.637 3.290 22.587 2.992
IFVE 3977-SEL 2802 IFVE 3351-SEL 2804 HAT-14 Mardin Population Week 1 0.025 0.002 0.027 0.004 0.020 0.005 0.017 0.001 2 0.092 0.009 0.104 0.018 0.145 0.097 0.069 0.008 3 0.328 0.058 0.260 0.040 0.259 0.034 0.202 0.028 4 0.752 0.150 0.423 0.075 0.467 0.149 0.415 0.055 5 0.722 0.213 0.638 0.143 0.483 0.161 0.715 0.513 6 0.937 0.157 0.963 0.370 0.890 0.219 1.227 0.339
Table 3: Dry straw weight statistics of bitter vetch
FVE 3977-SEL 2802
Parameters A b k R2 (%) Adj R2 MSE BMES
Bertalanffy 1.024 2.442 0.726 98.10 96.83 0.005 4.233
Logistic 0.894 404.406 1.849 98.80 98.00 0.003 3.353
Gompertz 0.949 23.075 1.066 98.40 97.33 0.004 3.507
IFVE 3351-SEL 2804
Parameters A b k R2 (%) Adj R2 MSE BMES
Bertalanffy 7.003 0.936 0.110 99.92 99.87 0.00018 0.993
Logistic 1.375 56.759 0.813 99.70 99.50 0.002 1.858
Gompertz 2.644 5.696 0.288 99.89 99.82 0.00024 0.993
HAT-14
Parameters A b k R2 (%) Adj R2 MSE BMES
Bertalanffy 3445.005 0.982 0.008 88.90 81.50 0.017 10.515
Logistic 589.830 104.364 0.451 89.60 82.67 0.016 10.247
Gompertz 9176.424 12.170 0.045 89.50 82.50 0.016 10.111
Mardin Population
Parameters A b k R2 (%) Adj R2 MSE BMES
Bertalanffy 10294.210 0.998 0.008 98.70 97.83 0.004 4.377
Logistic 365.243 124.588 0.621 99.18 98.63 0.0028 3.494
Gompertz 5021.337 12.536 0.068 99.20 98.67 0.0027 3.687
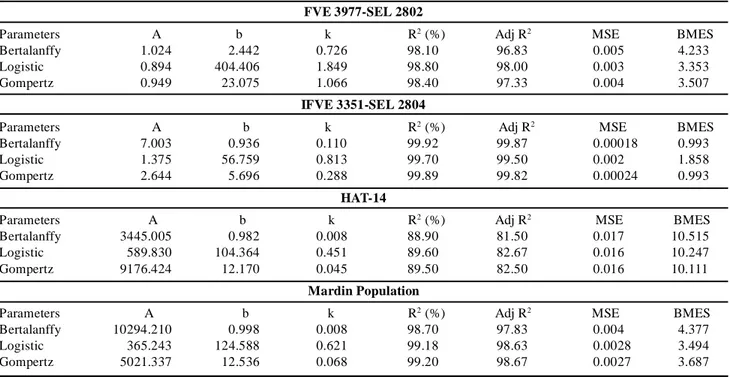
Table 4: Model parameters of dry stem weight of bitter vetch.
IFVE 3977-SEL 2802 IFVE 3351-SEL 2804 HAT-14 Mardin Population
Week 1 0.055 0.008 0.226 0.152 0.055 0.014 0.123 0.074 2 0.172 0.012 0.164 0.011 0.089 0.010 0.144 0.053 3 0.393 0.058 0.303 0.033 0.388 0.062 0.303 0.049 4 1.195 0.198 0.662 0.090 0.548 0.134 0.590 0.084 5 1.070 0.180 1.152 0.401 0.595 0.154 1.013 0.210 6 2.043 0.757 0.987 0.365 1.238 1.179 1.300 0.306
Table 5: Dry leaf weight statistics of bitter vetch
BMSE=3.185. Growth rate was 0.849 g. In Logistic model, the findings were as follows: R2=95.30, Adj-R2=92.17, MSE=3.612 and BMSE=2.820. The growth rate was 1.363 g. In Gompertz model, the findings were as follows: R2=94.40, Adj-R2=90.67, MSE=4.333 and BMSE=3.090. The growth was 1.198. When plant lengths in IFVE 3977-SEL 2802 types of bitter vetch were compared; in Logistic
model, R2, Adj-R2 values were highest and MSE and BMSE values were the lowest. In IFVE 3977-SEL 2802 types of bitter vetch, plant length was identified best by Logistic model.
In IFVE 3351-SEL 2804 type, the findings by Bertalanffy model: R2=99.50, Adj-R2=99.17, MSE=0.287, BMSE=0.794 and the growth rate was 0.507. In Logistic
IFVE 3977-SEL 2802
Parameters A b k R2 (%) Adj R2 MSE BMES
Bertalanffy 11064.790 0.984 0.008 98.40 97.33 0.014 4.583
Logistic 142.554 1150.368 0.562 98.78 97.97 0.011 4.004
Gompertz 5693.047 10.949 0.064 98.82 98.03 0.010 4.040
IFVE 3351-SEL 2804
Parameters A b k R2 (%) Adj R2 MSE BMES
Bertalanffy 4.866 0.740 0.129 81.60 69.33 0.054 12.373
Logistic 1.229 24.687 1.067 85.00 75.00 0.044 11.111
Gompertz 2.050 3.405 0.342 82.40 70.67 0.052 12.040
HAT-14
Parameters A b k R2 (%) Adj R2 MSE BMES
Bertalanffy 31230.354 0.990 0.005 93.80 89.67 0.020 8.684
Logistic 110.369 15.110 0.560 95.80 93.00 0.013 7.159
Gompertz 119.588 14.448 0.045 95.50 92.50 0.014 7.622
Mardin Population
Parameters A b k R2 (%) Adj R2 MSE BMES
Bertalanffy 1522.463 0.968 0.014 96.20 93.67 0.015 6.293
Logistic 2.004 36.138 0.852 97.10 95.17 0.012 5.686
Gompertz 10.275 5.184 0.187 96.50 94.17 0.014 6.337
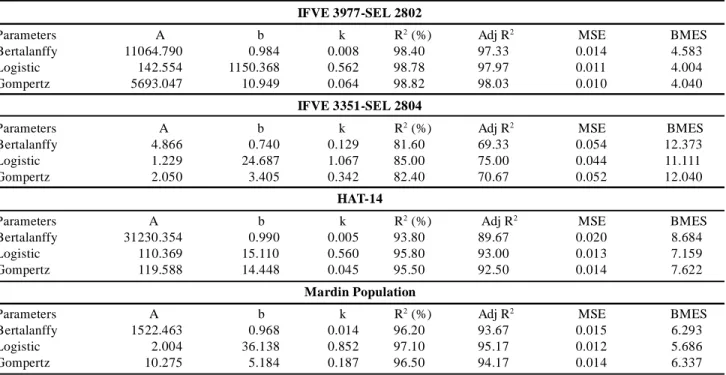
Table 6: Model parameters of dry leaf weight of bitter vetch.
model: R2=99.20, Adj-R2=98.67, MSE=0.419, BMSE=0.964 and the growth rate was 0.789. In Gompertz model: R2=95.60, Adj-R2=92.67, MSE=2.390, BMSE =2.291 and the growth rate was 0.577. In IFVE 3977-SEL 2802 types of bitter vetch plant length was identified best by Bertalanffy model.
In HAT 14 type, the findings by Bertalanffy model: R2=88.00, Adj-R2=80.00, MSE=5.030, BMSE=3.327 and the growth rate was 0.525. In Logistic model: R2=87.50, Adj-R2=79.17, MSE=5.232, BMSE=3.393 and the growth rate was 0.825. In Gompertz model: R2=87.90, Adj-R2=79.83, MSE=5.078, BMSE =3.346 and the growth rate was 0.596. In HAT 14 types of bitter vetch plant length was identified best by Bertalanffy model.
In Mardin Population type, the findings by Bertalanffy model: R2=95.80, Adj-R2=93.00, MSE=1.987, BMSE=2.094 and the growth rate was 0.500. In Logistic model: R2=94.90, Adj-R2=91.50, MSE=2.387, BMSE=2.291 and the growth rate was 0.776. In Gompertz model: R2=95.60, Adj-R2=92.67, MSE=2.084, BMSE =2.140 and the growth rate was 0.569. In Mardin Population types of bitter vetch plant length was identified best by Bertalanffy model.
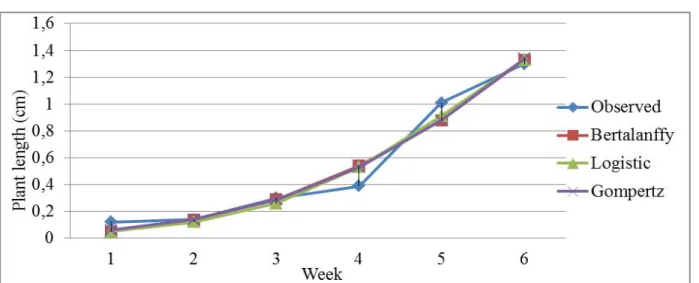
In the research, observed values of the plant length of IFVE 3977-SEL 2802, IFVE 3351-SEL 2804, HAT-14 and Mardin Population types and the estimated values that were provided by means of 3 different growth models are given respectively in Figure (Fig) 1, 2, 3 and 4.
Fig 3: Plant length for HAT-14cultivar. Fig 2: Plant length for IFVE 3351-SEL 2804 cultivar.
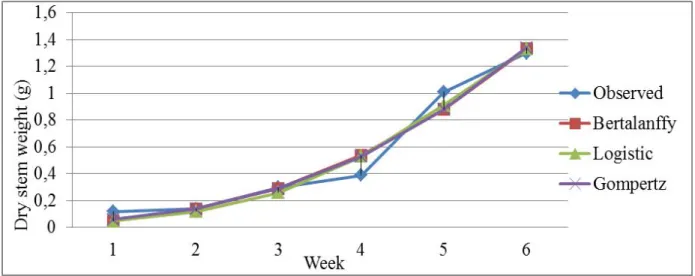
As seen in Table 4, in IFVE 3977-SEL 2802 type of bitter vetch in Bertalanffy model the findings were as follows: R2=98.10, Adj-R2=96.83, MSE=0.005 and BMSE=4.233. The growth rate was 0.726 g. In Logistic model the findings were as follows: R2=98.80, Adj-R2=98.00, MSE=0.003 and BMSE=3.353. The growth rate was 1.849 g. In Gompertz model, the findings were as follows: R2=98.40, Adj-R2=97.33, MSE=0.004 and BMSE=3.507. The growth rate was 1.066 g. Amongst the growth models concerning dry stem weight in IFVE 3977-SEL 2802 types of bitter vetch, the best model was Logistic model. In these types of bitter vetch, the one which identified dry stem weight the least was Bertalanffy model.
In IFVE 3351-SEL 2804 type, in Bertalanffy model the findings were as follows: R2=99.92,Adj-R2=99.87, MSE=0.00018, BMSE=0.993 and the growth rate was 0.110. In Logistic model, the findings were R2=99.70, Adj-R2=99.50, MSE=0.002, BMSE=1.858 and the growth rate was 0.813. In Gompertz model, the findings were R2=99.89, Adj-R2=99.82, MSE=0.00024, BMSE=0.993 and the growth rate was 0.288. The best model for dry stem weight in IFVE 3351-SEL 2804 type of bitter vetch was Bertalanffy model while Logistic model was the worst.
In HAT-14 type, in Bertalanffy model, the findings were R2=88.90, Adj-R2=81.50, MSE=0.017, BMSE= 10.515 and the growth rate was 0.008. In Logistic model, the findings were R2=89.60, Adj-R2=82.67, MSE=0.016, BMSE=10.247 and the growth rate was 0.451. In Gompertz model, the findings were R2=89.50, Adj-R2=82.50, MSE=0.016, BMSE=10.111 and the growth rate 0.045. The best model which identified dry stem weight in HAT-14 type of bitter vetch was Logistic model; the worst model was Bertalanffy model.
In Mardin Population type, in Bertalanffy model, the findings were R2=98.70, Adj-R2=97.83, MSE=0.004,
BMSE=4.377 and the growth rate was 0.008. In Logistic model, the findings were R2=99.18, Adj-R2=98.63, MSE=0.0028, BMSE=3.494 and the growth rate was 0.621. In Gompertz model, the findings were R2=99.20, Adj-R2=98.67, MSE=0.0027, BMSE=3.687 and the growth rate was 0.068. In Mardin population type of bitter vetch the best model which identified dry stem weight was Gompertz models and Bertalanffy model identified dry stem weight the least. Logistic model was the second best model to identify dry stem weight.
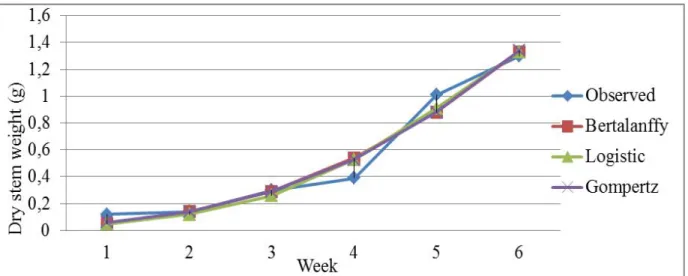
Observed values of dry stem weight in IFVE 3977-SEL 2802, IFVE 3351-3977-SEL 2804, HAT-14 and Mardin Population types and the estimated values that were provided by means of 3 different growth models are given respectively in Fig 5, 6, 7 and 8.
In IFVE 3977-SEL 2802 type, R2 (%) values for Bertalanffy, Logistic and Gompertz models were respectively 98.40, 98.78 and 98.82. According to the same models, Adj-R2 values were respectively 97.33, 97.97 and 98.03; and MSE values were respectively 0.014, 0.011 and 0.0107. BMSE values were respectively 4.583, 4.004 and 4.040. In IFVE 3977-SEL 2802 type, dry leaf weight was identified best by Gompertz model.
In IFVE 3351-SEL 2804 type, R2 (%) values for Bertalanffy, Logistic and Gompertz models were respectively 81.60, 85.00 and 82.40. According to the same models, Adj-R2 values were respectively 69.33, 75.00 and 70.67. MSE values were respectively 0.054, 0.044 and 0.052. BMSE values were respectively 12.373, 11.111 and 12.040. In IFVE 3977-SEL 2804 type dry leaf weight was identified best by Logistic model.
In HAT-14 type, R2 (%) values for Bertalanffy, Logistic and Gompertz models were respectively 93.80, 95.80 and 95.50. According to the same models Adj-R2 values were respectively 89.67, 93.00 and 92.50. MSE values
Fig 7: Dry stem weight (g) for HAT-14cultivar.
Fig 8: Dry stem weight (g) for Mardin population cultivar. Fig 6: Dry stem weight (g) for IFVE 3351-SEL 2804 cultivar.
were respectively 0.020, 0.013 and 0.034. BMSE values were respectively 8.684, 7.159 and 7.622. In Hat-14 type, dry leaf weight was identified best by Logistic model.
In Mardin Population type, R2 (%) values for Bertalanffy, Logistic and Gompertz models were respectively 98.70, 99.18 and 99.20. According to the same models Adj-R2 values were respectively 97.83, 98.63 and 98.67. MSE values were respectively 0.004, 0.0028 and 0.0027. BMSE values were respectively 4.377, 3.494 and 3.687. In Mardin Population type, dry leaf weight was identified best by Gompertz model.
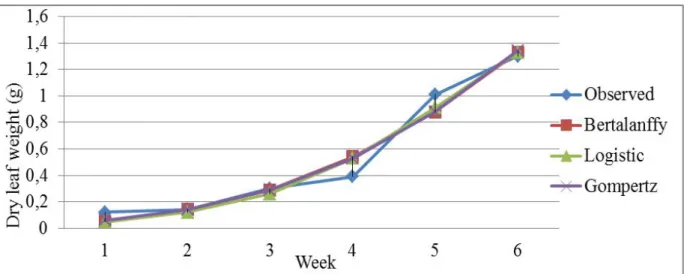
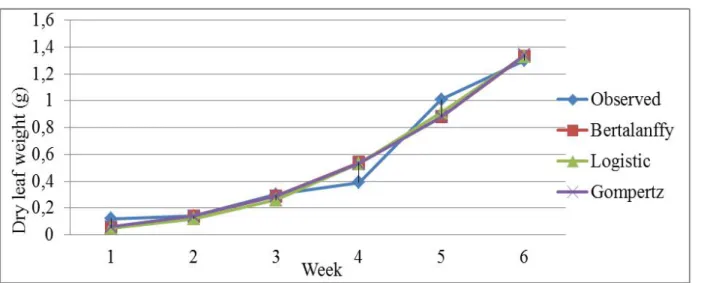
Observed values of dry leaf weight in IFVE 3977-SEL 2802, IFVE 3351-3977-SEL 2804, HAT-14 and Mardin Population types and graphics of the estimated values that were provided by means of 3 different growth models were given respectively in Fig. 9,10, 11 and 12.Gregorczyk (1994), identified leaf area (cm2) growth in corn with Richards model and he found R2=0.995. Tezel et al. (2005) studied on jointed
Fig 10: Measured and estimated values of dry leaf weight of IFVE 3351-SEL 2804 species. Fig 9: Measured and estimated values of dry leaf weight of IFVE 3977-SEL 2802species.
goatgrass’ effects on growth in wheat by applying multiple herbicides, and stated that growth in Daðdaþ-94 type of wheat was modeled better by Logistic model. Karadavut et al. (2010b) found the highest R2 values for relative growth rates in silage corn types with the help of Weibull model. Karadavut et al. (2010c) examined growth models related to leaf length in corn in a comparative way. Profen 1550 type of corn leaf length was identified better by Gompertz model; Monton, Ranchero, TTM 81-19 and 35 P 12 types of corn leaf length was identified better by Richards model. In all types, models were generally compatible with each other in terms of plant characteristics. When they were compared with each other in terms of model determination criteria, it was seen that these criteria values between the model which identified best and the model which identified least were so close to each other. Generally, it was seen that plant length, dry stem and dry leaf weight in bitter vetch were identified by different growth models according to types.
Fig 12: Measured and estimated values of dry leaf weight of Mardin population Fig 11: Measured and estimated values of dry leaf weight of HAT-14species.
REFERENCES
Akbas, Y., Akbulut, O., Tuzemen, N. (2001). Growth of Holstein cows in high altitude of Turkey. Indian Journal Animal
Science,71: 476-479.
Ayhan, E. (1989). Investigations on some agricultural properties of bitter vetch [Vicia ervilia (L.) Willd.]. (Unpublished M.Sc). Institute of Science and Technology, University of Ankara.
Beverton, R.J.H., Holt, S.J. (1957). On the dynamics of exploited fish populations. Fish. Invest. Minist. Agric. Fish. Food. G. B. (2 sea fish) (Ser. 2), 19: 533p.
Cerrato, M.E., Blackmer, A.M. (1990). Comparison of model for comparison yield responseto nitrogen fertilizer. Agronomy
Journal, 82: 138-143.
Damgaard, C., Weiner, J., Nagashima, H. (2002). Modeling individual growth and competitionin plant populations: growth curves of Chenopodium album at two densities. Journal of Ecology, 9: 666-671.
Davis, P.H. (1969). Flora of Turkey-3. Edinburgh University Press, 3, p600.
Dwyer, L.M., Stewart, D.W. (1986). Leaf area development in field-grown maize. Agronomy Journal, 78: 334-343. Ekiz, H. (1988). The Comparison of some agricultural properties in bitter vetch (Vicia ervilia (L.) Willd.) line. Ankara
University Agriculture Faculty Lesson Book:1098. Scientific Research and Surveys, 196.
Ekiz, H., Ozkaynak, I. (1984). Studies on important morphological, biological and agricultural characters of some bitter vetch (Vicia ervilia (L.) Willd.) varieties that grown in Turkey. Institute of Science and Technology, University of Ankara Pub. No: 5.
Ev, B.K., Ekiz, H. (1994). The effect of sowing rate on yield and yield components of bitter vetch [Vicia ervilia (L.) Willd.]. Journal of Agriculture, 3: 35-43.
Gregorczyk, A. (1994). Application of the Richards function to the description of leaf area growth in maize (Zea mays L.).
Acta Societatis Botanicorum Poloniae, 63: 5-7.
Graybill, F.A., Iyer, H.K. (1994). Regression analysis: concepts and applications. Hardcover, ISBN-13: 978-0534198695 ISBN-10: 0534198694 Edition: 1st.
Joliffe, I.T., Jones, B., Morgan, B.J.T. (1988). Stability and influence in cluster analysis. Data Analysis and Informatics (eds E. Diday et al.), 5: 507-514. Amsterdam: North-Holland.
Karadavut, U., Tozluca, A. (2005). Growth analysis some characters in rye plants (Secale cereale L.) growth of root and upper ground parts. Journal of Crop Research, 2: 1-10.
Karadavut, U., Genc, A., Tozluca, A., Palta, C. (2008). Analysis of dry matter accumulation using some mathematical growth models in silage and seed corns. Journal of Agriculture Science, 16: 89-96.
Karadavut, U., Kokten, K., Kavurmaci, Z. (2010a). Comparison of relative growth rates in silage corn cultivars. Asian
Journal of Animal and Veterinary Advances, 5: 223-228.
Karadavut, U., Palta, C., Kokten, K., Bakoglu, A. (2010b). Comparative study on some non-linear growth models for describing leaf growth of maize. International Journal of Agriculture Biology, 12: 227–230.
Mustears, H.J.W. (1989). A dynamic equation for plant interaction and application to yield-density-time relations. Annals
of Botany, 64: 521-531.
Saglamtimur, T., Tansi, V., Baytekin, H. (1998). Cultivation of forage crops. Cukurova University Agriculture Faculty Lesson Book : C-74.
Soya, H., Avcioglu, R., Geren, H. (2004). Forage Crops. Hasad Yayincilik Ltd. Sti., Istanbul, p223.
Tezel, M., Karadavut, U., Palta, C., Aksoyak, S. (2005). Control of jointed goatgrass (Aegilops cylindirica Host.) with herbicide and determination of effecting onwheat plants. Journal of Crop Research, 2: 11–14.
Vavilov, N.I. (1949). Theorijin, variation, immunity and breeding of cultivated plants. Choronica Botanica, 13: 32-35. Winsor, C.P. (1932). The Gompertz curve as a growth curve. Proc. National Academy of Science. Vol. 18: No.1.
Zahedi, M., Jenner, C.F. (2003). Analysis of effects in wheat of high temperature on grain filling attributes estimated from mathematical models of grain filling. Journal of Agric. Sci., 141: 203-212.
Zur, B., Jones, J.W., Boote, K.J. (1983). Field evaluation of a water relation model for soybean. I. Validation of some basic assumptions. Agronomy Journal, 75: 272-280.