www.betam.bahcesehir.edu.tr
1
HIGH GROWTH but RAPID DECLINE
Seyfettin Gürsel*, Zümrüt İmamoğlu†, ve Barış Soybilgen‡
Executive Summary
According to data released by Turkstat, annual growth of real GDP in Turkey in 2011 was 8.5 percent. This high growth places Turkey as the 3rd amongst the fastest growing countries in G-20, behind China and Argentina. However, growth in the fourth quarter was not as promising. Real GDP increased by only 0.6 percent in the fourth quarter of 2011 from the previous quarter and the year-on-year (YoY) growth slowed down sharply from 8.4 percent in the third quarter to 5.2 percent in the fourth quarter.
In 2011, the main source of growth was again domestic demand like it was last year. However, while domestic demand accelerated in the first half of 2011, it decelerated in the second half. In the first two quarters, private investment and consumption expenditure made the largest contribution to real GDP growth, but in the third and fourth quarters, private investment and consumption expenditure slowed down and net exports contributed positively. The divergence between foreign and domestic demand shows that “soft landing” has begun in the economy. However, even though the increase in the current account deficit came to a stop in the fourth quarter, the ratio of current account deficit to GDP has reached a record-high 10 percent.
In the fourth quarter, the slowdown can be seen in almost all components of GDP. The decline in the GDP growth was mainly caused by the fall in private consumption expenditure. This was followed by a slowdown in investment demand and a decrease in government expenditures. Net exports contributed positively to the real GDP growth, exports decelerated, but imports decreased significantly.
•
Prof. Dr. Seyfettin Gürsel, Betam, Director [email protected]
†
Zumrut Imamoglu, Betam, Research Associate zumrut.ı[email protected]
‡
Baris Soybilgen, Betam, Research Assistant [email protected]
Betam’s and Turkstat’s seasonal and calendar day adjusted annual GDP growth numbers are very close to each other, but quarter on quarter (QoQ) GDP growth numbers show differences. Betam’s QoQ GDP growth for the fourth quarter was -0.4 percent. It means that real GDP didn’t just slow down, but also contracted.
Figure 1: Change of GDP components in 2011 from the previous year
Seasonally Adjusted Indicators
Imports Exports Government Spending Investment Consumption 0% 4% 8% 12% 16% 20% 24% 28%
Source: Turkstat, Betam.
Figure 2: Contributions of GDP compenents to 2011 GDP growth
Seasonally Adjusted Indicators
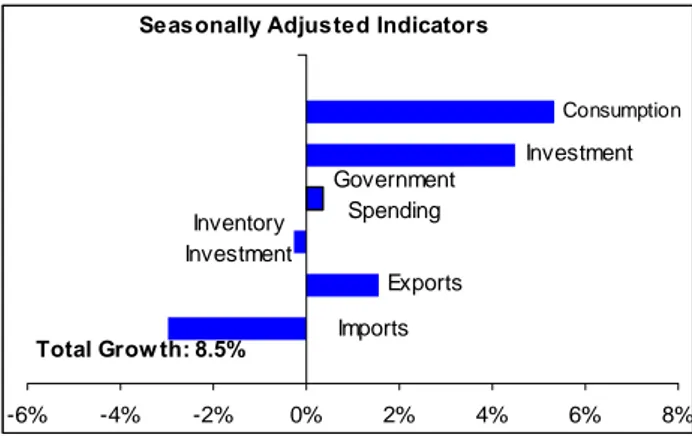
Imports Exports Inventory Investment Government Spending Investment Consumption -6% -4% -2% 0% 2% 4% 6% 8% Total Grow th: 8.5%
Source: Turkstat, Betam.
Growth Review: 2011, 4
th
Quarter
www.betam.bahcesehir.edu.tr
2
On the way to recovery: Economy slowing down,current account deficit decreasing
Turkey’s economy grew by 8.5 percent in 2011. In 2011, the source of growth was domestic demand as it was last year. However, domestic demand accelerated in the first half of 2011 and decelerated in the second half. In the first two quarters, private investment and consumption expenditure made the biggest contribution to the GDP growth, but in the third and fourth quarters, private investment and consumption expenditure slowed down and net exports started to contribute positively to real GDP growth. Table 1 shows the contributions of GDP components to growth. In the first half, private investment and consumption expenditure contributed 14.2 percentage points to the real GDP growth, but they contributed only 6 percentage points in the second half. Also, in the first half of 2011 net exports subtracted 5.2 percentage points from the growth but contributed 1.9 percentage points in the second half. This divergence between foreign and domestic demand shows that “soft landing” has begun in the economy. However, the increase in exports in the third quarter did not continue in the fourth quarter because of the contraction in the European economy. The increase in net exports in the fourth quarter was mainly due to the decline in imports caused by the slowdown in domestic demand (Figure 4 and Table 4).
In 2011, the contribution of government expenditures to the GDP growth was very limited. Government expenditures increased by 2.3 percent and contributed only 0.4 percentage points. In 2010, government expenditures had increased by 5.9 percent and contributed 0.9 percentage points. In the second half of 2011, government expenditures showed only a slight decline. Therefore, government expenditure didn’t play any significant role in real GDP growth. Fiscal policy remains to be tight.
In the second half of 2011, slowdown in domestic demand and decrease in imports stopped the increase in the ratio of current account deficit to GDP and from November onwards, current account deficit began to decrease. The current account to GDP ratio was 6.5 in 2010 and it became 10 percent in 2011. Sharp brake in domestic demand
To analyze the contributions of GDP components to growth, Betam seasonally adjusts each component of GDP separately.
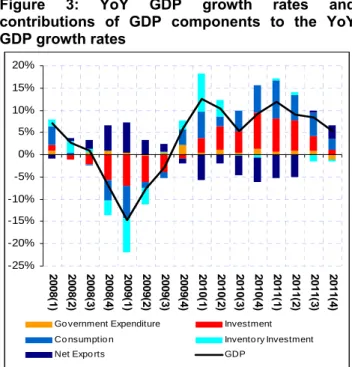
Figure 3: YoY GDP growth rates and contributions of GDP components to the YoY GDP growth rates -25% -20% -15% -10% -5% 0% 5% 10% 15% 20% 200 8( 1) 200 8( 2) 200 8( 3) 200 8( 4) 200 9( 1) 200 9( 2) 200 9( 3) 200 9( 4) 201 0( 1) 201 0( 2) 201 0( 3) 201 0( 4) 201 1( 1) 201 1( 2) 201 1( 3) 201 1( 4)
Go vernment Expenditure Investment Co nsumptio n Invento ry Investment
Net Expo rts GDP
Source: Turkstat, Betam.
Figure 4: Change of GDP components in 2011-Q4 from the previous quarter
Seasonally Adjusted Indicators
Imports Exports Government Spending Investment Consumption -8% -6% -4% -2% 0% 2% 4% 6%
Source: Turkstat, Betam. Quarterly indicators are seasonally adjusted and calendar day corrected.
Figure 5: Contributions of GDP compenents to 2011-Q4 GDP growth
Seasonally Adjusted Indicators
Imports Exports Inventory Investment Government Spending Investment Consumption -2% -1% 0% 1% 2% Total Grow th: -0.4%
Source: Turkstat, Betam. Quarterly indicators are seasonally adjusted and calendar day corrected.
www.betam.bahcesehir.edu.tr
3
Figures 4 and 5 show the change in GDP componentsand their contributions to real GDP growth in the fourth quarter with respect to the previous quarter. Betam’s seasonal adjusted and calendar day corrected GDP components show that QoQ real GDP growth for the fourth quarter decreased by 0.4 percent.
According to Betam’s calculations, private consumption and government expenditures declined in the fourth quarter. Private consumption expenditure decreased by 1.2 percent and subtracted 0.8 percentage points from the quarterly real GDP growth. Government expenditure also decreased by 4.5 percent and subtracted 0.6 percentage points from the quarterly real GDP growth. Changes in inventory investment also subtracted 0.4 percentage points. In the fourth quarter, the biggest contributor to the GDP growth was the decline in imports. Imports decreased by 2.8 percent and contributed 0.8 percentage points to the quarterly real GDP growth. Private investment expenditure, after slumping in the third quarter, recovered in the fourth quarter. Private investment expenditures increased by 3.3 percent contributing 0.7 percentage points to real GDP growth in the fourth quarter.
2011 forecast performance and 2012 expectations Betam, in its Economic Outlook and Forecast briefs (January 2012 and February 2012), forecasted an 8.4 percent annual growth and it was realized as 8.5 percent. We forecasted YoY real GDP growth as 6.2 percent which was higher than realized (5.2 percent). Betam also expected QoQ growth to be 1.5 percent which was higher than realized numbers. Our consumption indicators showed an increase in private consumption expenditure in the fourth quarter, but private consumption actually declined and was the main reason for our forecast error. On the other hand, our expectation and forecasts for the change in other GDP components were in line with announced numbers. Betam’s forecast on annual current account deficit was 9.9 percent and according to Turkstat’s release, it was officially 10 percent.
Our expectations for 2012 are in line with those of international institutions. We expect that economic growth will be lower in 2012 than 2011. The monthly indicators should be watched closely to understand whether the slowdown will be a “soft landing” or a “hard landing” for the Turkish economy. For now, the economy is moving according to the “soft landing” scenario. However, if the fall in domestic demand becomes higher than expected and exports
don’t increase much, “soft landing” scenario will be at risk. The future outcome of the European crisis as well as the effects of the political developments in the Middle East on the price of oil will be the key determinants of economic growth in Turkey in 2012. Figure 6: Quarter-on-quarter real GDP growth rate
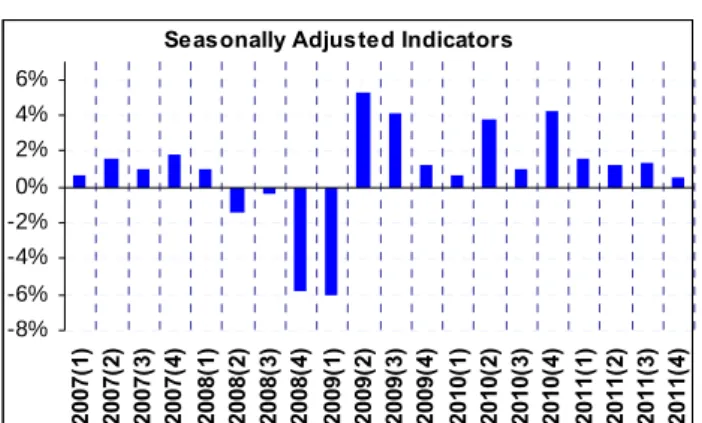
Seasonally Adjusted Indicators
-8% -6% -4% -2% 0% 2% 4% 6% 2007( 1) 2007( 2) 2007( 3) 2007( 4) 2008( 1) 2008( 2) 2008( 3) 2008( 4) 2009( 1) 2009( 2) 2009( 3) 2009( 4) 2010( 1) 2010( 2) 2010( 3) 2010( 4) 2011( 1) 2011( 2) 2011( 3) 2011( 4) Source: Turkstat.
Table 1. Change and contributions of GDP components in 1st and 2nd half of 2011 compared to same half of previous year
2011 – 1st half Change (%) Contribution (pp)
Consumption 10.0 7.0 Investment 37.1 7.2 Government exp. 5.8 0.8 Inventory inv. --- 0.6 Net Exports --- -5.2 Exports 4.3 1.0 Imports 22.6 -6.2
2011 – 2nd half Change (%) Contribution (pp)
Consumption 5.6 3.8 Investment 10.9 2.2 Government exp. -0.3 0.0 Inventory Inv. --- -1.0 Net Exports --- 1.9 Exports 8.4 2.0 Imports 0.6 -0.2
www.betam.bahcesehir.edu.tr
4
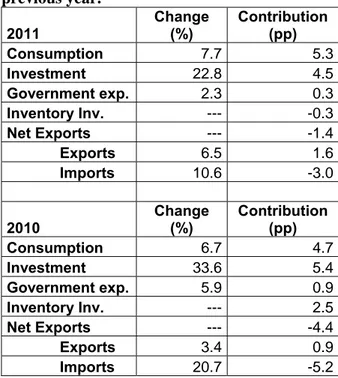
Table 2. Change and contributions of GDPcomponents in 2011 and 2010 compared to previous year. 2011 Change (%) Contribution (pp) Consumption 7.7 5.3 Investment 22.8 4.5 Government exp. 2.3 0.3 Inventory Inv. --- -0.3 Net Exports --- -1.4 Exports 6.5 1.6 Imports 10.6 -3.0 2010 Change (%) Contribution (pp) Consumption 6.7 4.7 Investment 33.6 5.4 Government exp. 5.9 0.9 Inventory Inv. --- 2.5 Net Exports --- -4.4 Exports 3.4 0.9 Imports 20.7 -5.2
Table 3. Change and contributions of GDP components in fourth and third quarter of 2011 compared to previous year of the same quarter. 2011 – 4Q Change (%) Contribution (pp) Consumption 3.4 2.4 Investment 5.2 1.1 Government exp. -5.7 -1.1 Inventory Inv. --- -0.4 Net Exports --- 3.2 Exports 6.7 1.7 Imports -5.1 1.6 2011 – 3Q Change (%) Contribution (pp) Consumption 7.8 5.3 Investment 17.7 3.2 Government exp. 7.3 1.0 Inventory Inv. --- -1.5 Net Exports --- 0.6 Exports 10.2 2.4 Imports 6.8 -1.8
Table 4. Change and contributions of GDP components in 2011 and 2010 compared to previous quarter. 2011 – 4Q Change (%) Contribution (pp) Consumption -1.2 -0.8 Investment 3.26 0.7 Government exp. -4.5 -0.6 Inventory Inv. --- -0.4 Net Exports --- 0.8 Exports 0.3 0.1 Imports -2.8 0.8 2011 – 3Q Change (%) Contribution (pp) Consumption 3.4 2.3 Investment -6.5 -1.5 Government exp. 1.6 0.2 Inventory Inv. --- -2.2 Net Exports --- 2.2 Exports 4.4 1.0 Imports -4.2 1.2
www.betam.bahcesehir.edu.tr
5
Box 1.The differences of real GDP growth series between Betam and Turkstat
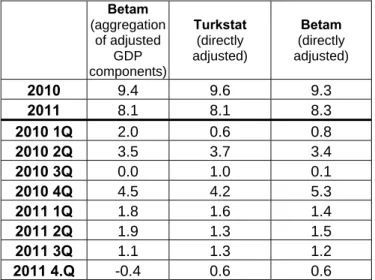
In the fourth quarter of 2011, when Betam directly seasonally adjusted and calendar day corrected the real GDP, we found that the real GDP increased by 0.6 percent, like Turkstat reported. However, when Betam seasonally adjusted and calendar day corrected each GDP component and then summed it up, we found that the real GDP decreased by 0.4 percent. Betam and Turkstat use the same kind of seasonal adjustment methodology for series. However, Betam prefers to seasonally adjust each GDP component and sum it up, but Turkstat prefers direct seasonal adjustment of GDP. However, the direct seasonal adjusted series and aggregation of seasonally adjusted GDP components give different numbers because both series have different seasonal characteristics. However, Betam’s and Turkstat’s annual GDP growth rates are very similar because seasonal fluctuations of quarterly series become insignificant. In Table 5, both annual and quarterly GDP growth rates of Betam and Turkstat are presented.
Table 5. Betam’s directly adjusted GDP and aggregation of each adjusted GDP component versus Turkstat’s directly adjusted GDP
Betam (aggregation of adjusted GDP components) Turkstat (directly adjusted) Betam (directly adjusted) 2010 9.4 9.6 9.3 2011 8.1 8.1 8.3 2010 1Q 2.0 0.6 0.8 2010 2Q 3.5 3.7 3.4 2010 3Q 0.0 1.0 0.1 2010 4Q 4.5 4.2 5.3 2011 1Q 1.8 1.6 1.4 2011 2Q 1.9 1.3 1.5 2011 3Q 1.1 1.3 1.2 2011 4.Q -0.4 0.6 0.6
www.betam.bahcesehir.edu.tr
6
Box 2: Calculation of quarterly GDP growth andcontributions.
Sub-components of GDP are grouped into 3 cate-gories:
1. Final domestic demand consist of final consump-tion expenditure of resident households (Con-sumption), sum of government final consumption and investment expenditure (Government ex-penditure), investment expenditure of private sector (Investment)
2. Net foreign demand for goods and services rep-resents the difference between exports and imports of goods and services.
3. Change in inventories (stocks) shows how stocks changes with compared to previous quarter (for details look Box 2)
In order to find quarterly GDP growth, the following formulation is used for all sub components of GDP separately:
Since X represents 'Change in GDP component' Contribution of X to growth can be calculated as follows:
= (Xt – Xt-1) / GDPt-1
Differences between the methodologies used by Betam and TurkStat in seasonally adjusting the real GDP
TurkStat seasonally adjusts and calendar day corrects total GDP series but not its components separately. However, each component of GDP may show different seasonal characteristics. Therefore, Betam eliminates the effects of seasonality and calendar day from the components separately and constructs the adjusted GDP series as the sum of the adjusted components. These two methodologies yield quantitatively different results and both of them are used frequently in the related literature.
Box 3: Change in inventories (stocks) and its contribution to growth
'Stock change' shows that how stocks change compared to previous period
Stock change t = Stock t – Stock t-1
Therefore increase (decrease) in inventories is caused by increase (decrease) in the difference between two period rather than increase (decrease) in stocks. However, TurkStat estimates the change in stocks is as residual between production and expenditure accounts. Moreover this sub-component also includes statistical discrepancy.
Let's say the difference between production and expenditure account εt-1, 'stock change' in time t is as
follows:
Stock changet = Stock t – Stock t-1 + εt-1
Finally, contribution of change in 'Stock change' can be found as follows:
Contribution of 'Stock change t = (Stock t – Stock t-1) / GDP t-1
or
Contribution of 'Stock change t = ((Stock t – Stock t-1 + εt )