Growth Continues to Decelerate
Zümrüt İmamoğlu* ve Barış Soybilgen†
Executive Summary
In February the Industrial Production Index (IPI) fell by 1.7 percent from a month ago while imports increased by 0.6 percent and exports did not change. In December Turkey had experienced big hikes in both the IPI and its foreign trade. January was the month of moderation and now we see a decrease in the IPI in February. We still believe that the first quarter growth in real GDP will be much lower than the fourth quarter. Betam’s growth rate forecast for the first quarter is unchanged still stands at 1.3 percent quarter on quarter.
The trade deficit in February was 7.4 billion dollars, same as the January level. The current account deficit was 6,1 billion dollars, a little higher than the January level. As percent of GDP we expect the yearly current account deficit to reach 7.2% by the end of the first quarter. Although still below the November and December deficit figures, the current account deficit in the first two months of 2011 is already about a quarter of 2010 deficit in total.
* Dr. Zümrüt İmamoğlu, Betam, Research Associate. [email protected]
† Barış Soybilgen, Betam, Research Assistant,
In March, we might see a slight increase in the IPI. Real Sector Confidence Index and the stock market signals are optimistic and the capacity utilization ratio was also slightly up for the month of March. Central Bank increased the required reserve ratios for Banks one more time, without any change in the policy rate. We expect this policy to have a stronger effect and will help cooling of the economy further in the second quarter.
Table1. Betam’s growth and current account forecasts
Source: Betam
2011 Quarter 1
GDP growth (quarter on quarter) 1.3
GDP growth (year on year) 10.3
Current account deficit (% of GDP,
annual) 7.2
Economic Outlook and Forecasts:
April 2011
According to February data, investment and consumption continue to decelerate
Table 2 lists the monthly indicators Betam follows and their monthly and quarterly percentage changes. As indicated in the last note, we were expecting a fall in IPI either in February or March. Expected fall occurred in February and IPI decreased 1.7 percent. However, it is still above last quarter’s average. Also, most of the indicators fell in February. On the other hand, limited number of March data, that is announced so far, showed some positive signs for March. Looking at these indicators, we think it is almost certain that the growth in the first quarter of 2011 will be smaller than in the last quarter of 2010.
Investment indicators
As Table 2 shows, all the sub-indices of IPI declined in February. Furthermore, investment goods imports and intermediate goods imports show almost no change in February. Real sector confidence index and capacity utilization rate (CUR) increased 0.6 percent and 0.3 percent respectively in March after the decline in February. According to limited amount of data released for March, we see some improvement in investment indicators from a month ago. However, growth of investment in first quarter of 2011 overall will be lower that that in the last quarter of 2010.
Consumption indicators
February’s consumption indicators are more optimistic than investment indicators. In February,
consumer goods imports increased 3.1 percent. Automobile production and consumer confidence index also increased in February. However, durable and non-durable goods imports fell 0.9 and 1.4 percent, respectively and Special Consumption Tax (SCT) decreased for two months consecutively by a total of 8.5 percent. Overall, we believe that growth in consumption demand is slowing down like the growth in investment demand.
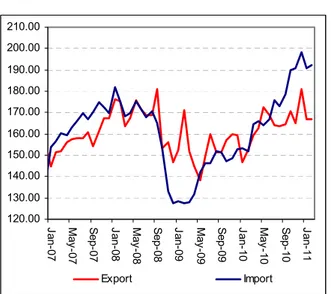
Foreign trade
Figure 2 shows monthly changes of seasonally adjusted import and export volume indices. In February, exports stayed at the same level but imports increased by 0.6 percent. In the last quarter, imports had increased more than exports and in this quarter exports decreased more than imports. Moreover, according to January and February data, we calculated that imports and exports decreased 0.8 and 3.0 percent respectively compared to last quarter. Therefore, persistent and high trade deficit continues to be a concern for the Turkish economy. We believe that the uncertainty in the Middle East will have an adverse impact on Turkish exports exacerbating the situation.
Current account deficit
In January, Turkey’s trade deficit was $7.3 billion and the current account deficit was and $5.9 billion. In February, the trade deficit and the current account were 7.4 and 6.1 billion US dollars, respectively. The current account deficit in the first two months of 2011 is already about one fourth of the current account deficit in 2010. If
the economy does not slow down as fast as the Central Bank hopes, the current account deficit can reach worrisome levels.
Betam increased its current account deficit forecast for the first quarter of 2011 to 7.2 percent of GDP. The high February deficit gives more reasoning to the Central Bank for increasing the required reserve ratio.
Betam’s calculations show that exports and imports decreased in the first quarter of 2011 compared to the last quarter of 2010, however; exports have been decreasing at a faster pace than imports. Therefore, we do not expect the foreign trade deficit to close much in the month of March, either. The only way to control the deficit is to cool down the economy further. Otherwise, Turkey might face a sharp devaluation of the Turkish Lira. Of course this option is highly undesirable. We believe that the increases in the reserve ratios will not be enough to curb domestic demand and the Central Bank will have to start increasing the policy rate after the elections in June.
Forecasts
Betam releases its GDP and current account forecasts on a monthly basis and revises its forecasts every month after updating its monthly indicators. Table 1 summarizes Betam’s year-on-year and quarter-on-quarter forecasts of real GDP. We expect the real GDP to grow by 1.3 percent in the first quarter from the previous quarter and by 10.3 percent from the same quarter of previous year. We increased our current account deficit
forecast for the end of the first quarter to be 7.2 percent.
Table 2. Monthly and quarterly changes of Betam’s selected indicators (Real and sa)
Indicators January February March
2010 4. Quarter
2011 1.
Quarter1
Imports -3.7 0.6 ** 9.8 -0.8
Intermediate goods imports -3.3 -0.0 ** 6.8 2.0
Consumer goods imports -9.7 3.1 ** 13.5 -2.7
Investment goods imports -18.1 0.2 ** 26.9 -10.7
Industrial Production Index (IPI) 0.5 -1.7 ** 5.5 2.8
Nondurable consumer goods -0.9 -1.4 ** 2.0 1.3
Durable consumer goods 4.9 -0.9 ** 0.3 3.3
Intermediate goods -1.4 -0.2 ** 5.9 2.9
Investment goods -3.3 -1.0 ** 13.8 4.3
Capacity Utilization Rate (CUR) 0.1 -0.9 0.3 3.3 1.5
Nondurable consumer goods -0.3 -0.3 0.6 1.5 -0.0
Durable consumer goods 1.7 -0.1 1.5 2.2 3.1
Intermediate goods -1.0 -1.1 -0.5 3.1 0.4
Investment goods 1.4 -0.1 0.7 2.5 3.0
Soft Data
Consumer confidence index
(Turkstat) -0.0 1.3 ** 3.1 1.2
Real sector confidence index -1.1 -3.0 0.6 9.0 -1.3
Financial Data
IMKB 100 (Stock Exchange) -0.3 -2.3 0.7 9.6 -4.1
Other
Special consumer tax* (SCT) -4.5 -4.2 ** 7.7 -5.0
Automobile production -4.7 3.4 ** 13.4 3.0
Source: TurkStat, TCMB, Treasury, IMKB, Betam. All series are real (or inflation adjusted) wherever necessary and seasonally adjusted (sa).
*This tax is collected on sales of goods such as gas, fuel oils, alcohol, tobacco products and automobiles. **Data not yet released
1
Figure 1: Capacity utilization rate and industrial production index (sa, left axis for CUR and right axis for IPI)
60 65 70 75 80 85 Ja n-07 Ap r-07 Ju l-0 7 Oc t-07 Ja n-08 Ap r-08 Ju l-0 8 Oc t-08 Ja n-09 Ap r-09 Ju l-0 9 Oc t-09 Ja n-10 Ap r-10 Ju l-1 0 Oc t-10 Ja n-11 95 100 105 110 115 120 125 130 CUR IPI
Source : TurkStat, Betam
Figure 2: Volume indices of exports and imports (sa) 120.00 130.00 140.00 150.00 160.00 170.00 180.00 190.00 200.00 210.00 Ja n-07 Ma y-07 Se p-07 Ja n-08 Ma y-08 Se p-08 Ja n-09 Ma y-09 Se p-09 Ja n-10 Ma y-10 Se p-10 Ja n-11 Export Import
Source : TurkStat, Betam
Figure 3: Ratio of current account deficit to GDP (yearly)
Current Account Deficit (% of GDP)
0.0 1.0 2.0 3.0 4.0 5.0 6.0 7.0 8.0 20 07 (Q 1) 20 07 (Q 2) 20 07 (Q 3) 20 07 (Q 4) 20 08 (Q 1) 20 08 (Q 2) 20 08 (Q 3) 20 08 (Q 4) 20 09 (Q 1) 20 09 (Q 2) 20 09 (Q 3) 20 09 (Q 4) 20 10 (Q 1) 20 10 (Q 2) 20 10 (Q 3) 20 10 (Q 4) 20 11 (Q 1)
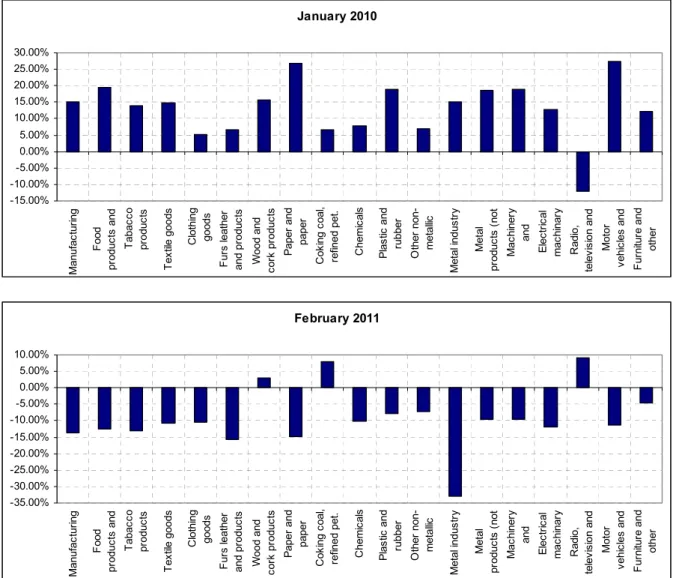
Figure 4: Monthly changes of manufacturing industry exports, December 2010 and January 2011 (sa)
Source: TurkStat, Betam
February 2011 -35.00% -30.00% -25.00% -20.00% -15.00% -10.00% -5.00% 0.00% 5.00% 10.00% M anuf ac tu ring F ood pr oduc ts and T abac co pr oduc ts T ex til e goo ds C lot hi ng goods F ur s l eat her and p ro duc ts W ood and co rk pr oduc ts P ape r a nd paper C ok ing c oal , re fined p et . C hem ic al s Pl as tic a nd rubber O ther non-m et all ic Me ta l i nd us tr y Me ta l pr odu ct s ( not M ac hi ner y and E lec tr ic al m ac hi nar y R adi o, te le vi si on a nd Mo to r ve hi cl es a nd F ur ni tur e a nd ot her January 2010 -15.00% -10.00% -5.00% 0.00% 5.00% 10.00% 15.00% 20.00% 25.00% 30.00% M anuf ac tu ring F ood pr oduc ts and T abac co pr oduc ts T ex til e goo ds C lot hi ng goods F ur s l eat her and p ro duc ts W ood and co rk pr oduc ts P ape r a nd paper C ok ing c oal , re fined p et . C hem ic al s Pl as tic a nd rubber O ther non-m et all ic Me ta l i nd us tr y Me ta l pr odu ct s ( not M ac hi ner y and E lec tr ic al m ac hi nar y R adi o, te le vi si on a nd Mo to r ve hi cl es a nd F ur ni tur e a nd ot her