SIGNIFICANT SLOWDOWN IN TURKISH ECONOMY
Zümrüt İmamoğlu* ve Barış Soybilgen
†Executive Summary
In February, the Industrial production index (IPI) increased by 0.7 percent and the export volume index increased by 4.8 percent compared to January while the import volume index decreased by 0.2 percent. Our economic indicators show that economic growth decelerated significantly in the first quarter. The increase in export volume index was the only encouraging development during this month. However, the decline in import volume was limited. Betam’s quarter on quarter (QoQ) growth forecast for the first quarter of 2012 is 0.3 percent. We estimate the corresponding year on year (YoY) growth as 3.5 percent.
Both the trade deficit and the current account deficit fell significantly in February compared to the same month of the last year. Due to high increase in exports, current account deficit decreased by $1.8 billion and fell to $4.2 billion. The 12-month current account deficit fell to $75.3 billion from $77.1 billion. In coming months, we expect that current account deficit will continue to decline and drop to 9.3 percent of GDP at the end of the first quarter.
* Zümrüt İmamoğlu, PhD, Betam, Research Associate. [email protected]
† Barış Soybilgen, Betam, Research Assistant, [email protected]
Table 1. Betam’s quarterly and annual growth rate forecasts
O
Source: Betam
*sa: seasonally and calendar day adjusted **ca: calendar day adjusted
Is soft landing getting rough?
The annual real GDP growth rate for 2011, announced a couple of weeks ago, is 8.5 percent, very similar to Betam’s forecast of 8.4 percent. Altough the annual growth seemed strong, YoY growth rate was below our forecast. Betam’s YoY forecast for the fourth quarter was 6.2 percent, but it was realized as 5.2 percent. The slowdown in the economy is inline with soft landing scenario, but the first quarter data indicates that the landing is getting rough.
January and February data shows that IPI is declining in the first quarter compared to last
2012 1. Quarter
Forecast Real GDP growth, %
(quarter on quarter, sa*) 0,3
Real GDP growth, %
(year on year, ca**) 3,5
Current account deficit
(% of GDP, annual) 9,3
Economic Outlook and Forecasts:
April 2012
quarter. The increase in the export volume index is stronger than last quarter, but the decline in import volume index is slowing down. If March data doesn’t show a significant decline in import volume index, the contribution of net exports to GDP growth might be limited.
On the other hand, increasing oil prices and stagnation in Europe is a major threat for Turkish economy. In Euro area, YoY IPI decreased by 1.8 percent in February. In January and February, IPI decreased by 0.8 percent on average when compared to last quarter.
Due to increasing oil prices, the Turkish Central Bank is giving signs of tighter monetary policy. Tighter monetary policy is indeed needed in face of rising oil prices although core inflation figures started to head down because the inflation figure continues to remain above 10 percent which is significantly higher than the year-end target of 5 percent. In this respect, fiscal policy could be loosened to prevent the slow down in the economy to turn into a recession (or what some economists call ‘hard-landing’). If fiscal policy is to be loosened, the composition of additional government expenditure is as important as its magnitude. In an inflationist environment, additional government expenditure should be channeled to support investment or to decrease labor costs instead of fostering consumption. The investment incentive package (Teşvik Paketi), announced recently by the prime minister, is an optimistic step in this regard.
Private consumption expenditure is declining
According to the first quarter indicators announced so far, we expect that private consumption expenditure fell in the first quarter compared to the last quarter, altough February consumption indicators shows a limited revival. In February, consumer goods imports, durable goods manufacturing and consumer confidence index increased by 0.6 percent, 2.5 percent and 0.4 percent, respectively. Due to the increase in consumer goods imports and durable goods imports, special consumer tax income increased by 1 percent in February compared to the previous month. On the other hand, nondurable goods manufacturing decreased by 1.8 percent in February and non-commercial automobile production fell by 10.2 percent in March compared to February.
Reel sector confidence index keeps increasing
The real sector confidence index and capacity utilization rate increased by 1.6 percent and 0.2 percentage points, respectively, in March compared to February. IPI also increased by 0.7 percent in February, mainly caused by the increase in durable consumer goods and investment goods manufacturing (2.5 percent and 1.3 percent respectively). On the other hand, investment goods imports and intermediate goods imports decreased by 0.9 percent and 2.3 percent, respectively. Overall, we believe that there was a limited increase in investment demand in the first quarter.
Export volume increased in February
Figure 2 shows monthly changes of seasonally adjusted import and export volume indices. In February, export volume index increased by 4.8 percent while import volume index decreased by 0.2 percent. The slump in non-commercial automobile production in March isn’t a good sign for export figures for March. February foreign trade data still shows that Turkey’s exports to EU is not increasing although overall export volume has been increasing in 2012.
Current account deficit is expected to fall in the first quarter
In February, there was a significant fall in current account deficit down to $4.2 billion. Similarly, 12-month current account deficit fell to $75.3 billion from $77.1 billion. The main reason for the decline in current account deficit in February was the surge in exports.
On the financing side, February financial account data looks better than that in January. In January, current account deficit was mainly financed by central bank reserves, but in February due to increase in capital inflows, central bank reserves increased. However, the level of net errors and omissions that shows capital inflows with unknown origin in current account balance was high and realized as $1.3 billion.
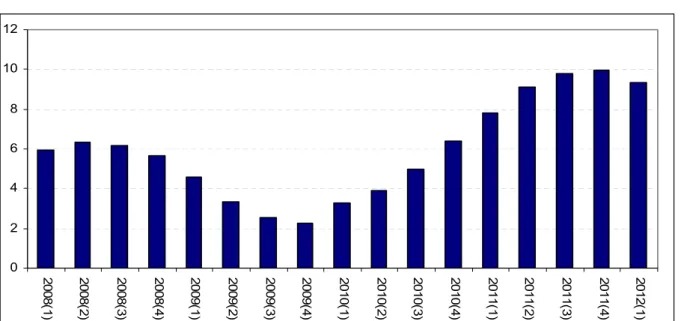
In coming months, we expect that current account deficit will continue to fall and drop to 9.3 percent by the end of first quarter (Figure 3).
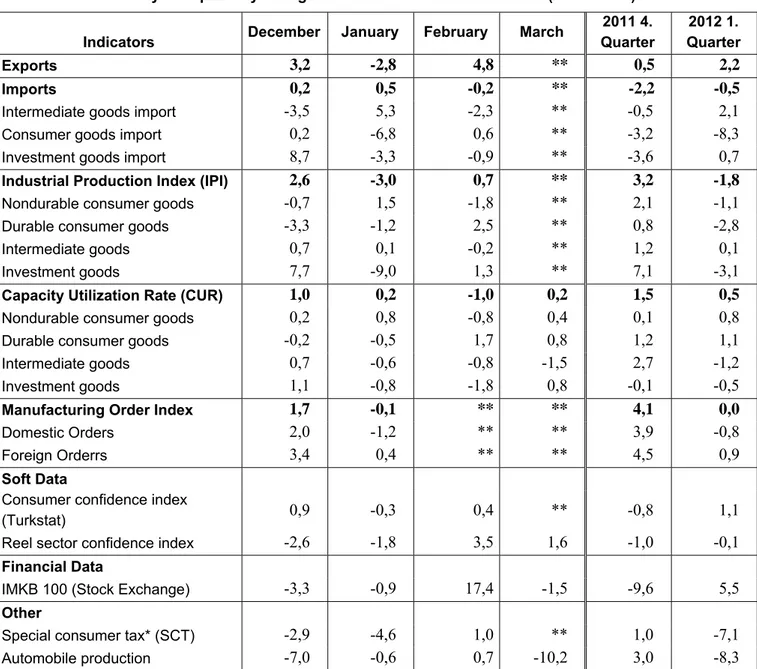
Table 2. Monthly and quarterly changes in Betam’s selected indicators (real and sa)
Indicators December January February March
2011 4. Quarter 2012 1. Quarter Exports 3,2 -2,8 4,8 ** 0,5 2,2 Imports 0,2 0,5 -0,2 ** -2,2 -0,5
Intermediate goods import -3,5 5,3 -2,3 ** -0,5 2,1
Consumer goods import 0,2 -6,8 0,6 ** -3,2 -8,3
Investment goods import 8,7 -3,3 -0,9 ** -3,6 0,7
Industrial Production Index (IPI) 2,6 -3,0 0,7 ** 3,2 -1,8
Nondurable consumer goods -0,7 1,5 -1,8 ** 2,1 -1,1
Durable consumer goods -3,3 -1,2 2,5 ** 0,8 -2,8
Intermediate goods 0,7 0,1 -0,2 ** 1,2 0,1
Investment goods 7,7 -9,0 1,3 ** 7,1 -3,1
Capacity Utilization Rate (CUR) 1,0 0,2 -1,0 0,2 1,5 0,5
Nondurable consumer goods 0,2 0,8 -0,8 0,4 0,1 0,8
Durable consumer goods -0,2 -0,5 1,7 0,8 1,2 1,1
Intermediate goods 0,7 -0,6 -0,8 -1,5 2,7 -1,2
Investment goods 1,1 -0,8 -1,8 0,8 -0,1 -0,5
Manufacturing Order Index 1,7 -0,1 ** ** 4,1 0,0
Domestic Orders 2,0 -1,2 ** ** 3,9 -0,8
Foreign Orderrs 3,4 0,4 ** ** 4,5 0,9
Soft Data
Consumer confidence index
(Turkstat) 0,9 -0,3 0,4 ** -0,8 1,1
Reel sector confidence index -2,6 -1,8 3,5 1,6 -1,0 -0,1
Financial Data
IMKB 100 (Stock Exchange) -3,3 -0,9 17,4 -1,5 -9,6 5,5
Other
Special consumer tax* (SCT) -2,9 -4,6 1,0 ** 1,0 -7,1
Automobile production -7,0 -0,6 0,7 -10,2 3,0 -8,3
Source: TurkStat. TCMB. Treasury. IMKB. Betam. All series are real (or inflation adjusted) wherever necessary and seasonally adjusted.
*This tax is collected on sales of goods such as gas. fuel oils. alcohol. tobacco products and automobiles. **Data not yet released
Figure 1: Capacity utilization rate and industrial production index (sa. left axis for CUR and right axis for IPI)
60 65 70 75 80 85 Ja n-07 May -07 Se p-07 Ja n-08 May -08 Se p-08 Ja n-09 May -09 Se p-09 Ja n-10 May -10 Se p-10 Ja n-11 May -11 Se p-11 Ja n-12 95 100 105 110 115 120 125 130 135 CUR IPI
Source : TurkStat. Betam
Figure 2: Volume indices of exports and imports (sa) 120.00 130.00 140.00 150.00 160.00 170.00 180.00 190.00 200.00 210.00 Jan-07 May -07 S ep-07 Jan-08 May -08 S ep-08 Jan-09 May -09 S ep-09 Jan-10 May -10 S ep-10 Jan-11 May -11 S ep-11 Jan-12 Export Import
Source : TurkStat. Betam
Figure 3: Ratio of current account deficit to GDP (yearly)
0 2 4 6 8 10 12 2008( 1) 2008( 2) 2008( 3) 2008( 4) 2009( 1) 2009( 2) 2009( 3) 2009( 4) 2010( 1) 2010( 2) 2010( 3) 2010( 4) 2011( 1) 2011( 2) 2011( 3) 2011( 4) 2012( 1)
Source: TCMB. TurkStat. Betam * Betam’s forecasts
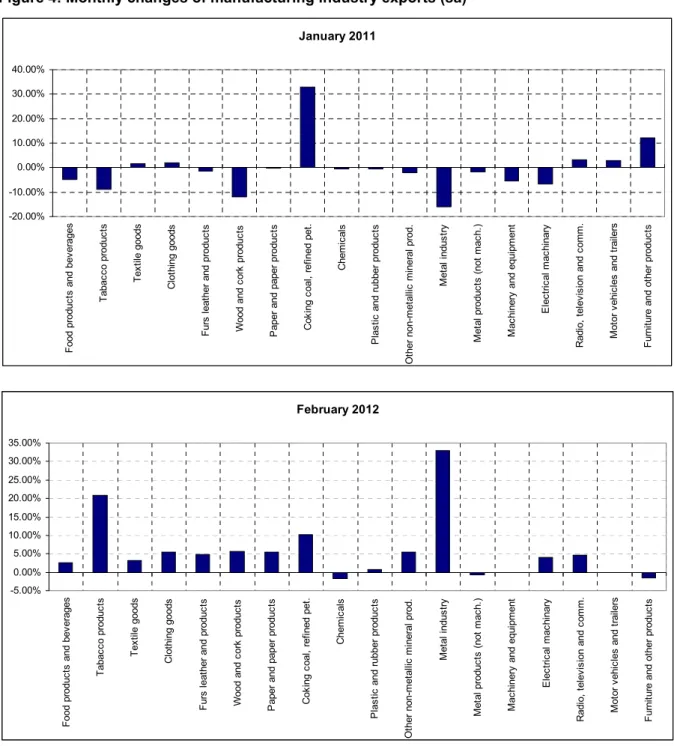
Figure 4: Monthly changes of manufacturing industry exports (sa)
Source: TurkStat. Betam
February 2012 -5.00% 0.00% 5.00% 10.00% 15.00% 20.00% 25.00% 30.00% 35.00% F ood pr oduc ts and bev erages T abac co produc ts T ex til e goods C lot hi ng goods F urs leat her and pr oduc ts Wood and co rk produc ts P aper and paper pr oduc ts C ok ing c oal , ref ine d pet . C hem ic al s P las tic and r ubber pro duc ts O ther non-m et allic m in er al p ro d. M et al indus tr y M et al produc ts (not m ac h. ) M ac hi nery and e qui pm ent E lec tr ic al m ac hi nary R adi o, t el ev is ion and c om m . M ot or v ehi cl es and t rai le rs F urni tur e and ot her pr oduc ts January 2011 -20.00% -10.00% 0.00% 10.00% 20.00% 30.00% 40.00% F ood produc ts and bev erages T abac co produc ts T ex til e goods C lot hi ng goods F urs leat her and produc ts Wood and c or k produc ts P aper and paper produc ts C ok ing c oal , r ef ined pet . C hem ic al s P las tic
and rubber produc
ts O ther non-m et al lic m iner al prod. M et al indus tr y M et al pr oduc ts ( not m ac h. ) M ac hi nery an d equi pm ent E lec tr ic al m ac hi nary R adi o, t el ev is ion and c om m . M ot or v ehi cl es and t rai le rs F ur ni ture and ot her produc ts