2016 - Volume: 17 Number: 4 Page: 747-753
DOI: 10.18038/aubtda.267109
Received: 30 June 2016 Revised: 27 October 2016 Accepted: 04 November 2016
VARIATION OF THE RAMAN FREQUENCY OF A SOFT MODE WITH THE PRESSURE (20 OC) FOR THE PHASE TRANSITIONS IN NH
4F
Hamit YURTSEVEN1,2*, Zeynep Tuğçe ÖZKARSLIGİL2 and Özlem TARI3
1Physics Group, Middle East Technical University, Northern Cyprus Campus, Güzelyurt, KKTC
2Department of Physics, Faculty of Arts and Sciences, Middle East Technical University, Ankara, TURKEY 3Department of Mathematics and Computer Science, Faculty of Science and Letters, İstanbul Arel University,
İstanbul, TURKEY
ABSTRACT
The Raman frequency of a soft mode (238 cm-1) is analyzed as a function of pressure at 20 oC for NH
4F using the experimental
data from the literature. This analysis is performed for the pressure dependence of the Raman frequency shifts (1)(P)T of
the soft mode close to the I - III, III - V and V – VI transitions in NH4F. The frequency shifts increase as the pressure increases
toward the phase transitions at T = 20 oC (293 K) in this ammonium structure. From the frequency shifts of the soft mode
studied, the pressure dependence of the isothermal compressibility is predicted through the mode Grüneisen parameter. Our calculated isothermal compressibility can be compared with the experimental measurements.
Keywords: Raman frequency. Soft mode. Phase Transitions. NH4F
1. INTRODUCTION
Phase transitions in molecular crystals under the temperature, pressure and concentration can be investigated spectroscopically. Experimental measurements of the spectroscopic parameters (frequency, intensity and bandwith) can be performed using various spectroscopic techniques such as Raman, infrared, NMR (nuclear magnetic resonance) etc. close to the phase transitions in molecular crystals. Phase diagrams of those crystalline systems which exhibit phase transitions, can also be obtained spectroscopically. Using various theoretical models, the observed spectra can be interpreted and the phase transitions in molecular crystals can be explained. This then provides to identify the molecular crystals for their technological applications.
In this study, we give as an example one of those molecular crystals, namely, ammonium fluoride (NH₄F) within the ammonium halide structures. All the ammonium halides have the NaCl structure. Experimentally, at room temperature and atmospheric pressure, only NH4I crystallizes in this structure while NH4F has the ZnO (wurtzite) structure and, NH4Cl and NH4Br occur in the CsCl structure [1]. The CsCl phases have the tetragonal NH4+ ions orientated randomly between the two equivalent positions in the unit cell, whereas in the ferroordered phase (below TC) the NH4+ ions are parallel to each other [2]. In the ZnO (wurtzite) structure of NH4F, hydrogens in the NH4+ ion are taken to be oriented towards the four nearest anions with no orientational disorder, which occurs at 0 kbar and 300 K with the nearest neighbour distance of 2.707 Å (experimental) and 2.685 Å calculated using the distributed charge model [1]. Experimentally, it was found that ZnO (wurtzite) structure transforms into the CsCl structure in NH4F at 13.1 kbar at 100 oC [3, 4]. Its T – P phase diagram was obtained some years ago [4].
748
Ammonium fluoride (NH₄F) exhibits various phases (I, II, III, IV, V and VI) as obtained experimentally in the temperature - pressure (T-P) phase diagram up to 200 kbar [5], as we have also calculated [6] previously using the mean field theory.
In NH4F, I-II phase transition occurs at 3.6 kbar at room temperature, which was obtained by the measurements of compressibility [3]. As the pressure increases to 11.5 kbar at 25 oC, II-III transition occurs in NH₄F, which was also obtained in earlier experiments [7]. It was shown that at 100 K and 1 bar, there were three possible phases at low temperatures [8]. From the measurements of the Raman spectra at 20 oC up to 20 kbar, two new phases of V and VI have been observed at 15 and 143 kbar, respectively [5].
The crystal structure of phase I was determined as a wurtzite – like structure, II an unknown one and III a distorted CsCl – like structure [9, 10], as also pointed out previously [5]. In recent years, the structures of the phases of NH4F have been identified according to a different type of ordering of the ammonium halides [11]. Phase I with the space group P63mc transforms into phase II which has a complicated rhombohedral structure containing 24 molecules in a hexagonal unit cell with the space group R3c [11]. At P=1.15 GPa, transition occurs from phase II to an ordered cubic phase III [11] in NH4F. It has been pointed out that the structure of phase II has stronger hydrogen bonds N-H-F than the I and III phases of NH4F [12].
Experimental studies have been conducted for NH4F. From the resistivity measurements, the transition from high-resistance state to low-resistance state has been obtained in ammonium halides, in particular, at 42 GPa for NH4F [13]. Also, high pressure induced phase transition dynamics in ammonium halides (at about 40 GPa in NH4F) has been investigated experimentally [14].
The Raman spectra of NH₄F were obtained for different lattice modes at 1 bar at various temperatures for the phases I and II [15]. In particular, peaks at 84 cm-1, 125 cm-1, two strong peaks at 244 cm-1 and 252 cm-1 with a broad band at 250 – 250 cm-1 were obtained at 1 bar and -170 oC in phase I of NH
4F [15]. The Raman spectra of phases I and II of NH4F were also obtained, in particular, a strong peak at 238 cm-1 and at 243 cm-1 [16]. The order-disorder transition in ammonium fluoride at high pressures and room temperature has also been studied experimentally and the Raman frequencies of the 238 cm-1 mode have been measured as a function of pressure up to 200 kbar [5].
From the change of the Raman frequency of 238 cm-1 with the pressure, it has been found that the phase transition from I to II occurs at 3.6 ± 0.5 kbar and the sample becomes transparent in NH4F [5]. At 25 oC and 11.5 kbar, transparency of the sample sharply increases and the main Raman peak disappears, which indicate the existence of phase III in NH4F, as pointed out previously from the Raman measurements [5]. As the pressure increases to 15 kbar, the transparency of the sample suddenly decreases with the Raman peak shifted to 235 cm-1, which also indicates the existence of phase V in NH4F and finally at very high pressure of 143 kbar the Raman active optic mode (238 cm-1) softens giving rise to a new phase VI, as observed experimentally [5]. Behaviour of this optic mode (TO) and also the vibrational mode (L) has been observed in relation to the ammonium ion accompanying orientational phase transitions at pressures up to 4.7 GPa in NH4F by inelastic incoherent neutron scattering [12].
In order to investigate the order – disorder phase transitions in NH4F including all the phases in the T-P phase diagram at room temperature (293 K) and at the pressures up to 200 kbar, we analyze the pressure dependence of the lattice mode (238 cm-1) in this molecular crystal using the experimental data [5].
2. ANALYSIS AND RESULTS
We analyze the pressure dependence of the Raman frequency according to a quadratic equation
749
where a0, a1 and a2 are constants. The pressure - induced frequency shift (1)(P)T, can be obtained from Eq. (1) as 1 𝜈( 𝜕𝜈 𝜕𝑃)𝑇 = 𝑎1+ 2𝑎2𝑃 𝑎0+ 𝑎1𝑃 + 𝑎2𝑃2 (2)
Here we obtained the pressure dependence of the frequency shifts (1)(P)T for the lattice mode (238 cm-1) at T = 293 K according to Eq. (2). This analysis was done for the transitions of the I – III and V - VI in NH₄F using the experimental data [5] which was obtained against P for T = 293 K. By fitting Eq.(1) to the vs. P data [5], the coefficients a0, a1 and a2 for both transitions (I - III and V – VI) were determined. Using the values of a0, a1 and a2 (Table 1), the pressure dependence of the (1)(P)T was obtained (Eq. 2). Figures 1 and 2 give (1)(P)T versus P for the transition I – III (through the solid phase II) and V – VI, respectively, at T = 293 K for NH4F.
Table 1. Values of the coefficients according to Eq. (1) using the observed Raman frequencies [5] of the soft mode (238 cm-1) for the transitions within the pressure intervals indicated (T = 293 K) in NH4F. Transition pressures are also given
NH4F Transition Pc (kbar) a0 (cm-1) a1 (cm-1/kbar) a2 10-2 (cm-1/kbar2) Pressure Interval (kbar) Eq. (1) I – II, II – III, III
- V
3.6, 11.5, 15
238.85 1.003 3.08 0 < P < 11.5
V - VI 143 217.20 1.176 -0.13 15 P < 143
Figure 1. The Raman frequency shifts (1)(P)T of the soft mode (238 cm-1) as a function of pressure (T = 293 K) according to Eq. (2) using the experimental data [5] for the phases I, II and III in NH4F. P (kbar) 0 2 4 6 8 10 12 14 16 4 5 6 7 8 3 T 1 10 P (kbar-1) Phase I Phase II Phase III NH4F
750
Figure 2. The Raman frequency shifts (1)(P)T of the soft mode (238 cm-1) as a function of pressure (T = 293 K) according to Eq. (2) using the experimental data [5] for the phases V and VI in NH4F.
3. DISCUSSION
As shown in Figures.1 and 2, the frequency shifts (1)(P)T increase with increasing pressure as expected, when one approaches toward the I – III transition (around 11.5 kbar) and the V-VI transition (around 143 kbar) at T = 20 oC in NH
4F. So, this Raman mode (238 cm-1) is associated with those transitions in this ammonium halide, as obtained spectroscopically. In terms of the values of the slope d/dP using Eq. (1) with the coefficients a0, a1 and a2 (Table 1) due to the translational optic mode (238 cm-1), we determined transitions between the phases in NH
4F according to
𝑑𝜈 𝑑𝑃⁄ = 𝑎1+ 2𝑎2𝑃 (3)
as given in Table 2. The slope value increases from d/dP = 1 cm-1/kbar in phase I at P = 0 to 1.2 cm -1/kbar at the critical pressure (P
c = 3.6 kbar) for the transition I-II. This increase in the slope as d/dP = 1.7 cm-1/kbar appearing at P
c = 11.5, indicates the transition from phase II to phase III and also for the III-V transition which occurs at Pc = 15 kbar with the slope value of d/dP = 2.1 cm-1/kbar (Table 2). Finally, at high pressures up to 143 kbar, the slope suddenly decreases down to d/dP = 0.8 cm-1/kbar, which is an indication of a new phase transition from phase V to VI in NH4F, as pointed out previously [5]. The Raman peak of the TO mode (238 cm-1) shifts to the blue region in phase V with a nearly – linear relation of the frequency shift with pressure roughly d/dP = 1 cm-1/kbar and the intensity of this soft mode decreases with increasing pressure from 15 kbar to 143 kbar, as also pointed out in an earlier study [5]. This sudden decrease in the frequency shift (d/dP = 0.8 cm-1/kbar) as we also obtained here in our analysis, is associated with the Raman peak of this mode disappearing at 143 kbar [5] above which phase VI takes place.
P (kbar) 0 20 40 60 80 100 120 140 160 -5.0 -4.5 -4.0 -3.5 -3.0 -2.5 -2.0 3 T 1 10 P (kbar-1) Phase V Phase VI NH4F
751
Table 2. Values of the slope d/dP of the soft mode (TO) using the observed Raman frequencies [5] at the critical pressures for the transitions indicated according to Eq. (3) in NH4F (see Table 1)
Transition Pc (kbar) d/dP (cm-1/kbar)
I – II 3.6 1.2
II - III 11.5 1.7
III - V 15 2.1
V - VI 143 0.8
Since the Raman TO mode (238 cm-1) is associated with the phase transitions in NH
4F, as stated above, this leads to predict the pressure dependence of the isothermal compressibility defined as
𝜅𝑇 = − 1 𝑉( 𝜕𝑉 𝜕𝑃)𝑇 (4)
close to the transitions studied in NH4F.
By defining the isothermal mode Grüneisen parameter T as
𝛾𝑇 = − 1 𝜈( 𝜕𝜈 𝜕𝑃)𝑇⁄𝜅𝑇 (5)
the pressure dependence of the isothermal compressibility T can be predicted. By determining the isothermal mode Grüneisen parameter T as positive for the 238 cm-1 mode, which measures the anharmonicity in the NH4F crystal, it is expected that the isothermal compressibility T decreases as the pressure increases.
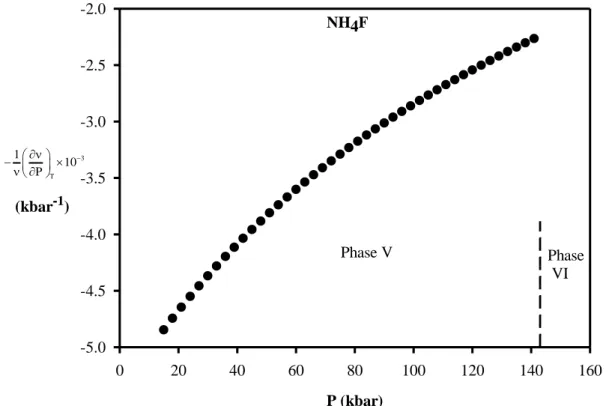
We calculated the pressure dependence of the isothermal compressibility T using the observed Raman frequencies [5] of the translational optic (TO) mode (238 cm-1) at T = 293 K according to Eq. (4) by means of the Grüneisen parameter = 5.2 ± 0.2 (TO = 27.2±0.9 meV at P = 1.9 GPa in Phase III) [12] for NH4F. By keeping the mode Grüneisen parameter as constant for all the phases of NH4F, the isothermal compressibility T was computed for the phases I, II, III, V and VI up to 143 kbar, as plotted in Figure 3. In this figure, vertical lines represent the phase boundaries in NH4F. Our calculated values can be examined by the measurements of the T as a function of pressure for the I – II and V - VI phase transitions in NH4F.
4. CONCLUSIONS
The Raman frequencies of the translational optic (TO) mode (238 cm-1) were analyzed at various pressures (T = 293 K) for the phases of I, II, III, V and VI in NH4F using the observed data from the literature. From the frequency shifts of this soft mode, using its mode Grüneisen parameter, the pressure dependence of the isothermal compressibility was predicted for the phases studied in this ammonium halide (NH4F). Our predicted values of the isothermal compressibility can be compared with the experimental measurements at various pressures (T = 293 K) for the phases indicated of NH4F. Also, the pressure dependence of the thermal expansion and the specific heat can be predicted at room temperature (T = 293 K) from the Raman frequency shifts of the TO mode (238 cm-1) for the phases of I, II, III, V and VI of NH4F.
In general, the thermodynamic quantities such as the heat capacity, thermal expansion and the isothermal compressibility can be predicted from the spectroscopic parameters (frequency shifts, intensity and bandwith) at various temperatures and pressures close to phase transitions in molecular crystals as we exemplified for ammonium fluoride in this study.
752
Figure 3. Pressure dependence of the isothermal compressibility T calculated from the observed Raman frequencies of the TO mode [5] according to Eq. (5) for the phases indicated in NH4F.
REFERENCES
[1] Raghurama G, Narayan R. The structures of the ammonium halides. J Phys Chem Solids 1983; 44: 633-638.
[2] Levy HA, Peterson SW. Neutron diffraction study of the crystal structure of ammonium chloride. Phys Rev 1952; 86: 766.
[3] Stevenson R. Phase transitions in the ammonium halides. J Chem Phys 1961; 34: 1757.
[4] Pistorius CWFT. Melting curves and phase transitions of the ammonium halides to 40 kbar. J Chem Phys 1969; 50: 1436.
[5] Zou G, Zhao Y, Cui O, Jin Z. Raman spectra and phase transitions of NH4F at high pressure. Solid State Physics Under Pressure. In: Mimonura S (Ed.) Terra Scientific Publishing Company, 1985. pp. 191.
[6] Salihoğlu S, Yurtseven H, Enginer Y. P-T phase diagram for NH4F. Solid State Sciences 2002; 4: 529-534.
[7] Swenson CA, Tedeschi JF. Phase transitions in ammonium fluoride. J Chem Phys 1964; 40: 1141.
[8] Nabar MA, Calvert LD, Whalley E. J Chem Phys 1989; 91: 1353.
[9] Wyckoff RGW. Crystal Structure. Interscience Publishers Inc., New York, 2nd ed. Vol. 1, 1963. P (kbar) 0 20 40 60 80 100 120 140 160 T x 10 -4 ( k bar -1 ) 4 6 8 10 12 14 16 I II III V VI NH4F
753
[10] Pistorius CWFT. Progress in Solid State Chemistry vol 11, 1976 ed. McCaldin JO, Somorja G. New York: Permagon. pp. 11.
[11] Glazkov VP, Kozlenko DP, Savenko, BN et al. Neutron diffraction study of structural variations in NH4I and NH4F ammonium halides under high pressures. Crystallogr Rep 1999; 44: 50.
[12] Glazkov VP, Kozlenko DP, Savenko BN, Somenkov VA. Vibrational spectra of the ammonium halides NH4I and NH4F at high pressures. J Exp Theo Phys 2000; 90: 319-323.
[13] Tikhomirova GV, Babushkin AN. Ammonium halides NH4Cl, NH4F and NH4Br under high pressure. Phys Stat Sol (b) 2003; 235: 337-340.
[14] Tikhomirova GV, Babushkin AN. High pressure induced phase transition dynamics in ammonium halides. Joint 20th AIRAPT- 43th EHRG, 2005 Karlsruhe, Germany.
[15] Durig JR, Antion DJ. Far infrared and Raman spectra of ammonium fluoride and ammonium fluoride-d4. App Spectroscopy 1970; 24: 16.
[16] Wong PTT, Whalley E. A technique for the Raman spectroscopy of high pressure phases recovered at low temperatures. The low frequency Raman spectrum of ammonium fluoride II. Rev Sci Inst 1972; 43: 935.
![Table 1. Values of the coefficients according to Eq. (1) using the observed Raman frequencies [5] of the soft mode (238 cm -1 ) for the transitions within the pressure intervals indicated (T = 293 K) in NH 4 F](https://thumb-eu.123doks.com/thumbv2/9libnet/4242964.67111/3.892.120.758.459.1009/coefficients-according-observed-frequencies-transitions-pressure-intervals-indicated.webp)
![Table 2. Values of the slope d/dP of the soft mode (TO) using the observed Raman frequencies [5] at the critical pressures for the transitions indicated according to Eq](https://thumb-eu.123doks.com/thumbv2/9libnet/4242964.67111/5.892.135.760.162.257/values-observed-frequencies-critical-pressures-transitions-indicated-according.webp)
![Figure 3. Pressure dependence of the isothermal compressibility T calculated from the observed Raman frequencies of the TO mode [5] according to Eq](https://thumb-eu.123doks.com/thumbv2/9libnet/4242964.67111/6.892.147.721.109.525/pressure-dependence-isothermal-compressibility-calculated-observed-frequencies-according.webp)
