Journal of Cross-Cultural Psychology XX(X) 1 –33 © The Author(s) 2013 Reprints and permissions: sagepub.com/journalsPermissions.nav
DOI: 10.1177/0022022113509132 jccp.sagepub.com Article
Opposite Ends of the Same
Stick? Multi-Method Test of the
Dimensionality of Individualism
and Collectivism
Vas Taras
1, Riikka Sarala
1, Paul Muchinsky
1, Markus
Kemmelmeier
2, Theodore M. Singelis
3, Andreja Avsec
4,
Heather M. Coon
5, Dale L. Dinnel
6, Wendi Gardner
7, Sherry
Grace
8, Erin E. Hardin
9, Sandy Hsu
10, Joel Johnson
11, Zahide
Karakitapoğlu Aygün
12, Emiko S. Kashima
13, Arnulf Kolstad
14,
Taciano L. Milfont
15, John Oetzel
16, Sumie Okazaki
17, Tahira M.
Probst
18, Toru Sato
19, Maggie Shafiro
20, Seth J. Schwartz
21,
and H. Colleen Sinclair
22Abstract
The construct of individualism–collectivism (IND-COL) has become the definitive standard in cross-cultural psychology, management, and related fields. It is also among the most controversial, in particular, with regard to the ambiguity of its dimensionality: Some view IND and COL as the
1University of North Carolina at Greensboro, USA 2University of Nevada, Reno, USA
3California State University, Chico, USA 4University of Ljubljana, Slovenia
5North Central College, Naperville, IL, USA 6Western Washington University, Bellingham, USA 7Northwestern University, Evanston, IL, USA 8York University, Toronto, Ontario, Canada 9Texas Tech University, Lubbock, USA 10University of Wyoming, Laramie, USA 11University of California, Davis, USA 12Bilkent University, Ankara, Turkey
13La Trobe University, Melbourne, Victoria, Australia
14Norwegian University of Science and Technology, Trondheim, Norway 15Victoria University of Wellington, New Zealand
16University of New Mexico, Albuquerque, USA 17New York University, USA
18Washington State University, Vancouver, USA 19Shippensburg University, PA, USA
20Morehead Associates, Charlotte, NC, USA 21University of Miami School of Medicine, FL, USA 22Mississippi State University, Starkville, USA
Corresponding Author:
Vas Taras, Bryan School of Business and Economics, University of North Carolina at Greensboro, 349 Bryan, P.O. Box 26165, Greensboro, NC 27402-6165, USA.
2 Journal of Cross-Cultural Psychology XX(X) opposites of a single continuum, whereas others argue that the two are independent constructs. We explored the issue through seven different tests using original individual-level data from 50 studies and meta-analytic data from 149 empirical publications yielding a total of 295 sample-level observations that were collected using six established instruments for assessing IND and COL as separate constructs. Results indicated that the dimensionality of IND-COL may depend on (a) the specific instrument used to collect the data, (b) the sample characteristics and the cultural region from which the data were collected, and (c) the level of analysis. We also review inconsistencies, deficiencies, and challenges of conceptualizing IND-COL and provide guidelines for developing and selecting instruments for measuring the construct, and for reporting and meta-analyzing results from this line of research.
Keywords
values, attitudes, beliefs, cultural psychology, history of psych
Since the publication of Hofstede’s (1980) highly influential book Culture’s Consequences, cul-ture has become a crucial construct for research conducted in business, management, psychology, communication, education, and sociology. The number of citations to his book—about 40,000 according to Google Scholar—speaks to its profound effect on subsequent research. Hofstede’s framework has become a foundation for further cross-cultural research, and the four cultural dimensions originally presented in his model—power distance, uncertainty avoidance, individualism– collectivism, and masculinity–femininity—appear in most subsequent models of culture.
Of the four dimensions in Hofstede’s model, individualism–collectivism (hereafter IND-COL) stands out for its unmatched popularity in cross-cultural research (Kirkman, Lowe, & Gibson, 2006; Tsui, Nifadkar, & Ou, 2007). More than two thirds of all existing instruments for measuring cultural values include measures analogous to Hofstede’s IND-COL (Taras, Rowney, & Steel, 2009). Furthermore, a recent meta-analytic review of more than 500 empirical studies on the effects of culture in the workplace reported that IND-COL accounts for about 88% of all reported effects of cultural values in the empirical cross-cultural literature (Taras, Kirkman, & Steel, 2010). In fact, countries are often selected for inclusion in research based on their relative standing on IND-COL. As such, it can be concluded that cross-cultural research of the past decades has been, to a large degree, research on IND-COL.
IND-COL is not only the most popular cultural construct but also the most controversial one. First, as Oyserman, Coon, and Kemmelmeier (2002) discussed, what is commonly known as IND-COL appears in literature under different names, including independent–interdependent self-construal (Markus & Kitayama, 1991), idiocentrism–allocentrism (Triandis, 1983), and private– collective self (Trafimow, Triandis, & Goto, 1991), as well as numerous subtypes of the construct such as vertical and horizontal IND-COL (e.g., Singelis, Triandis, Bhawuk, & Gelfand, 1995) and institutional and in-group collectivism (House, Hanges, Javidan, Dorfman, & Gupta, 2004). The inconsistent terminology often leads to confusion and makes integration of extant research challenging. Second, a number of authors have questioned the validity and utility of IND-COL, mainly due to the ambiguity of the construct boundaries and scope (e.g., Kim & Sharkey, 1995; Levine et al., 2003; Voronov & Singer, 2002). However, perhaps the biggest controversy sur-rounding the construct is the uncertainty of the relationship between IND and COL.
The conception of IND-COL as a facet of culture was introduced at least half a century ago (e.g., Kluckhohn & Strodtbeck, 1961; Kuhn & McPartland, 1954), but it was Hofstede who established the explanatory potential of the construct and who is widely regarded as the “father” of IND-COL. Hofstede interpreted IND and COL as the opposite poles of one continuum, mean-ing that low IND is functionally equivalent to high COL. However, the unidimensional interpre-tation of IND-COL was later challenged by a number of scholars who suggested that IND and
COL can actually represent two independent continua (e.g., Markus & Kitayama, 1991; Oyserman, 1993; Singelis, 1994; Triandis, 1994). A bidimensional view of IND and COL assumes orthogonality between the two, indicating that one’s position on the IND continuum is indepen-dent of one’s position on the COL continuum. Thus, one could simultaneously score high (or low) on both dimensions.1
The ambiguity regarding the dimensionality is not unique to IND-COL. For example, intro-version–extraversion, happiness–unhappiness, negative and positive affect, masculinity– femininity, and work–life balance were also originally seen as bipolar unidimensional constructs. As with IND-COL, it was later suggested that perhaps one could be both—introvert and extro-vert, masculine and feminine, happy and unhappy, or score high on work and personal life involvement—at the same time (e.g., Carrigan, 1960; Constantinople, 1973; Green & Salovey, 1999). As such, the debate on the factor structure of these constructs also continues.
Given the prevalence and importance of the IND-COL construct, it is not surprising that the question of its dimensionality has been a topic of a heated debate. Unfortunately, the literature presents mixed evidence on the issue. According to meta-analytic reviews by Oyserman et al. (2002) and Taras et al. (2010), the number of empirical studies that use unidimensional measures of IND-COL (instruments that yield a single IND-COL score) is roughly equal to that of studies that rely on instruments measuring IND-COL as two independent constructs (and yield two sepa-rate scores for IND and COL). Further complicating the matter, some of the studies that measured IND and COL separately found near-zero correlations (e.g., Singelis, 1994), negative correla-tions (e.g., Lam, Chen, & Schaubroeck, 2002), or even positive correlacorrela-tions (e.g., Bresnahan et al., 2005) between IND and COL.
The uncertainty regarding the relationship between IND and COL poses a challenge for inter-preting, comparing, and meta-analyzing findings reported in the literature. For example, it is unclear whether findings from studies that used instruments designed to measure IND-COL as a unidimensional construct are comparable to the findings of studies that used instruments that assess IND and COL as independent constructs. Should measures of both constructs be reported in studies, or would reporting only one be sufficient? If a study finds that IND has a positive effect on a particular outcome, can it be assumed that the effect of COL on the outcome is negative? If one scores high on IND, can it be assumed that one would score low on COL? Should the IND and COL scores be combined in a single index for the meta-analysis purposes, or should the two be kept separate? Do the answers to these questions depend on which instrument is used to quantify IND-COL, the level of analysis, or the sample characteristics on which the results are based?
The present study addressed these questions through a series of seven tests of the IND-COL dimensionality. The analyses were based on meta-analytic data from 149 publications and 50 original individual-level datasets shared by authors of studies that reported separate IND and COL means and correlations. The findings of this study could help classify, interpret, and gener-alize the findings from the wealth of published research on IND-COL.
We begin with a brief qualitative review of IND-COL conceptualization, including its defini-tions, related hypotheses, and survey items used to operationalize the construct. After describing our data, we detail the methodology and findings of each of the seven tests that were used to assess the relationship between IND and COL. We then explore how the sample characteristics and the cultural region represented by the data may affect the dimensionality of IND-COL. Finally, we conclude with an integrative summary and discussion of the results of our multi-method study, review their implications, and offer guidelines for future research.
IND-COL Conceptualization
There is no single commonly accepted definition of IND-COL. Hofstede (1980) defined IND as “a loosely knit social framework in which people are supposed to take care of themselves and of
4 Journal of Cross-Cultural Psychology XX(X) their immediate families only,” and COL as “a tight social framework in which people distin-guish between ingroups and outgroups, [and] expect their ingroups to look after them, and in exchange for that they feel they owe absolute loyalty to it” (p. 45). Although Hofstede provided two seemingly independent definitions for IND and COL, he interpreted them as the opposite poles of one continuum. These definitions, however, never gained acceptance among scholars who view IND and COL as orthogonal constructs. Instead, authors who use a bidimensional framework of IND-COL typically cite definitions offered by Markus and Kitayama (1991), Singelis (1994), and other pioneers of the orthogonal interpretation of IND-COL.
Of the 149 papers in our meta-analytic sample, 126 provided formal operational definitions of IND-COL. The definition offered by Singelis (1994) is among the most frequently cited, which defined IND as a “bounded, unitary, and stable self that is separate from social context” and COL as a “flexible, variable self that emphasizes statuses,. . . roles, and relationships, belonging and fitting in, [and] being indirect in communication” (p. 581). In most cases, however, a combina-tion of derivatives from earlier definicombina-tions is provided to offer a more comprehensive definition.
One glaring inconsistency throughout the literature is how IND-COL is conceptualized and defined. A review of the publications included in the meta-analytic sample used in the present study revealed that although the possibility of the independence of IND and COL was explicitly acknowledged in 38% of the sample (and implied in the rest of the papers), most definitions were either entirely composed of (or amended with) summaries of key attributes of IND and COL that highlight the opposite and often mutually exclusive nature of the two, such as independence versus interconnectedness, focus on individual versus group goals, uniqueness versus fitting in, and the like. Furthermore, to indicate the inversely related nature of the two, 82.7% of the defini-tions of IND and COL used wording such as “in contrast,” “conversely,” or “as opposed to” in an apparent attempt to highlight that one is the reverse of the other. We acknowledge that such word-ing is not necessarily indicative of the author’s perception of IND and COL as the extremes of a single continuum or mutually exclusive constructs, but it is hard to interpret it in any other way.
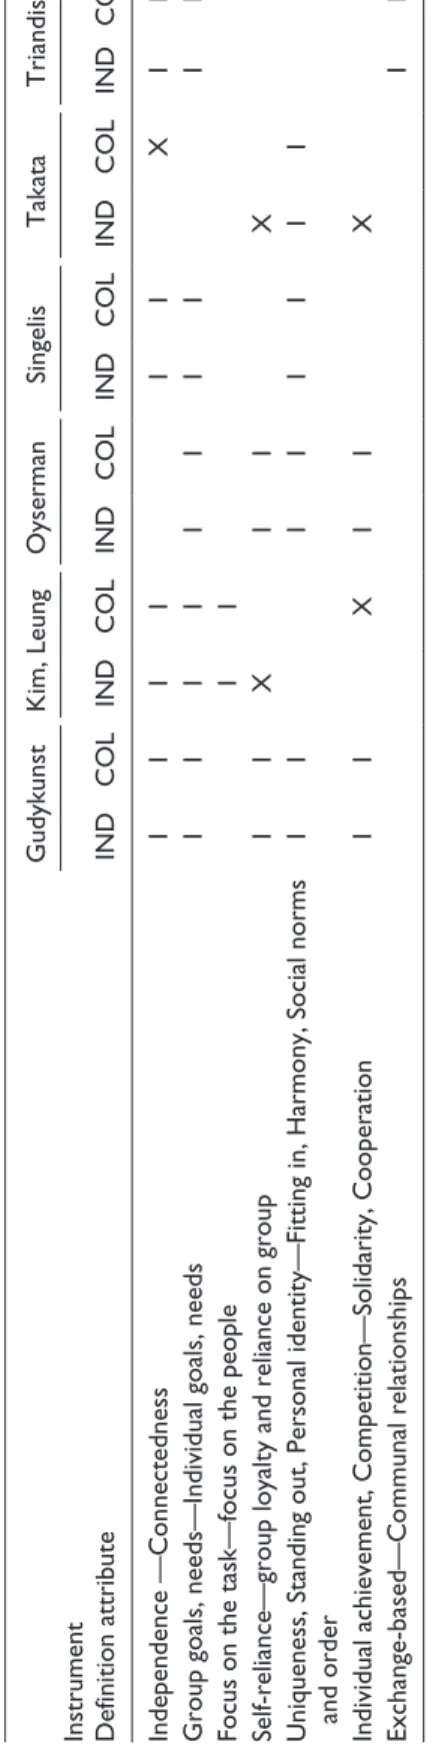
Although a thorough comparative analysis of IND-COL definitions in all available literature is beyond the scope and goals of the present study, we have reviewed the definitions provided in the papers that introduced the six IND-COL measurement instruments analyzed here. As can be seen in Table 1, even though these are the instruments that were specifically designed to measure IND and COL as separate constructs, the operational definitions provided by the authors of the instruments were largely composed of contrasting pairs of attributes of IND versus COL— namely, a total of 45 attributes of IND-COL have been mentioned across the six definitions of which 40 were provided in contrasting pairs and only 5 were postulated without an explicit oppo-site for IND versus COL. These directly related inverse paired statements strongly suggest uni-dimensional conceptualization of IND-COL.
Even more revealing was the analysis of hypotheses stated in the reviewed papers. A total of 126 hypotheses pertaining to IND-COL were listed in the papers in our meta-analytic database. Of those, 87.3% were provided in pairs, one for IND and one for COL, with the wording for IND being virtually identical, but reversed, compared with the direction of the hypothesized effect for COL. Although these observations are not sufficient to make any conclusions either about the true nature of the relationship between IND and COL, or about how scholars actually see the relationship between the two based on a review of the definitions and hypotheses, it does appear that most authors conceptually regard IND and COL as opposites.
The present study is not the first to address the issue of IND-COL conceptualization and dimen-sionality. There have been a number of studies on the topic, most notably, the one by Brewer and Chen (2007), who offered an in-depth theoretical review supplemented by a content analysis of several IND-COL measurement instruments. We build on this earlier research and advance our understanding of the issue by quantitatively examining the IND-COL dimensionality through a
Table 1.
Definitions Provided by the Authors of the Reviewed Individualism–Collectivism Measurement Instruments.
Gudykunst Kim, Leung Oyserman Singelis Takata Triandis
Instrument Definition attribute
IND COL IND COL IND COL IND COL IND COL IND Independence —Connectedness I I I I I I X I
Group goals, needs—Individual goals, needs
I I I I I I I I I
Focus on the task—focus on the people
I
I
Self-reliance—group loyalty and reliance on group
I I X I I X
Uniqueness, Standing out, Personal identity—Fitting in, Harmony, Social norms and order
I I I I I I I I
Individual achievement, Competition—Solidarity, Cooperation
I I X I I X Exchange-based—Communal relationships I Note.
I = the definition attribute is provided as a part of a contrasting pair of attributes, one for Individualism and one for Collectivism. X = the definition element is provided without
6 Journal of Cross-Cultural Psychology XX(X) series of seven tests, four at the individual, two at the group, and one at the national level of analy-sis. We focus on six popular instruments that operationalized IND and COL as separate constructs. It is particularly challenging to integrate the findings when some studies separate IND and COL while other studies take the traditional unidimensional approach. We seek to test whether one-factor or two-one-factor solutions provide a better fit for the data collected using these instruments and examine how the dimensionality of IND and COL may vary across various instruments, as well as across samples, cultural regions, and level of analysis.
Method
Two different sources of data were used in the present study. First, a meta-analytic database was created by coding data from 149 empirical papers that used instruments for measurement of IND and COL as separate constructs and that yielded separate scores for IND and COL. Second, to further validate our findings, all (co)authors of the 149 papers were contacted with a request for their original individual-level data. In response, a total of 50 original datasets were shared for further evaluation. The reliability and validity of studies that rely on original data are usually considered superior to those that use meta-analytic approach (Gudykunst, Matsumoto, Ting-Toomey, & Nishida, 1996). However, the meta-analytic approach allows for a larger and more representative sample and moderator variable analyses that cannot be conducted using a single original dataset. Therefore, both databases (meta-analytic and original data) were used in the present study. Table 2 provides characteristics of respondents in each dataset.
Meta-analytic data. A review of earlier meta-analyses on IND-COL (Coon & Kemmelmeier, 2001; Levine et al., 2003; Oyserman et al., 2002; Steel & Taras, 2010; Taras et al., 2010; Taras et al., 2012) and publicly available descriptions of instruments for measuring cultural values (Taras, 2013) suggested that six instruments for measuring IND and COL as two separate con-structs have been commonly used by cross-cultural scholars. They are those offered by Gudykunst and colleagues (1996), Kim and Leung (1997), Oyserman (1993), Singelis (1994)2, Takata (1993), and Triandis (1994). The appendix lists original items in each instrument. Our literature search was designed to locate published and unpublished studies that used these survey instru-ments. We first conducted an electronic search through Google Scholar and more specialized databases such as EBSCO, PsycINFO, and ProQuest for studies that involved empirical assess-ment of IND-COL. Second, the references in each article in our initial pool were reviewed for links to publications potentially containing relevant data. Third, our review revealed that some studies involved measurement of IND and COL but reported no IND-COL means or correlations. Therefore, 28 (co)authors of 17 articles were contacted and asked for additional data. Of those, 21 replied and 11 provided the requested data. The final pool of studies that met our meta-analy-sis selection criteria included 149 journal articles, book chapters, dissertations, conference pre-sentations, and unpublished studies that provided a total of 295 sample-level data points.3
Each study was reviewed and the following information, when available, was recorded: instrument type, measurement reliabilities, IND and COL means, correlations between IND and COL (as well as correlations between each of the constructs and external variables), sample sizes, and sample demographics. All studies were independently coded at least twice. In a few cases of coding inconsistencies, further reviews were conducted to reach agreement. If other measures of statistical association were used to describe the relationships between IND-COL and external variables (e.g., d-scores, t, or F statistics), they were converted to product–moment correlations (Schmidt & Hunter, 2004).
Individual-level data. Recognizing limitations of meta-analytic data, we subsequently attempted to obtain original individual-level data from the studies included in our meta-analysis. We contacted
Table 2. Sample Description. Instrument Gudykunst Kim, Leung Oyserman Singelis Takata Triandis Sample MA O-IL MA O-IL MA O-IL MA O-IL MA O-IL MA Total N 1,965 1,217 3,489 187 1,050 528 26,207 21,818 329 659 3,249 k (meta-analysis only) 6 14 5 102 5 17
% North America (vs. Other)
85.0 25.2 65.9 100 100 100 79.5 90.6 0.0 0.0 50.1 % West (vs. East) 80.3 47.6 65.2 100 100 100 60.5 95.4 0.0 65.6 51.8 Average age 22.8 21.6 24.0 20.9 19.9 18.7 23.4 22.5 21.5 23.3 22.4 % Male 26.5 24.7 30.4 43.6 44.5 43.9 40.2 41.3 46.6 49.6 28.5 % Student 97.8 63.11 69.9 100 10 100 86.2 93.6 100 100 82.6 % White NA 8.05 NA 16.9 NA 58.9 35.3 58.4 0.0 NA NA
Cronbach’s alpha (Ind/Col)
0.71/0.65 0.75/0.64 0.81/0.84 0.69/0.72 0.77/0.74 0.56/0.65 Note.
MA = meta-analytic sample. A different number of data points were available for each meta-analytic test; the values here are averages across all meta-analytic tests. O-IL =
8 Journal of Cross-Cultural Psychology XX(X) all the authors (except for a few who could not be located) of the 149 papers included in our meta-analytic database with request for their original data. A total of 50 datasets representing 24,514 individuals, collected using six different instruments, were shared for further individual-level analysis. In addition to the IND-COL item and composite scores, we also retained, when available, variables representing respondent characteristics, such as age, gender, country of ori-gin, ethnicity, and student status for moderator variable analysis. The datasets were merged item by item into one large database. Subsets representing different IND-COL measurement instru-ments were analyzed separately.
Data standardization to account for differences in response styles. Prior research has demonstrated that samples from different cultures may yield different results not only because of the true underlying respondent differences but also because of the differences in the response styles in these different cultures, such as acquiescent and extreme responding styles (Harzing, 2006; Hui & Triandis, 1989; Smith, 2004). Cross-cultural differences in response styles are of particular concern when the purpose of the study is to compare means across populations because they may lead to misleading conclusions about intergroup differences. Response set may also affect the relationships among the constructs, typically inflating the correlations.
Recognizing the problem, a number of methods for correcting for response sets in cross-cultural data have been suggested (for reviews, see Fischer, 2004; Fischer & Milfont, 2010; Smith & Fischer, 2008). Mean adjustment is typically used to account for acquiescence bias, whereas dispersion adjustment (commonly standard deviation or range) is used to correct for extreme response style. Adjustments can be made within subjects, within groups (typically sam-ple or study), or within culture, depending on how the response styles are believed to be clus-tered. For example, if it is believed that the response style systematically differs across cultures, within-culture standardization is used. If it is believed that there may be differences in response styles across individual respondents, within-subject standardization is used. Furthermore, adjust-ments could be performed using covariates through such approaches as partial correlations or one-way AN(C)OVA. A single correction method, or a combination of correction methods, can be used. Unfortunately, as with any data manipulation, data standardization may distort underly-ing interitem relationships. As noted by Fischer (2004), standardized data have “various undesir-able properties, especially for statistical techniques involving correlations” (p. 278) and other multivariate analyses. Results and interpretation based on standardization may be ambiguous and even misleading.
Rather than relying on a single standardization method to account for individual and cross-cultural response style differences, we used several standardization techniques that appeared relevant in the context of the present study. Whenever possible, we conducted our analyses in six different ways using (a) unstandardized data, (b) within-subject mean, (c) within-culture/country mean, (d) within-country dispersion, (e) within-subject dispersion, and (f) within-country mean and dispersion standardization. We used neither within-subject double standardization (mean and dispersion), as this approach renders data unsuitable for correlational analysis, nor covariate adjustment, as we did not have the data necessary for this kind of adjustment. In addition, we tried within-study standardization, but the results were almost identical to those obtained using unstandardized data, and, thus, these findings will not be discussed.
Statistical analyses. A wide range of tests is available to assess dimensionality of a construct. Unfortunately, no single test can provide a conclusive answer to the question of construct dimensionality. Even the most rigorous tests, such as confirmatory factor analysis, leave room for ambiguity and subjectivity in the interpretation of the results. Therefore, we used a series of seven different tests—namely, at the individual level of analysis, we used (a) correlations using original data, (b) correlations using meta-analytic data, (c) exploratory factor analysis,
and (d) confirmatory factor analysis; at the group level of analysis, (e) correlation analysis using meta-analytic data and (f) criterion validity assessment; and at the national level of analysis, (g) analysis of correlations between various measures of IND and COL. Furthermore, to examine how the relationship between IND and COL may vary across contexts, each test was repeated using data subsets representing different instruments, cultural regions, demo-graphic groups, and levels of analysis. When possible, the data were also standardized to account for response style differences. Descriptions of the methodology and summaries of findings of each test are as follows.
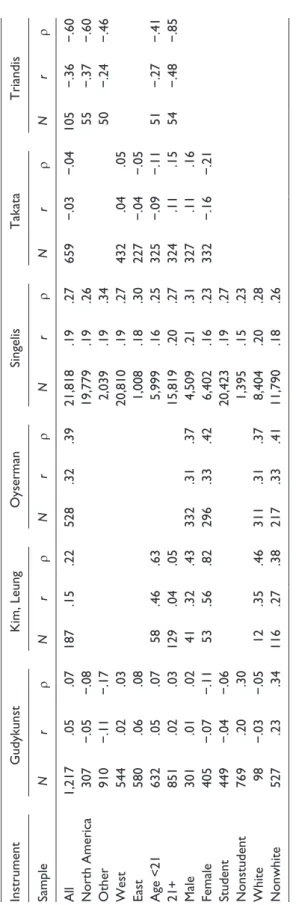
Correlation Analysis Using Original Individual-Level Data
Assessing the correlation between IND and COL composite scores is the most direct way to assess the relationship between the two constructs. Correlation coefficients near zero would indi-cate that the two constructs are orthogonal. Strong negative correlations would indiindi-cate that the two constructs represent the opposite ends of a single continuum. Strong positive correlations would indicate that the two are measures of the same construct. Although most research methods references (e.g., Cohen & Cohen, 1983) provide guidelines for classifying correlation coeffi-cients into “small,” “moderate,” and “strong” effect categories (typically r of less than .30, .30-.50, greater than .30-.50, respectively), there is no commonly accepted threshold for what would constitute a correlation coefficient small enough to indicate orthogonal constructs or strong enough to indicate overlapping constructs. A correlation of zero would clearly indicate unrelated constructs. A correlation (absolute value) close to the commonly accepted internal consistency reliability threshold of .70 (e.g., Nunnally, 1978) would suggest that the measures assess the same construct. Unfortunately, statistical significance tests provide little guidance because their results are greatly affected by sample size. With large samples as in the present research, even smaller coefficients would likely be statistically significant but of questionable practical signifi-cance. In addition, the commonly used statistical significance cutoff points are rather arbitrary (Lance, Butts, & Michaels, 2006).
Furthermore, given that measurement of IND-COL relies on multi-item self-report question-naires, measurement unreliability may distort the true relationships between the constructs. Table 3 also provides correlation coefficients (ρ) corrected for attenuation (Spearman, 1910). However, the practice of correcting correlation coefficients for unreliability is not without controversy (c.f. Muchinsky, 1996), and such findings should be interpreted with caution.
For the purpose of the present study, we proposed that absolute uncorrected correlation of less than .20 (less than 4% of shared variance) be interpreted as indicative of IND and COL indepen-dence, while absolute correlations greater than .30 (more than 9% of shared variance) indicate nonindependence. Obviously, the use of other statistical thresholds for interpreting the relation-ship between the constructs could lead to different conclusions.
Our data allow for testing the correlations at the individual level of analysis using original and meta-analytic data. Correlations were close to zero for the instruments by Gudykunst, Kim, and Leung, Singelis, and Takata, indicating that these four instruments may be measuring two inde-pendent constructs (Table 3). On the other hand, for the instruments designed by Triandis and Oyserman, the correlations were stronger than our threshold of .30, indicating that IND and COL as measured by these two instruments may represent opposite ends of the same construct.
Curiously, the correlations were negative for the instrument by Triandis, clearly indicating that IND and COL, as measured by this instrument, are the opposite extremes of a single con-tinuum. In constrast, the correlations for Oyserman’s instrument were positive, as were the cor-relations for the instrument by Singelis and by Kim and Leung, although in the latter cases, they were less than our .30 threshold. From the purely statistical perspective, the direction of the cor-relations is of little concern as negative and positive corcor-relations indicate nonindependence. In
Table 3.
Correlation Analysis Using Original Individual-Level Data.
Instrument Gudykunst Kim, Leung Oyserman Singelis Takata Triandis Sample N r ρ N r ρ N r ρ N r ρ N r ρ N r ρ All 1,217 .05 .07 187 .15 .22 528 .32 .39 21,818 .19 .27 659 −.03 −.04 105 −.36 −.60 North America 307 −.05 −.08 19,779 .19 .26 55 −.37 −.60 Other 910 −.11 −.17 2,039 .19 .34 50 −.24 −.46 West 544 .02 .03 20,810 .19 .27 432 .04 .05 East 580 .06 .08 1,008 .18 .30 227 −.04 −.05 Age <21 632 .05 .07 58 .46 .63 5,999 .16 .25 325 −.09 −.11 51 −.27 −.41 21+ 851 .02 .03 129 .04 .05 15,819 .20 .27 324 .11 .15 54 −.48 −.85 Male 301 .01 .02 41 .32 .43 332 .31 .37 4,509 .21 .31 327 .11 .16 Female 405 −.07 −.11 53 .56 .82 296 .33 .42 6,402 .16 .23 332 −.16 −.21 Student 449 −.04 −.06 20,423 .19 .27 Nonstudent 769 .20 .30 1,395 .15 .23 White 98 −.03 −.05 12 .35 .46 311 .31 .37 8,404 .20 .28 Nonwhite 527 .23 .34 116 .27 .38 217 .33 .41 11,790 .18 .26 Note. N = sample size.
r = correlation between Individualism and Collectivism.
ρ = correlation between Individualism and Collectivism, corrected for measure unreliability. The sum
of
N
of subgroups (e.g., North America plus Other) does not always equate to the total
N
(All) because not all studies provided complete information on their sample characteristics
the context of our study, the positive correlation is unexpected. It suggests that IND and COL, as measured by these instruments, are not independent and that the measures may represent the same or significantly overlapping constructs. Note, the positive correlations may also be an arti-fact of the survey response set, as well as the use of a unipolar response scale, unreliable responses, and shared method variance, or indicate other problems with the measures.
The correlation results obtained using standardized data (not reported here due to page con-straints) reverse the direction of the relationship for the instrument by Gudykunst. Although the uncorrected correlations were .05 overall, and generally fluctuated from approximately .02 to .20 depending on subsample, the within-culture mean and mean-dispersion standardizations reversed correlation from −.10 to −.17, suggesting that the positive correlations may have been observed due to differences in acquiescence and socially desirable response bias across cultures. The dis-persion corrections, commonly used to correct for extreme response bias, did not result in nega-tive correlations and even made the posinega-tive correlations stronger. The corrections, however, had no appreciable effect on the IND-COL correlations observed for the other instruments.
Individual-Level Correlation Analysis Between IND and COL
Using Meta-Analytic Data
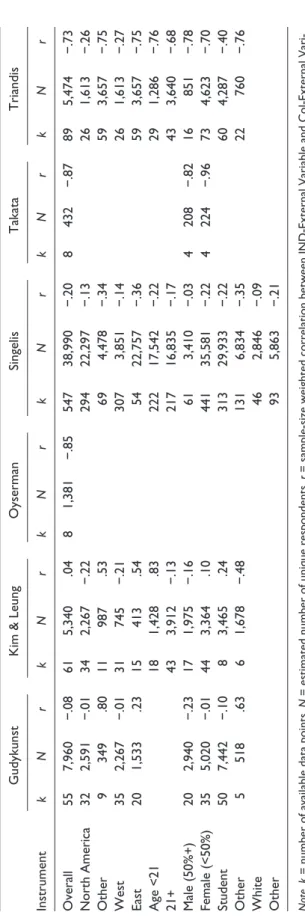
Next, we repeated the within-sample correlation test using a meta-analysis of published litera-ture. Depending on the instrument, our literature search identified 5 (the instrument by Kim and Leung) to 102 (the instrument by Singelis) studies that reported individual-level within-sample correlations, representing a total of 36,289 individuals. The data were meta-analyzed following Schmidt and Hunter’s (2004) procedures for random-effects models. Sampling error in the mea-sures was calculated at the aggregate level. In addition to simple weighted meta-analytic effects (r), we also report estimates of the relationships between IND and COL corrected for attenuation (ρ). Table 4 provides a summary of the meta-analysis.
The results of the meta-analysis are generally consistent with those for the original individual-level data. As before, comparatively high negative correlations were observed for Triandis’s instrument, and correlations close to zero emerged for the instruments by Kim and Leung and by Singelis. The correlations for the instruments by Gudykunst, Oyserman, and Takata were nega-tive but weak, although in the case of Takata’s instrument, the attenuation-corrected correlation index exceeded our .30 threshold. Overall, the findings suggest that IND and COL, as measured by the instruments by Gudykunst, Kim and Leung, Oyserman, and Singelis may indeed be inde-pendent constructs, whereas a unidimensional view of IND-COL may be more suitable for the instruments by Takata and Triandis. Interestingly, all credibility intervals and Q statistics (not reported in Table 4) indicated low consistency and thus the likely presence of moderators in the relationships. This issue will be further discussed below.
Exploratory Factor Analysis
Factor analysis is an especially precise and comprehensive method for evaluating the dimension-ality of a construct. We first used exploratory and then confirmatory factor analysis to evaluate the relationship between IND and COL. We conducted separate analyses for each of the instru-ments and, when sufficient data were available, for each of the demographic and national groups to examine whether there are differences in the factor structure of IND-COL across different contexts.
In the exploratory factor analyses, we first did not specify the number of factors to be extracted and then repeated the analyses forcing one-factor and two-factor solutions. In each case, we examined unrotated solutions and solutions with orthogonal and oblique rotation. Because there
Table 4.
Individual-Level Correlation Analysis Between IND and COL Using Meta-Analytic Data.
Instrument Gudykunst Kim Leung Oyserman Singelis Takata Triandis Sample k N r ρ k N r ρ k N r ρ k N r ρ k N r ρ k N r ρ All 6 1,965 −.19 −.25 14 3,489 .00 .00 5 1,050 −.11 −.16 102 26,207 .07 .10 5 329 −.25 −.35 17 3,249 −.25 −.31 North America 5 1,398 −.06 −.07 61 14,559 .07 .10 7 1,482 −.12 −.17 Other 2 451 .27 .33 13 3,417 .08 .12 7 1,228 −.33 −.41 West 7 1,691 −.03 −.04 62 14,751 .08 .12 7 1,482 −.12 −.17 East 2 451 .27 .33 11 2,863 .06 .08 6 1,040 −.36 −.44 Age <21 2 589 −.13 −.16 53 12,281 .08 .12 8 1,209 −.29 −.33 21+ 8 1,992 .04 .05 41 9,677 .05 .07 8 1,853 −.24 −.30 Student 7 1,174 −.01 −.02 85 22,703 .09 .12 9 2,041 −.23 −.29 Other 5 1,596 .03 .04 4 1,259 .03 .04 8 1,209 −.29 −.33 Correlations Age 5 1,212 −.85 10 2,581 .30 102 26,207 −.26 16 3,170 .68 Sex ( F = 1 M = 0) 5 1,212 −.44 10 2,581 −.33 102 26,207 .10 17 3,250 .30 Note. k = number of studies. N
= total number of individuals.
r = sample-size weighted meta-analytic correlations.
ρ =
meta-analytic effect size, sample size weighted and corrected
for unreliability/attenuation. The values in the last two rows (age, gender) represent sample-size weighted correlations between the strength of the relationship between IND and COL and the average age and gender composition of the sample. The sum of k of subgroups (e.g., North America plus Other) does not always equate to the total k (All) because not all studies provided complete information on their sample characteristics and therefore not all observations could be included in the subgroup comparison analysis. IND = Individual
is no single statistical criterion to conclusively interpret the results of factor analyses, a number of indicators must be considered in reaching a conclusion, but even then the final decision may not be self-evident. To determine the preferred solution, we evaluated the Eigenvalues, scree plots, factor loadings, and other relevant statistics. With a total of almost over 8,000 result sets (up to 13 different subsamples by demographics and region; unrestricted, forced one-factor and two-factor solutions; unrotated and both orthogonally and obliquely rotated solutions, using raw and standardized data, for each of the six instruments), we provide here only a summary of our findings.
Overall, the results were somewhat troubling: For none of the six instruments could we obtain a neat one-factor or two-factor solution with all items loading on their respective factors. In most cases, regardless of whether standardized or unstandardized data and unrotated or rotated solu-tions were used, the items loaded on at least two, and more often three or more, factors. A forced two-factor solution usually resulted in only about 60% to 80% of the items loading on their respective latent factors, with the results being somewhat better for the rotated solutions. The item loadings for the instruments by Gudykunst, Takata, Triandis, and Singelis were closer to what would be expected based on the hypothesized two-factor model (on average, about 70% to 90% of the items loading as expected), whereas the results for the instruments by Kim and Leung and by Oyserman could only be described as unacceptable (on average, only 50% of the items loading as expected).
Overall, it appears that for the instruments by Gudykunst, Singelis, and Takata, the two-factor solution is a preferred one, although more complex multifactor solutions could not be dismissed. For the instrument by Triandis, the unstandardized data appeared to better match the two-factor model, although oblique rotation provided consistently better results suggesting that the IND and COL factors are not independent. Furthermore, the one-factor model was a better fit for the within-culture standardized data. No definitive conclusions could be drawn for Kim and Leung’s and Oysterman’s instruments.
Confirmatory Factor Analysis
Next, we subjected the data to confirmatory factor analysis. Using structural equation modeling, we focused on comparing three different solutions: one factor, two independent factors, and two correlated factors. Confirmatory factor analysis yields a wide range of indicators that could pro-vide epro-vidence in support of the hypothesized underlying factor structure of the construct in ques-tion, from goodness-of-fit indices to factor loadings. We primarily relied on a comparison of chi-square, GFI, and RMSEA indices, as well as the reported relationships between the latent IND and COL constructs (Tabachnick & Fidell, 2001). As before, for each instrument, the tests were repeated for each of the demographics and cultural region subsamples using unstandardized data and data standardized in five different ways. With more than 1,400 different result sets, we can report only a summary of our findings.
Several trends emerged from the analyses. First, virtually no solution, irrespective of the instrument or specific subsample, provided a good fit for the data. The GFI and RMSEA rarely reached the conventional goodness-of-fit standards. For example, GFI indices averaged .77 and .82, and the RMSEA indices averaged .09 and .08 for one- and two-factor solutions, respectively. The standardized data provided similar goodness-of-fit statistics. The indices were compara-tively better for the instruments by Singelis and Triandis, although still generally below the rec-ommended cutoff levels (Kline, 1998). The data fit was rather poor for the other instruments, because all goodness-of-fit indicators were lower, at times substantially, than the accepted thresholds.
Second, based on the comparison of one- versus two-factor solutions, the results indicated that a two-factor solution produced better data-fit indices for all instruments. However, whereas the
14 Journal of Cross-Cultural Psychology XX(X) two-factor solution was substantially better for the instruments by Gudykunst, Singelis, and Takata, the differences were negligible for the instruments by Kim and Leung, Oyserman, and Triandis.
Third, the two-factor solution that allowed for correlation between IND and COL latent fac-tors was almost always preferred to the solution that assumed IND-COL independence. The dif-ference was particularly noticeable for the instruments by Takata and Triandis, suggesting that in the case of these two instruments, IND and COL are not truly independent.
Furthermore, the correlations between latent constructs representing IND and COL were strong and negative for the instrument by Triandis (around −.90) and negative, albeit weaker, for the instrument by Takata (around −.20). The IND-COL correlations for the instruments by Gudykunst and by Kim and Leung were close to zero, providing further support for the inde-pendence of the two constructs when measured by these instruments. Consistent with earlier findings, the correlations for the instruments by Oyserman and Singelis were strong and posi-tive (around .50 and .40, respecposi-tively). However, when within-culture standardized data were used, the correlations dropped to around .30 for the Oyserman’s and around −.10 for Singelis’s instruments, suggesting that the positive correlations may, at least partially, be a response set artifact.
Group-Level Correlations
Our last three tests evaluate the relationship between IND and COL at the aggregate level, two at the sample and one at the national level of analysis. First, we consider the group-level tions between the two constructs. In addition to reporting individual-level within-sample correla-tions, most studies in our meta-analytic sample also reported sample means for the IND and COL dimensions that could be used to test the relationship between the two at the group level. Here, we used the same approach as in an earlier test, but instead of using individual-level data, we correlated sample means for IND and COL.
The results at the group-level analysis (Table 5) are generally consistent with the individual-level findings, although the correlations are stronger, which is common for aggregated-individual-level data. Consistent with our earlier findings, the correlations were close to zero for the instruments devel-oped by Gudykunst and Singelis, providing further support to the interpretation that the IND and COL scores represent independent constructs when measured by these instruments. Furthermore, we found a strong negative correlation between IND and COL for the instruments developed by Oyserman and Triandis, confirming earlier findings of unidimensional nature of IND-COL when measured using these instruments. Unexpectedly, we also found strong negative correlations for the instruments by Kim and Leung and by Takata, which, contrary to earlier findings, suggested a unidimensional structure to the data. These results suggest that the factor structure of IND-COL at the group level may differ from that at the individual level, at least for some of the instruments. Unfortunately, only a few data points were available for these analyses, which limits the reliabil-ity and generalizabilreliabil-ity of our findings.
Criterion Analysis: Correlations Between IND and COL and
External Variables
We noted earlier that the vast majority (87.3%) of the hypotheses listed in the 149 papers in our database were provided in pairs, predicting the effect of IND to be opposite to that of COL. Although the hypotheses can only tell us, at best, how the authors of the studies conceptualized IND-COL within a larger nomological net, our next test offers empirical evaluations of how IND and COL relate to external constructs, which can help clarify how the two relate to each other.
Table 5.
Group-Level Correlations.
Gudykunst
Kim & Leung
Oyserman Singelis Takata Triandis Instrument k N r k N r k N r k N r k N r k N Overall 21 3,572 .00 30 5,488 −.53* 3 490 −.86* 230 35,748 .18* 3 208 −.91 38 5,195 North America 16 2,389 .09 18 2,821 −.16 180 26,365 .13 13 3,374 Other 5 1,183 −.09 11 2,560 −.73* 48 9,209 .23 25 1,821 West 18 2,907 .04 16 2,821 −.15 188 29,593 .11 14 3,424 East 3 665 .53 10 2,560 −.73* 38 5,981 .26 24 1,771 Age <21 7 840 −.11 93 10,666 .49* 6 897 21+ 19 4,017 −.37 88 16,721 .10 15 1,816 Male (50%+) 6 573 .86 8 1,252 .07 125 21,409 .04 15 1,245 Female (<50%) 15 2,999 −.01 20 3,997 −.64* 65 8,435 .30* 10 1,753 Student 170 24,882 .14 Other 28 4,788 .27 White 25 3,850 .42 Other 56 8,064 .19 Note. k = number of studies. N
= total number of individuals.
r = sample-size weighted meta-analytic correlation. The sum of
k and
N
of subgroups (e.g., North America plus Other)
does not always equate to the total
k and
N
(All) because not all studies provided complete information on their sample characteristics and therefore not all observations could be
included in the subgroup comparison analysis. *significant at
16 Journal of Cross-Cultural Psychology XX(X) This is probably the most useful test as far as interpreting and integrating the findings from ear-lier studies. It tests whether the effects of IND and COL on third constructs can be assumed to be opposite.
Of the 149 papers in our sample, 105 provided paired correlations between IND and COL and other variables included in the studies. A total of 768 pairs of correlations were available for analysis, each represented by a correlation coefficient between IND and the criterion and COL and the same criterion. Our analysis was based on an evaluation of the relationship between each pair of correlations. A negative relationship between the IND-criterion and COL-criterion cor-relation coefficients would indicate that the cor-relationship between IND and the criterion tends to be opposite to that between COL and the criterion. Cases such as this would provide support for a unidimensional view of IND-COL and would essentially indicate that the effects of IND could be reversely generalized to the effects of COL. A positive relationship between the correlations would suggest that the relationship between IND and COL with the criterion is the same in terms of the direction, suggesting that the two represent the same (or closely overlapping) constructs. Finally, nonsignificant relationships between the pairs of correlations would suggest that IND and COL are independent constructs and should be interpreted separately.
Table 6 summarizes the results of our analysis. The results are generally consistent with those of the tests at the individual level of analysis. We found strong negative correlations for the instruments by Oyserman, Takata, and Triandis, which provided support for the unidimensional nature of IND-COL as measured by these instruments. In addition, as per our previous tests, the correlations were close to zero for the instruments by Gudykunst, Kim and Leung, and Singelis, further corroborating a bidimensional view of IND-COL for these instruments. The results indi-cate that, similar to the individual level of analysis, at the group level, IND and COL are indepen-dent constructs when measured by these instruments. In other words, the strong negative correlations for the instruments by Oyserman, Takata, and Triandis indicate that the observed effects of IND could be generalized to that of COL with the opposite sign. On the other hand, the very weak correlations for the instruments by Gudykunst, Kim and Leung, and Singelis indicate that such generalizations would not be valid as the effects of IND and COL are likely indepen-dent from one another.
Relationship Between Unidimensional Versus Bidimensional
Models of IND-COL
When comparing findings on IND-COL from studies that used the Hofstedean unidimensional conception of IND-COL and those that treated IND and COL as separate constructs, it is often not clear how these bodies of research findings can be integrated and compared with each other. When coding data for meta-analytic purposes, can data from studies that used these two compet-ing frameworks be combined, or should they be coded separately? Our final test addresses this question by evaluating the relationship between the unidimensional and bidimensional IND-COL indices. Unfortunately, we could not locate any studies or datasets that involved measure-ment of IND-COL using both unidimensional and bidimensional instrumeasure-ments within the same sample. Therefore, the test could only be conducted at the national level of analysis. Based on the available bidimensional IND-COL data, we calculated national IND and COL averages as mea-sured using Singelis’s instrument. The other instruments have only been used in one to four countries and, thus, could not yield data for a large enough sample for such an analysis. Therefore, the findings presented here apply only to the instrument by Singelis and may not generalize to other instruments.
We assessed the relationship between IND and COL as measured by the Singelis’s instrument and IND-COL as measured by Hofstede’s instrument at the national level of analysis. We used
Table 6.
Criterion Analysis: Relationship Between IND-External Variable and Col-External Variable Correlations.
Gudykunst
Kim & Leung
Oyserman Singelis Takata Triandis Instrument k N r k N r k N r k N r k N r k N Overall 55 7,960 −.08 61 5,340 .04 8 1,381 −.85 547 38,990 −.20 8 432 −.87 89 5,474 North America 32 2,591 −.01 34 2,267 −.22 294 22,297 −.13 26 1,613 Other 9 349 .80 11 987 .53 69 4,478 −.34 59 3,657 West 35 2,267 −.01 31 745 −.21 307 3,851 −.14 26 1,613 East 20 1,533 .23 15 413 .54 54 22,757 −.36 59 3,657 Age <21 18 1,428 .83 222 17,542 −.22 29 1,286 21+ 43 3,912 −.13 217 16,835 −.17 43 3,640 Male (50%+) 20 2,940 −.23 17 1,975 −.16 61 3,410 −.03 4 208 −.82 16 851 Female (<50%) 35 5,020 −.01 44 3,364 .10 441 35,581 −.22 4 224 −.96 73 4,623 Student 50 7,442 −.10 8 3,465 .24 313 29,933 −.22 60 4,287 Other 5 518 .63 6 1,678 −.48 131 6,834 −.35 22 760 White 46 2,846 −.09 Other 93 5,863 −.21 Note. k
= number of available data points.
N
= estimated number of unique respondents.
r = sample-size weighted correlation between IND-External Variable and Col-External Vari
able Correlations. The sum of
k and
N
of subgroups (e.g., North America plus Other) does not always equate to the total
k and
N
(All) because not all studies provided complete
18 Journal of Cross-Cultural Psychology XX(X) national sample-size-weighted IND and COL averages derived based on the data from the studies that used Singelis’s instrument and Individualism national scores offered by Hofstede. The results at the national level of analysis are consistent with our earlier findings. The correlation between IND and COL remains close to zero for the instrument by Singelis (r = −.13), which reveals a remarkably robust bidimensional structure of the data collected with this instrument across indi-vidual, group, and national levels. As for the relationship between bidimensional and unidimen-sional IND-COL scores, Hofstede’s IND correlates positively with Singelis’s IND (r = .42) and negatively with COL (r = −.61). The correlations may not be strong enough to indicate functional equivalence, but the results clearly suggest a substantial overlap between unidimensional and bidimensional frameworks of IND-COL at the national level. Given that data for only one instru-ment and representing only a small number of countries were available for the analysis, the reli-ability and generalizreli-ability of these findings may be limited. However, this first-of-its-kind analysis provides some initial insights into the relationship between different frameworks of IND-COL. Hopefully, future research will explore the issue in more depth.
Moderator Analysis
The analyses performed so far examined the dimensionality of IND-COL in a broad context. However, just as the IND-COL values vary across different populations, so may the dimensional-ity of the construct (Triandis, 1989). Earlier research on IND-COL identified a number of factors that may affect the IND-COL values. For example, IND-COL has been commonly discussed in the context of the West versus East (e.g., Earley, 1993). A meta-analysis by Oyserman et al. (2002) refined the focus and contrasted IND-COL values of European Americans versus those of other demographic groups. Although the focus here was on the mean differences, structural dif-ferences may exist as well. For example, a recent debate (see Hofstede, 2006; Javidan, House, Dorfman, Hanges, & Sully de Luque, 2006) on strengths and limitations of existing cultural models, among other things, has addressed the “American” origin of the models, either by the virtue of the sample (e.g., IBM employees in Hofstede’s study) or by institutional affiliation of the lead scholars on the project. One of the implications of the debate was that the models com-monly used for studying IND-COL may not apply in non-North American or non-Western cul-tures. Initial empirical support for the notion that the dimensionality of IND-COL may vary across ethnic groups was provided by Rhee, Uleman, and Lee (1996), who found that the IND-COL attitudes toward kin seemed to converge along one bipolar dimension in the Korean and European American samples, but two factors seems to fit the data better in the Asian American sample; and by Komarraju and Cokley (2008), who showed that the relationship between IND and COL may be different in African American and European American populations (cf. Vargas & Kemmelmeier, 2013).
Furthermore, cultural values, and possibly the structure of these values, may vary not only across cultural regions but also across demographic groups. For example, demographic charac-teristics such as gender, age, education, and socioeconomic status may not only shape cultural orientation (e.g., Steel & Taras, 2010) but also value structure (e.g., Fischer, Milfont, & Gouveia, 2011; Fontaine, Poortinga, Delbeke, & Schwartz, 2008). Last, the use of student samples in social research has been questioned on the grounds that such sampling may provide results that are not generalizable to larger populations (Deshpande, Joseph, & Viswesvaran, 1994).
Hofstede repeatedly emphasized that his framework applies only at the national level of analysis. In contrast, the authors of bidimensional IND-COL instruments presented them as individual-level measures. Thus, it is possible that the structure of IND-COL varies at different levels of analysis.
Although a topic of much debate and speculation, no clearly formulated theory has been put forth as to how IND and COL should relate to each other in different contexts. Even studies that addressed the issue of IND-COL dimensionality directly (e.g., Rhee et al., 1996) provided no
compelling theoretical rationale for the observed differences in IND-COL value structure in dif-ferent populations. Therefore, we offer no hypotheses regarding moderators of the dimensional-ity of IND-COL. Rather, we approached the issue as a research question and simply compared unidimensional versus bidimensional models within different contexts.
The available data allowed us to examine possible IND-COL dimensionality differences across major cultural regions and demographic groups. Specifically, we reanalyzed the data across the following subsamples: Eastern versus Western culture countries (Asia vs. North America, Western Europe, and Australia), North America versus other regions, age groups (younger vs. older than 21), male versus female, students versus others, and Europeans (White) versus others. In addition to the results for entire samples, Tables 2 to 7 provide the results by each of these subsamples. Several distinct trends emerged based on the comparison of the results across different contexts. We discuss them in detail below.
Instrument
First, the choice of the instrument has an effect on the dimensionality of IND-COL. The unidi-mensional solution was consistently preferred for the instrument by Triandis, whereas the results for the instruments by Gudykunst, Kim and Leung, and Singelis consistently favored a bidimen-sional view of IND-COL. The results for the instruments by Oyserman and Takata were mixed, with three of the six tests supporting a one-factor solution, one test supporting a two-interrelated-factor solution, and two tests supporting a two-two-interrelated-factor solution.
We conducted a series of post hoc tests to explore why different instruments yield IND-COL data that have a different factor structure (Table 7). Similar to Brewer and Chen (2007), we reviewed the items in each instrument and classified them with respect to (a) the content area, (b) reference target, and (c) statement type (e.g., self-identification, agency beliefs, and values). Furthermore, for each of the analyses, we calculated the overlap between IND and COL items with respect to their classification, as well as the number of different item types included in each instrument.
Several instrument characteristics appear to affect instrument dimensionality. First, complex-ity of the instrument content, as measured by the number of content areas, had a clear effect on the construct dimensionality. Three of the instruments characterized by a unidimensional struc-ture covered only four to seven different domain areas (Takata, Triandis, and Oyserman with four, five, and seven areas covered, respectively). The other instruments that consistently showed a better fit for the two-factor solution covered 8 to 11 areas.
Second, the IND-COL item pairing or overlap had a clear and strong effect on the instrument dimensionality. In the instruments by Triandis and Takata, which consistently showed a better fit for the unidimensional view of IND-COL, 83.3% and 90.0% of the items were provided in matching contrasting pairs; that is, for almost every IND item there was a reverse COL item. The overlap was lower but still substantial for the instrument by Oyserman (44.4%), which also gen-erally fit a unidimensional view of IND-COL better. In contrast, the overlap was only 14.8% to 35.7% for the other instruments that were shown to fit a bidimensional view of IND-COL.
The findings were the same based on the analysis of the items with respect to the item referent target and item type. In the instruments by Triandis and Takata, which provided a closer fit with a unidimensional view of IND-COL, the items had one (in-group) and two (in-group and indi-vidual self) referent targets, respectively. Likewise, the items in these instruments clustered into only one or two different types (e.g., agency/relationship beliefs). Furthermore, the IND-COL item overlap was 90% to 100% for these two instruments. In contrast, the other instruments had four or more referent targets and were of three different types. In addition, only 11.1% to 22.2% of the items were paired with respect to the item referent target and up to 44.4% with respect to the item type.
Table 7.
Instrument Content Analysis.
Gudykunst Kim, Leung Oyserman Singelis Takata Triandis
Instrument Content area
COL IND COL IND COL IND COL IND COL IND COL IND Achievement, competition 1 3 Context importance 2
Decision making, concern for opinion of in-groups
4 1 2 1 1 2 5 5
Directness vs. indirectness, face saving concerns
2
1
1
2
Duty and helping
1 1 2 1 Family 1 2 2
Goals and interests, self versus group
1 1 4 4 1 1 1
Group harmony, conformity, conflict avoidance
7 5 3 1 2 4 1 3 3 1 Hierarchy, respect 1 2 1 1
Modesty versus self-promotion
1
Self-reliance
3
2
1
Independence versus relatedness
4 1 1 1 1 1 2 2 Self-identification 2 Uniqueness 4 6 5 Number of areas 8 8 7 11 4 5 % overlap 14.8 35.7 44.4 25.0 90.0 83.3
Referent target Individual self (S)
8 11 4 1 8 1 2 In-groups (I) 10 12 4 1 8 9 8 6 6 Out-groups (O) 2 4 4 2 1 3
Self versus in-group tradeoff (S-I)
2
1
2
3
2
Self versus out-group trade-off (S-O)
2 % overlap 22.2 0.00 11.1 16.6 90.0 100.0 Number of areas 5 4 5 4 2 1
Statement type Self-representation
1 8 11 1 4 10 1 2 Agency/relationship beliefs 11 5 12 4 6 1 10 2 8 9 6 6 Value 2 1 2 4 2 % overlap 44.4 28.6 44.4 16.6 90.0 100.0 Number of areas 3 3 3 3 2 1 Note.
Our conclusions are fairly simple and expected. First, instruments that contain less diverse items with respect to the item domain, referent target, and type tend to yield data that fit simpler, unidimensional views of IND-COL, whereas greater item diversity results in data with multidi-mensional factor structure. Second, a unidimultidi-mensional view of IND-COL fits better the instru-ments that are based on paired IND and COL items.
Cultural Context
The analyses indicate that IND and COL may have a different structure in North American versus non-North American and Western versus Eastern samples. In most cases when such a comparison could be made, the results for the non-North American sample were closer to the one-factor solu-tion than were the results for the North American sample. The same result was found for samples from Western versus Eastern countries. This trend was observed for all six instruments, although the difference was not as pronounced for some instruments as for others. Even though the mod-erating effect of region (North America vs. Others, East versus West) was not strong enough to change the dimensionality of IND-COL in some cases, the support for a two-factor solution was clearly weaker in non-North American/Eastern subsamples.
Demographics
The moderating effects of demographics were less pronounced. Different analyses provided sup-port for different interpretations, and no reliable conclusions could be drawn. For example, there were a number of indications that the one-factor solution may be a preferred (or second best option) in younger (less than 21) compared with older (21 and older) samples and for student samples compared with nonstudent samples. However, such interpretations were not definitive as opposite trends were also evident. The differences for gender and ethnicity were even more inconsistent, indicating that the IND-COL structure does not systematically differ across these sample characteristics.
Level of Analysis
Finally, based on a comparison of the results of the tests at the individual (Tests 1-4) versus group (Tests 5-7) level of analysis, fairly consistent evidence emerged that the dimensionality of IND-COL leans toward a unidimensional solution at the group level compared with that at the indi-vidual level. For the instruments by Triandis, Takata, and Oyserman, the group-level analyses clearly supported a unidimensional view of IND-COL, and at least some evidence led to the same conclusion for the instruments by Kim and Leung and by Gudykunst. The instrument by Singelis consistently produced results that supported a bidimensional view of IND-COL at the individual and group level, but the national-level analyses provided support for the unidimensional view of the construct.
Discussion
IND-COL has been the cornerstone of cross-cultural psychology over the past several decades. Despite its popularity, the construct is not without controversies, the most notable of which is the issue of dimensionality of IND-COL. Some scholars regard IND and COL as the opposites of a single continuum. Others regard IND and COL as orthogonal factors and believe that they are independent constructs. The confusion about how IND and COL relate to each other leads to a concomitant ambiguity about the interpretation and generalizability of research findings. For example, it is unclear how to meta-analyze the wealth of research on IND and COL and integrate
22 Journal of Cross-Cultural Psychology XX(X) findings from studies that treat IND-COL as a single bipolar construct versus those that approach IND and COL as two orthogonal dimensions.
Integrative Overview of the Findings
As discussed by Meehl (1978), in “hard” natural sciences, there tends to be a clear understanding of what a phenomenon is and one agreed-on instrument for its measurement. In “soft” social sci-ences, however, for just about any construct, there seem to be multiple definitions and various measurement instruments. Our review clearly shows that, as it stands, IND-COL is certainly one of those “soft” constructs. There are more than 100 competing instruments for measuring IND-COL, with some of them operationalizing it as a single bipolar construct and others treating IND and COL as independent factors. Some models further split IND and COL into horizontal and vertical facets (e.g., Singelis et al., 1995), or measure them separately with respect to different domains of relationships (e.g., family, friends, neighbors, etc., Hui, 1988).
Our multi-method review also showed that the dimensionality of IND-COL systematically varies across instruments used to collect the data, cultural regions, level of analysis, and, possi-bly, demographic characteristics of the sample. First, differences in the dimensionality of IND-COL were discovered across the analyzed instruments. A bidimensional structure of IND-IND-COL has been consistently observed for the instruments by Gudykunst, Kim, and Leung, and Singelis. On the other hand, the results for the instruments by Triandis, and somewhat less consistently for the instruments by Oyserman and Takata, provided support for a unidimensional structure. The instrument content, as characterized by the item diversity with respect to the domain, referent target, and item type, as well as pairing of IND and COL reverse-worded items explains, at least partially, the resulting differences in the data dimensionality.
Second, even though IND-COL emerged as a bidimensional construct for some of the ana-lyzed instruments and as a unidimensional construct for others, both sets of instruments revealed systematic deviations in the factor structure across cultural regions. Specifically, evidence for a bidimensional structure was much more consistent in North American and Western samples, whereas more evidence for a unidimensional structure was usually provided in non-North American and Eastern samples. Although in most cases, the difference was not strong enough to completely reverse the dimensionality of IND-COL, we consistently detected systematic devia-tions from the overall solution across different cultural regions. It should be kept in mind that the vast majority of the samples in our database were drawn from student populations, which mini-mized variation in age, socioeconomic status, and, possibly, world outlook. IND-COL dimen-sionality differences would likely be greater if the samples from each cultural region were more representative of their general populations.
Third, initial evidence suggested that demographics may moderate the dimensionality of IND-COL. Our results indicated that the construct dimensionality may vary across age cohorts, gen-der, ethnicity, and student/nonstudent status of the respondents, although findings were mixed. While our tests provided no conclusive answers about the moderating effect of demographics, based on the fact that some of the tests clearly suggested a difference, future research into the issue may be more fruitful.
Fourth, our findings also provided evidence that IND-COL structure may vary across the lev-els of analysis. The results at the group and national levlev-els of analysis tended to fit a unidimen-sional solution, whereas individual-level tests generally favored a bidimenunidimen-sional view of IND-COL. In other words, at the individual level of analysis, IND and COL may be independent constructs. However, as we move up to the aggregate levels of analysis, the relationship between IND and COL becomes more pronounced, and they lean toward becoming the opposites of a single continuum. This may explain why studies focused on national cultures, such as those by Hofstede (1980) or the GLOBE team (House et al., 2004), settled for a unidimensional view of