IDENTIFICATION OF PREDOMINANT HEPATITIS C VIRUS GENOTYPE IN TURKISH POPULATION
A THESIS SUBMITTED TO
THE DEPARTMENT OF MOLECULAR BIOLOGY AND GENETICS AND
THE INSTITUTE OF ENGINEERING AND SCIENCE OF BILKENT UNIVERSITY
IN PARTIAL FULFILLMENT OF THE REQUIREMENTS FOR THE DEGREE OF MASTER OF SCIENCE
By FUNDA ŞAR
I certify that I have read this thesis and that in my opinion it is fully adequate, in scope and in quality, as a thesis for the degree of Master of Science
Prof. Dr. Mehmet Öztürk
I certify that I have read this thesis and that in my opinion it is fully adequate, in scope and in quality, as a thesis for the degree of Master of Science
Assoc. Prof. Dr. Aykut Özkul
I certify that I have read this thesis and that in my opinion it is fully adequate, in scope and in quality, as a thesis for the degree of Master of Science
Assist. Prof. Dr. Rengül Atalay
Approved for the Institute of Engineering and Science:
Prof. Mehmet Baray
III
ABSTRACT
IDENTIFICATION OF PREDOMINANT HEPATITIS C VIRUS GENOTYPE IN TURKISH POPULATION
Funda ŞAR
M.S. in Molecular Biology and Genetics Supervisor: Prof. Dr. Mehmet ÖZTÜRK
July, 2001
Hepatitis C virus (HCV) is a major cause of acute and chronic hepatitis, leading to cirrhosis and hepatocellular carcinoma. Approximately 170 millions of person are chronically infected with HCV worldwide. HCV is an enveloped positive stranded RNA virus with 9.5 kb genome. The error-prone replication of HCV leads to its highly heterogeneous nature. There are 6 main genotypes and around 70 subtypes. The genotypes and subtypes of HCV have different prevalence rates and geographical distributions. They also differ in clinical manifestations, such as response to interferon treatment and disease progression. The identification of genotype distribution is of scientific importance because of its help in understanding of epidemiology of HCV and the clinical implications of the genotypes. In a previous study, conducted in our laboratory, the predominant genotype of HCV in South and Southeast Anatolia regions of Turkey was determined as subtype 1b with 91% prevalence. Subtype 1a, 2a and 4 were also present with lower prevalences, 6.3%, 1.3%, 1.3%, respectively. The high prevalence rate of subtype 1b and limitations of genotyping from 5' UTR in discrimination between subtype 1a from subtype 1b lead to confirmation of these results from another region of HCV genome. In this study, to confirm the results of the
IV
previous study we sequenced part of NS5B region and constructed phylogenetic tree. The results of this study were in concordance with the former study, indicating the predominant genotype as subtype 1b in South and Southeast Anatolia regions of Turkey. After identification of subtype 1b as the predominant genotype, a Turkish HCV-1b isolate was sequenced. Cloning and the partial sequence of HCV-1b isolate was performed by Aslý Öztan and in this study, we obtained the complete nucleic acid sequence of a Turkish HCV-1b isolate. It comprises 9361 nucleotides, including 306 nucleotides of 5' UTR, a single long open reading frame of 9033 nucleotides, and 22 nucleotides of 3' UTR. By sequence comparisons, we characterized the Turkish HCV-1b isolate.
Keywords: Hepatitis C Virus (HCV); genotyping; subtype 1b; NS5B; Southern
V
TÜRK TOPLUMUNDA BASKIN OLARAK GÖRÜLEN HEPATİT C VİRÜSÜ GENOTİPİNİN BELİRLENMESİ
Funda ŞAR
Moleküler Biyoloji ve Genetik Yüksek Lisans Tez Yöneticisi: Prof. Dr. Mehmet Öztürk
Temmuz, 2001
Akut ve kronik hepatitin en önemli nedenlerinden biri olan hepatit C virüsü (HCV) siroz ve karaciğer kanserine neden olmaktadır. Dünyada yaklaşık 170 milyon insanın HCV ile enfekte olduğu sanılmaktadır. HCV zarflı, pozitif, tek iplikli RNA virüsü olup, 9.5 kilobazlık bir genoma sahiptir. Hata oranı yüksek replikasyonu nedeniyle HCV genomu çok sayıda değişime uğramıştır. 6 genotipi ve yaklaşık 70 subtipi bulunmaktadır. Bu genotip ve subtipler farklı coğrafi bölgelerde, farklı sıklıkta görülmektedir. Ayrıca genotip ve subtipler interferon tedavisine cevap ya da farklı hastalık seyri gibi değişik klinik özelliklere de sahip olabilirler. Genotiplerin dağılımının ve baskın genotipin belirlenmesi epidemiyolojik çalışmalar ve de genotiplerin farklı klinik özellikleri nedeniyle bilimsel önem taşımaktadır. Labaratuvarımızda HCV genomunun 5' UTR bölgesi kullanılarak yapılan önceki genotipleme çalışmasında Güney ve Güney Doğu Anadolu bölgelerindeki baskın HCV genotipi subtip 1b (91.1 %) olarak belirlenmiştir. Ayrıca subtip 1a (6.3%), 2a (1.3 %) ve gentotip 4 (1.3 %) daha düşük yüzdelerle saptanmıştır. Önceki çalışmada yüksek subtip 1b oranının bulunması ve 5' UTR bölgesinin subtip 1a ve subtip 1b yi birbirinden ayırmadaki yetersizliği nedeniyle bulunan sonuçların doğrulanması gereği doğmuş ve
VI
bu çalışmada aynı örneklerin HCV genomunun NS5B bölgesi kullanılarak genotipleri tekrar belirlenmiştir. NS5B bölgesinin bir kısmı çoğaltılmış ve elde edilen nükleotid dizisi ile soy ağacı kurulmuştur. Sonuçlar bir önceki çalışmayı doğrulamış ve Türkiye’nin Güney ve Güney Doğu Anadolu bölgelerindeki baskın HCV genotipinin subtip 1b olduğu gösterilmiştir. Bu sonucun elde edilmesinden sonra Aslı Öztan bir Türk hastadan HCV genomu izole etmiş ve klonlamıştır. Klonlanan izolatın nükleotid dizisinin belli bir bölümü elde edilmiş ve bu çalışmada tüm dizi belirlenmiştir. Türk HCV subtip 1b izolatı 9361 nükleotidten oluşmaktadır ve 306 nükleotid 5' UTR, 9033 nükleotid açık okuma çerçevesi ve 22 nükleotid 3' UTR içermektedir. Türk subtip 1b izolatının amino asit düzeyinde diğer HCV izolatlarıyla karşılaştırılmış ve karakterize edilmiştir.
Anahtar Sözcükler: Hepatit C virüsü; genotipleme; NS5B; Güney ve Güney Doğu
VII
TABLE OF CONTENTS
SIGNATURE PAGE II
ABSTRACT III
OZET V
TABLE OF CONTENTS VII
LIST OF TABLES X LIST OF FIGURES XI ABBREVIATIONS XII 1.INTRODUCTION 1 1.1 Epidemiology 1 1.2 Transmission 3
1.3 Natural History and Disease Manifestations 6
1.4 Diagnosis and Treatment 9
1.5 Variability of HCV Genome 13
1.6 Evolution of HCV 16
1.7 The Concept of Quasispecies 18
1.8 Clinical Significance of HCV Genotypes 21 1.8.1 Molecular Epidemiology and Transmission 22
1.8.2 Diagnosis 23 1.8.3 Interferon Treatment 24 1.8.4 Disease Progression 25 1.8.5 Vaccine Development 26 1.9 Genotyping Methods 27 1.9.1 Type-Specific PCR 27
VIII
1.9.2 Restriction Fragment Length Polymorphism 28 1.9.3 Reverse Hybridization Techniques 28
1.9.3.1 The Line Probe Assay 28
1.9.3.2 DNA Enzyme Immunoassay 29
1.9.4 Direct Sequencing 29
1.10 Aim of the Study 31
2. MATERIALS AND METHODS 32
2.1 MATERIALS 32
2.1.1 Chemicals and Enzymes 32
2.1.2 Equipments 33
2.1.3 Plastic Disposables 34
2.1.4 Solutions 34
2.1.4.1 Solutions for Agarose Gel Electrophoresis 34 2.1.4.2 Solutions for RNA Extraction 35
2.2 METHODS 36
2.2.1 Patients 36
2.2.2 Viral RNA Extraction and cDNA Synthesis 36
2.2.3 Oligonucleotide Synthesis 37
2.2.4 Polymerase Chain Reaction 38
2.2.5 Agarose Gel Electrophoresis of DNA Fragments 39
2.2.6 Automated DNA Sequencing 40
IX
2.2.8 Characterization of HCV-1b Isolate from Turkey 41
3. RESULTS 44
3.1 Review of the Previous Study 44
3.2 Partial Amplification of NS5B Region 46
3.3 Sequence Analyses and Genotype Determination 52 3. 4 Characterization of Turkish HCV-1b isolate 56
4. DISCUSSION 74
5. PERSPECTIVES 80
6. REFERENCES 83
APPENDICES
Appendix A. NS5B Sequences
X
LIST OF TABLES
Table 1.1: Worldwide Hepatitis C Prevalence 2
Table 1.2: Problems in Conducting an Ideal Natural History Study 8 of Chronic Hepatitis C Virus (HCV) Infection
Table 2.1: PCR and Sequencing Primers 37
Table 2.2: Optimized PCR Conditions 39
Table 3.1: Clinical features of 123 HCV antibody-positive 45
patients with or without HCV RNA
Table 3.2: HCV genotypes in Turkish Patients 46
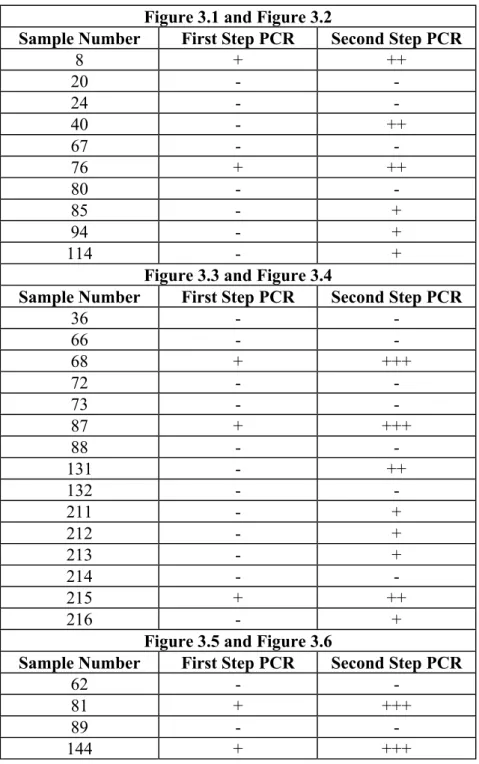
Table 3.3: Semi-quantitative representation of PCR results 51
Table 3.4: Comparison of NS5B genotyping results with 5’ UTR 55 genotyping results
Table 3.5: Summary of codon differences between the HCV-1b 69 Turkish isolate and other characterized HCV-1b genomes
Table 3.6: Comparison of inferred amino acids at proteolytic cleavage sites 73
Table 3.7: Comparison of inferred amino acid sequences at interferon 73 sensitivity determining region
XI
LIST OF FIGURES
Figure 1.1: Novel therapeutic strategies to block hepatitis C virus replication 12
Figure 1.2: Schematic representation of HCV genome 14
Figure 1.3: Phylogenetic analysis of nucleotide sequences from part of the 15 HCV NS5B region amplified from samples of HCV-infected blood donors
and hepatitis patients from several countries
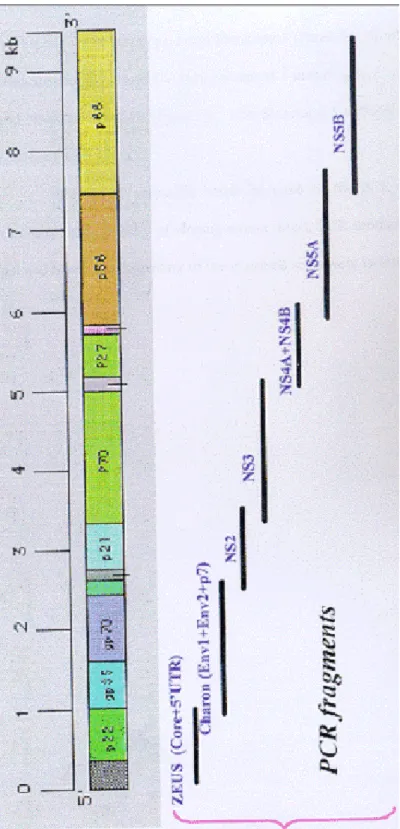
Figure 2.1: Amplification Strategy of HCV Genome 43
Figure 3.1: Agarose gel electrophoresis of PCR1 products. 48
Figure 3.2: Agarose gel electrophoresis of PCR2 products. 48
Figure 3.3: Agarose gel electrophoresis of PCR1 products. 49
Figure 3.4: Agarose gel electrophoresis of PCR2 products. 49
Figure 3.5: Agarose gel electrophoresis of PCR1 products. 50
Figure 3.6: Agarose gel electrophoresis of PCR2 products. 50
Figure 3.7: Phylogenetic analysis of partial NS5B sequences of Turkish 54 HCV isolates.
Figure 3.8: Full genome sequence and protein sequence of Turkish HCV 58 isolate
XII
ABBREVIATIONS
ALT Alanine Aminotransferase
cDNA Complementary Deoxyribonucleic Acid ddH2O Deionized Distilled Water
DEIA DNA Enzyme Immunoassay DNA Deoxyribonucleic Acid dNTP Deoxynucleotide Triphosphate E1 Envelope Protein 1
E2 Envelope Protein 2 EIA Enzyme Immunoassay EtBr Ethidium Bromide
FDA Food and Drug Administration HCV Hepatitis C Virus
HCC Hepatocellular Carcinoma HVR Hypervariable Region IFN-α Interferon- α
ISDR Interferon Sensitivity Determining Region LIPA Line Probe Assay
NS Non-structural Protein PCR Polymerase Chain Reaction
RdRp RNA-dependent RNA Polymerase RFLP Restriction Fragment Length Polymophism
RIBA Recombinant Immunoblot Assay RNA Ribonucleic Acid
TAE Tris Acetate EDTA
WHO World Health Organization UTR Untranslated Region
1
1. INTRODUCTION
1.1 Epidemiology
Hepatitis C is a major cause of acute hepatitis and chronic liver disease, including cirrhosis and liver cancer. An estimated 170 millions of persons are chronically infected with HCV worldwide and 3-4 million persons are newly infected each year (World Health Organization, 2000).
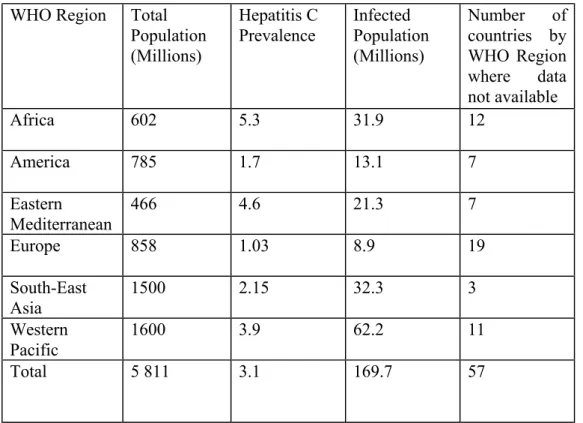
Since the discovery of HCV, global characteristics of epidemiology have been documented, and except for the 57 countries, HCV prevalence rates are known (Table 1.1). In developed countries the HCV prevalence rate is lower than 3%. In United States, 1.8% of population is infected with HCV (Alter, 1997). The HCV prevalence rate is in between 0.2-3% in Europe. In Turkey the prevalence of HCV is % 0.3-1.8 (Babacan et el., 1994; Sharara et al., 1996).
There are a few countries with very high HCV prevalence rate, such as Egypt, where 10-30% of population is infected with HCV (Arthur et al., 1997; El-Sayed et al., 1996; Hibbs et al., 1993). The nationwide company to treat schistosomiasis infections by inoculation of needles in 1970s is hypothesized to be responsible for this high prevalence, as lower HCV prevalence among individuals born after the end of campaign as a preliminary evidence was observed (Angelico et al., 1997; El-Zayadi et al., 1997; Frank et al., 2000). As the study of HCV isolates obtained throughout Egypt did not
2
reveal similar evolutionary distance among isolates and also regional clustering, this hypothesis should be tested further (Ray et al., 2000).
In certain countries undeveloped geographical regions show high HCV prevalence rate. For example, in the Ararhiro region of Japan 45% of individuals over 41 years of age had HCV infection (Kiyosawa et el., 1994).
Table 1.1: Worldwide Hepatitis C Prevalence
WHO Region Total Population (Millions) Hepatitis C Prevalence Infected Population (Millions) Number of countries by WHO Region where data not available Africa 602 5.3 31.9 12 America 785 1.7 13.1 7 Eastern Mediterranean 466 4.6 21.3 7 Europe 858 1.03 8.9 19 South-East Asia 1500 2.15 32.3 3 Western Pacific 1600 3.9 62.2 11 Total 5 811 3.1 169.7 57
3
1.2 Transmission
Current transmission of HCV is primarily associated with parenteral exposure to blood through medical procedures or from needle sharing amongst intravenous drug users. However, the predominant mode of HCV transmission changes over time. For example, blood transfusion became common medical procedure only after Second World War, before that the use of unsterile needles were frequently followed by the cases of jaundice. Predominant transmission routes also differ in between or within countries. While in economically developed countries, mostly HCV infections are mostly related to drug use and also blood transfusion, in economically undeveloped countries traditional or folk medical procedures may lead to HCV transmission.
There are several routes of HCV transmission. Primary one as mentioned above is the blood transfusion. HCV infection was observed in the 80% of recipients of blood from HCV-infected blood donors, (Esteban et al., 1991; Vrielink et al., 1995). This points the great importance of blood screening and development of specific and sensitive HCV detection methods.
HCV outbreaks in the past helped for the understanding of intravenous administration of contaminated blood products (immunoglobulins and clotting factors) as a cause of HCV transmission (Power et al., 1994; Yap et al., 1994). Decontamination of immunoglobulins and the use of recombinant clotting factors would probably decrease the incidence of HCV due to transfusion of blood products.
4
Use of contaminated needles is one of the important routes of transmission, which is the main risk factor for the health care workers. Only 2-8 % of needle exposures lead to HCV transmission (Kiyosawa et al., 1991; Ridzon et al., 1997). This rate depends in part on the quantity of blood transferred, the titer of the virus, and the depth of inoculation. Illicit use of drugs, especially by injection, accounts for the majority of HCV infection in many developed counties. Since 1992, at least two-thirds of new HCV infections in United States have been to due to drug use. Worldwide, 50-95% of persons acknowledging drug use have HCV infection. Needle-exchange programs have been associated with a reduction in HCV incidence, but their use is restricted to certain countries (Hagedorn and Rice, 2000).
Nosocomial transmissions between patients-to-patients, health care workers-to-patients and vise versa happen rarely. In one reported case, use of the same colonoscope, previously used for an HCV infected patient resulted in the transmission of HCV (Bronowicki et al. 1997). There are several cases of HCV transmission between patients-to-patients after dialysis procedure (Jadoul, 2000; McElborough et al., 2001; Taskapan et al., 2001). HCV RNA has been detected in 10-52% of patients on hemodialysis. Duration and frequency of hemodialysis correlates with the risk of transmission (Alter, 1995; Heintges and Wands, 1997).
Transplantation of organs from HCV-infected donors almost always transmits HCV to recipients (Pereira et al., 1991; Terrault et al., 1995). New liver is infected by
5
circulating viruses and/or by viruses possibly produced at extrahepatic sites. However, there are still continuing discussions about the risk factor of transplantation of other organs other than liver from HCV-infected individuals.
Mother-to-infant (vertical) transmission of HCV has been documented with a rate of 0-8% (Halfon et al., 1999; Lam et al., 1993; Reinus et al., 1992; Zanetti et al., 1995). The time of transmission is not known. Therefore, there is no way to prevent it at present. As the antibodies of the mother passes and persists in the child for 12 months, before this period, presence of HCV infection in the child should be tested with PCR.
Sexual intercourse is an inefficient transmission route. Persons with multiple sexual partners or sex workers are in the high risk group of the sexual transmission (Utsumi et al., 1995; van Doornum et al., 1991). The unprotective sexual intercourse, long duration of relationships with HCV-infected individuals also increases the risk of infection. Thomas et al performed a study with sexually transmitted disease clinic patients (without other percutaneous risk factors) and their partners. They observed that sexual transmission of HCV from males to females might be more efficient than from females to males. The prevalence rates of heterosexual and homosexual persons are similar (Thomas et al., 1995).
6
1.3 Natural History and Disease Manifestations
HCV infection either resolves after acute infection or establishes chronic infection in the majority of patients. Incubation period is in average 50 days; it may differ between 15-150 days (Hagedorn and Rice, 2000). In the acute phase of infection, liver cell injury and elevated serum alanine aminotransferase (ALT) levels are observed. Ten times higher ALT level was recorded approximately in 80% of HCV patients (Hoofnagle, 1997). Acute infection is mild or asymptomatic in 65-75% of patients. 20% of patients have jaundice and 10-20% suffers from malaise, anorexia, and abdominal pain (Centers for Disease Control and Prevention, 1998). Acute infection resolves in 2-12 weeks and this is characterized by the disappearance of HCV RNA from blood and return of liver enzymes to normal level (Hoofnagle and Tralka, 1997).
Unfortunately, after acute infection 80-85% of patients develop chronic infection. Hepatitis C is the leading cause of chronic viral hepatitis in many countries due its ability to cause persistent infection by unidentified mechanisms. Chronic infection progresses very slowly after the onset of infection with mild or nonspecific symptoms, including fatigue and malaise. Patients with more severe infection suffer from weight loss, anorexia, and abdominal pain. Serum ALT levels fluctuates in 70% of the patients and 30% of patients have normal levels of ALT. After a long term infection 20% of patients develops cirrhosis and it leads the mortality in 25% of the patients with cirrhosis. It is not clear whether the remaining patients will develop cirrhosis. Marked
7
fatigue, muscle weakness, upper intestinal hemorrhage, jaundice indicates end-stage liver disease in the cirrhosis patients. Once the end- stage liver disease has developed, the only treatment is the organ transplantation. The end-stage chronic hepatitis C is the major cause of liver transplantations (Detre et al., 1996).
Chronic infection with hepatitis C is a major cause of liver cancer in many countries. 1-5% of patients with chronic infection develop hepatocellular carcinoma (HCC) after 20 years. HCC is more likely to develop in paients with cirrhosis and with long duration of infection (Hoofnagle, 1997).
HCV also causes immune-complex mediated extrahepatic diseases, namely essential mixed cryoglobulinemia, poryphyria cutanea torda, glomerulonephritis, keratoconjuctivitis sicca (Johnson et al., 1993; Khella et al., 1995; Tsukazaki et al., 1998).
Natural history studies provided varying estimates of risk progression in chronic hepatitis. Variations in estimations may be due to viral, host and/or environmental factors, and also due to difficulties in performing this type of studies (summarized in Table 1.2). There are three types of natural history studies to determine clinical outcome. Prospective studies starts at the onset of the disease and follow the progress. Retrospective studies are performed with patients with established liver disease. Nonconcurrent prospective studies involve patients that are in the course of infection with historically defined disease onset. All these studies indicated that hepatitis C
8
Table 1.2: Problems in Conducting an Ideal Natural History
Study of Chronic Hepatitis C Virus (HCV) Infection Difficulty in Designing
Requirement for Study HCV Study
* Accurate determination of * Onset of acute infection disease onset and unrecognized in >80% duration of patients and must be
inferred
* Inclusion of full spectrum * Commonly asympto- of acute illness matic; most acute
infections are missed
* Inclusion of full spectrum * Often asymtomatic of chronic illness with normal ALT * Construction of matched * Matched control group control group without not possible without HCV ability to identify acute
onset
* Evaluation of clinical * Treatment of chronic outcome unmodified by HCV infection now
treatment common
* Continuous evaluation to * Period from acute resolution or disease infection to overt
endpoints chronic liver disease can span 20-40 years
9
infection has a benign clinical spectrum in the first 20 years of infection and cause moderate mortality and morbidity. However, after 30-40 years cirrhosis, end-stage liver disease or HCC are likely to be observed with increasing percentage. At present, the clinical spectrum of each individual cannot be predicted. However, factors affecting the natural history can be stated as male sex, older age at infection, alcohol abuse, co-infection with other viruses and additional factors to be discovered.
1.4 Diagnosis and Treatment
Presence of HCV can be determined by either serological or molecular methods. Serological tests detect anti HCV antibodies by utilizing the HCV antigens. Enzyme immunoassay (EIA) is the most commonly used test, as it is least expensive and easiest to use. Its sensitivity is in between 92-95%. There are three versions of this test. EIA-3 is the currently used one with recombinant hepatitis C antigens, c22-3 (encoded by core region), c200 (encoded by NS4 and NS3) and NS5 (encoded by NS5). A positive EIA result does not show present HCV infection, but may indicate the past infection. In addition, a negative result does not exclude the possibility of infection, as antibodies to HCV may not be formed at the time of test. As a result of this, supplemental tests have been developed. Recombinant immunoblot assay (RIBA) with 2 recombinant antigens (c33c and NS5), 2 synthetic peptides (c100p and 5-1-1p) and c22p peptide is designed to resolve false positive EIA results. Supplemental test results reported as positive, negative or indeterminate. If both test results are positive, then the patient is an anti-HCV positive person. A positive EIA test result, nor confirmed by a sequential test
10 result, person is considered uninfected.
Molecular assays involve RT-PCR, branched DNA (Quantiplex HCV RNA 1.0, Chiron Diagnostics, Emeryville, CA) and quantitative DNA assays. The main principle is to detect HCV RNA using amplification techniques. HCV RNA can be detected within 1-2 weeks after exposure to HCV, before changes in ALT levels and development of anti HCV. The qualitative PCR tests are quite sensitive and detect 100-1000 copies per ml of serum. However, they only report the absence or presence of HCV-RNA. The quantitative PCR and branched DNA tests tries to determine the number of HCV-RNA per ml of serum.
There is currently no vaccine available for HCV and therefore, the acquisition of HCV infection cannot be prevented. Interferon-α (IFN-α) monotherapy and combination therapy with ribavirin are the only treatments approved by FDA. IFN-α empowers the immune response by increasing the efficiency of the presentation of viral antigens on the surfaces of infected cells and additionally, it increases the activity of the cytolytic T cells. The standard regimen of the IFN-α is 3 million units of IFN given subcutaneously 3 times-a-week for up to 12 months. Normalized ALT levels and disappearance of HCV RNA from serum indicates the response to IFN which takes place in the 50% of the patients, the remaining suffer a relapse after the cessation of the therapy. Optimizations in dosing and/or chemical modification of IFN improved the response rate, but not the relapse rate. In different studies it has been suggested that increase in the dose of IFN would decrease the resistance to IFN based on the
11
observations including production of high amounts of RNA as 300 billion copies per day (Neumann et al., 1998). Combination therapy with ribavirin, a guanosine analogue has been shown to be effective in untreated and in relapsed patients (Davis et al., 1998; McHutchison et al., 1998). How ribavirin acts against HCV in combination therapy is not known.
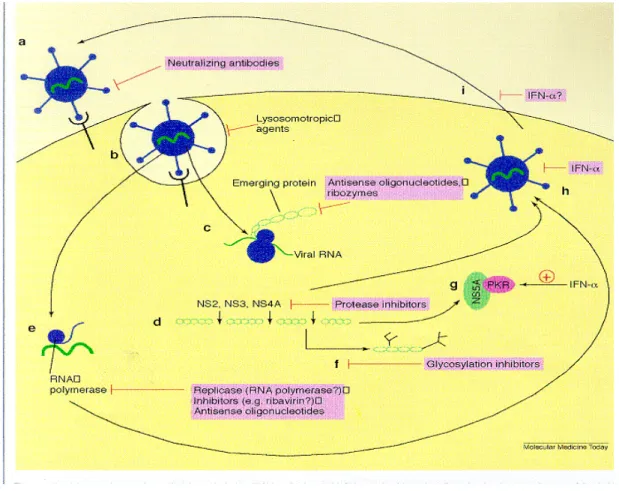
Both IFN-α monotherapy and combination therapy has certain drawbacks. Interferon and ribavirin have significant side effects, IFN should be given by injection, and the cost of treatment is high. HCV 1b and type 4 are less responsive to treatment. These drawbacks lead to investigations of other possible approaches to develop drugs based on the molecular structure of the virus. Different points in the life cycle can be a potential target, such as attachment and entry into cell, early translation, protein processing, replication, viral assembly and export (Figure 1.1). Several drugs targeting the NS3, NS5B or NS4 proteins have been tried, so far no optimal drugs have been found.
12
Figure 1.1: Novel therapeutic strategies to block hepatitis C virus (HCV) replication. Anti-HCV strategies (shown in red) can be aimed at several stages of the viral life cycle, including: (a) receptor binding; (b) penetration and uncoating; (c) early translation of viral polyprotein; (d) viral protein processing by proteases, including NS2, NS3 and NS4A; (e) RNA replication; (f) glycosylation of viral envelope proteins; (g) activation of latent RNase L and RNA-dependent protein kinase (PKR); (h) virion assembly; and (i) virion release. The current therapy of choice, interferon α (IFN-α) is believed to block the viral life cycle at several stages, including at (g), (h) and (i).
13
1.5 Variability of HCV Genome
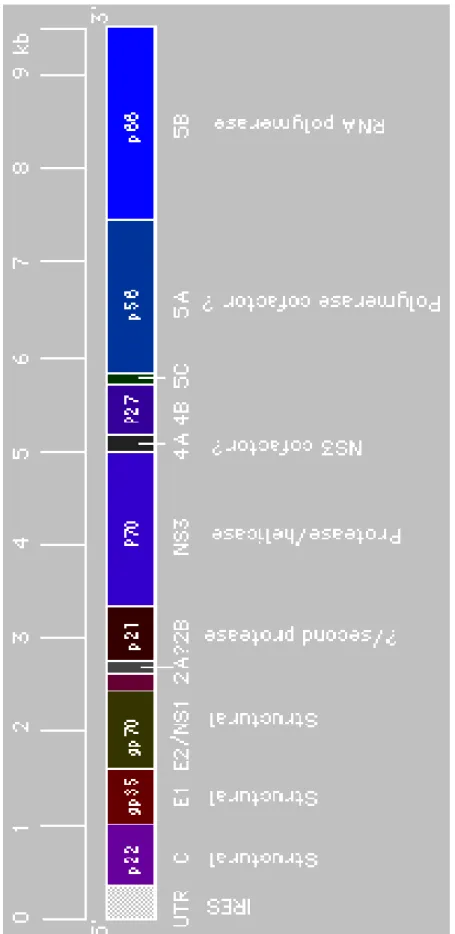
HCV is an enveloped positive strand RNA virus, with approximately 9.5 kb genome. Similar to flaviviruses, HCV genome encodes a large polyprotein from which structural (core, E1, and E2) and nonstructural (NS2, NS3, NS4A, NS4B, NS5A, and NS5B) proteins are processed by cellular and viral proteases (Figure 1.2). HCV has been classified as a member of the family Flaviviridae because of its similarity in genomic organization to flavivirus and pestivirus. All have same N terminal location of structural proteins and C terminal location of nonstructural proteins. Pestivirues, flaviviruses and HCV have similar hydrophobicity profile of polyprotein (Choo et al., 1991). They also share relative location of nucleocapsid, envelope glycoprotein, putative protease, helicase and replicase.
HCV shows a great degree of variability in different regions of its genome and in the whole genome, which is manifested at the level of quasispecies (within a single host) and of genotypes (within populations). HCV exists as highly variable isolates or strains. Within a single host, the isolate is found as a group of different, but closely related sequences, termed as quasispecies. The isolates of HCV are classified into genotypes based on the sequence similarities. The isolates with more than 85% sequence similarity in their genome are put into same subtype. The subtypes are grouped into types and ones showing 77-80% similarities in nucleotide sequence belong the same type. Between the types of HCV there are almost 65% sequence similarity.
14
15
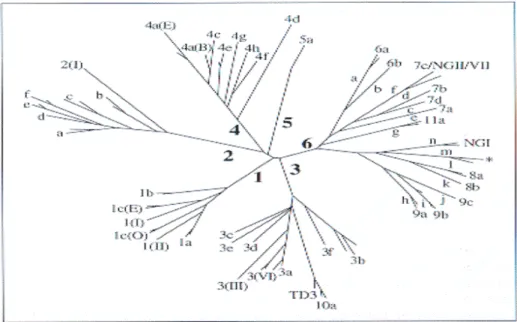
Based on this threefold hierarchical system, there are six main genotypes, numbered 1 to 6 and approximately 70 subtypes, lettered a, b, c in the order of discovery (Figure 1.3). Recently, in Vietnam (Tokita et al., 1994), Thailand (Apichartpiyakul et al., 1994; Mellor et al., 1995; Tokita et al., 1995) and in Indonesia (Tokita et al., 1996) new novel genotypes have been identified. They are distinct from types 1 to 6, but more closely related to type 6 than to other genotypes (Tokita et al., 1994). These variants caused a problem in attempting to categorize, as they appear to be intermediate in variability between the type and subtype categories (Simmonds et al., 1995; Tokita et al., 1996).
Figure 1.3: Phylogenetic analysis of nucleotide sequences from part of the HCV NS5B region amplified from samples of HCV-infected blood donors and hepatitis patients from several countries. Six main groups of sequence variants are found corresponding to types 1-6; each group contains a number of more closely related subtypes (a, b, c…). Nomenclature of types 1-5 and 6a follows the consensus proposal for classification of HCV. Recently discovered variants from South East Asia cluster with type 6a but are labeled according to the original publications. TD3/type 10a from Indonesia groups similarly with type 3 variants. Adapted from Reesink, 1998.
16
While some genotypes of HCV, namely type 1a, 1b, 2a, 2b, 3a show worldwide distribution, others such a type 5a and 6a are only found in specific geographical regions. In Western Europe and US hepatitis C patients infected with genotypes 1a, 1b, 2a, 2b, 2c and 3a, each with different frequencies, through Southern and Eastern Europe frequency of 1b increases and it is present as the predominant genotype in Turkey (Abacioglu et al., 1995), which is also supported by our data. In the Middle East and in certain parts of North and Central Africa type 4 predominates. As mentioned above genotype 5a and 6a have restricted geographical range. While type 5a is present in South Africa, rarely found in other countries, type 6a is present in Hong Kong, Maceu, Vietnam.
1.6 Evolution of HCV
There is no historical, archeological and palaentological record of HCV, like many other viruses. The analysis of the current distribution and genetic relatedness provide the limited evidence to construct the HCV evolutionary history. Genetic relatedness analysis involves the calculation of time of divergence of HCV and its variants by using the rate of sequence change with time.
Rate of sequence change over relatively short intervals of time are provided by number studies of experimentally infected chimpanzees or between individuals several years after transmission of HCV from one to the other (Abe et al., 1992; Okamoto et al., 1992a). Presence of HCV patients infected with same, homogenous source batch of
17
antirhesus D immunoglobulin used in 1977 in Ireland provided a good opportunity to calculate rate of sequence change. Sequence comparisons in the NS5 and E1 regions of HCV isolates from the recipients after 17-20 years later revealed the rates of sequence change as 4.1 and 7.1x10⁻¹ per site per year respectively (Smith et al., 1997) with no evidence for variation in rate between individuals.
Assuming the rate of sequence change is constant over time, time of divergence for the variants of same subtype can be calculated. Smith et al calculated the time of divergence of subtype 1b variants as approximately 60-70 years. In this study, 40 NS5 sequence from different parts of the world Europe, US, Japan, Asia was examined and there was no country or region specific phylogenetic groupings, which implies that the initial spread of type 1b was rapid. Type 3a variants show less diversity showing shorter time of divergence (40 years based upon distances in NS5 region), in contrast to type 2a-c with more diversity originating 90-150 years ago. There is no clear explanation of factors affecting the diversification of subtypes. However, increase in the frequency of significant long distance travel between continents is thought to contribute to diversification of the subtypes of HCV 200-300 years ago (Reesink, 1998).
The methods used in calculation of rate of sequence change are generally based upon the silent substitution rates, as it offers several advantages. They are not affected by selection of variants differing in phenotypic properties arising from amino acid changes. Additionally, the functional or structural constraints of HCV proteins or differences in between proteins do not affect the silent substitution rates. However,
18
these methods are not helpful to calculate the time of divergences of HCV genotypes. Since the distances between genotypes are large, evolutionary distances approach or near to saturation. This leads to problems in the corrections of multiple substitutions. Though there are algorithms to correct them, they still lead to underestimation of true evolutionary distances between genotypes. Another difficulty arises from the extrapolation of rate of sequence change measure over a short period of time and its use in the long term events.
In overall, with our current knowledge it is not possible to determine a geographical region or temporal origin for the common ancestor of HCV genotypes. Nonetheless, the geographical distributions as well as antigenic and biological differences between HCV types are correlated with the long term endemic infection with no significant exchange of types between different geographical regions.
1.7 The Concept of Quasispecies
Analogous to the other RNA viruses, HCV circulates as heterogeneous but related genomes, called quasispecies (Bukh et al., 1995; Eigen 1996; Holland et al., 1992; Martell et al., 1992). This viral population is composed of a dominant sequence called master sequence and a number of different sequences. Master sequence generally represents the consensus sequence of the population. The consensus sequence is the sequence resulting from combining the most common nucleotide at each position of the genome and is obtained by direct sequencing of PCR products or by sequence analysis
19
of at least three clones. This sequence might not represent an actual genome in the quasispecies, but it is useful to identify the changes that affect a representative proportion (> 50%) of total quasispecies population.
The heterogeneity of HCV within an individual can be attributed to error prone RNA-dependent RNA polymerase (RdRp) of HCV, NS5B. The absence of proof reading activity of NS5B creates de novo mutations. Recently, HCV RNA turnover rate is calculated in humans as 4-7 hours and this high turnover rate leads to production of 300 billion HCV RNA molecules per day (Lam et al., 1997; Neumann et al., 1998), which contributes significantly to the heterogeneity of HCV. It was hypothesized that the existence of HCV as quasispecies may be the basis of the mechanism for viral persistence. With high numbers of RNA produced per day and NS5B without proofreading activity would lead to production of escape mutants, therefore, HCV establishes chronic infection.
Antibodies as a result of humoral immune response are produced to neutralize HCV. But neutralization does not take place as a sterilizing one because of the replication of minor species escaping from the antibodies, raised against master sequence (Kato et al., 1993; Shimizu et al., 1994; Weiner et al., 1992). Therefore the minor species predominates and establishes the persistent infection. Cell-mediated immunity may also select variants and contributed to persistence of HCV infection. Cell-mediated immune response recognizes more than one epitope (Koziel et al., 1992; Koziel, 1997). This property makes the studies to reveal the importance of
cell-20
mediated immune response more difficult as it creates the need of full length genome analysis to identify important mutations in different regions of HCV genome.
Opposite to reports supporting this hypothesis, there are also contradictory studies. For example, the envelope sequences from persistently infected patients sometimes show no significant change (Higashi et al., 1993; Kumar et al., 1993; Okada et al., 1992) as opposed to others, which have antibodies activities against hyper variability region 1 (HVR-1) in the E2 region preceding or coexisting with variants containing those sequences. RNAs transcribed from infectious cDNA clones from HCV strain H77, genotype 1a inoculated intrahepatically into chimpanzees, long term follow up of chronically infected chimpanzees indicated that there was no amino acid sequence change in the E1 and E2 proteins during the first year of study in the presence of anti-E1 and anti-E2 antibodies (Forns et al., 1999).
There are alternative mechanisms to explain HCV persistence. One of them involves the presence of decoy antigens. Different regions of the genome have been suggested to have different selective pressure. Therefore, while a region stimulates a strong response, mostly ineffective for clearance of virus, it also delay or suppress the response to other less dominant epitopes, providing the focus of immune response to many regions of HCV (Forns et al, 1999).
In addition to its possible importance in the viral persistence, quasispecies may have a role in response to IFN. It was reported that greater degree of quasispecies
21
complexity is related to resistance to IFN (Farci et al., 1997). Quasispecies complexity may provide the selection variants with resistance to drugs. The effect of quasispecies to natural history of infection has not been well characterized. However, it has been suggested that the increase in the quasispecies complexity increases severity of the liver disease (Farci et al., 1997; Honda et al., 1994). To understand the effects of dynamics of quasispecies on disease progression, quasispecies in patients after liver transplantation has been examined and it was observed that orthotropic liver transplantation patients can either retain the major HCV variants that were present before the transplantation, or new quasispecies emerge. In the former case, progression of liver damage is more rapid than the latter case with slower course of infection. This data suggest that some HCV strains might have more pathogenicity. There should be further studies to establish the role of quasispecies in pathogenicity of HCV and outcome of HCV-caused liver disease.
1.8 Clinical Significance of HCV Genotypes
Most of nucleotide sequence differences have been thought to accumulate through evolutionary drift and they are expected to have neutral effect. However, the heterogeneity of HCV might have biological importance (Simmonds, 1995).
Most positive strand RNA viruses have variants similar or more divergent than major genotypes of HCV and variants have similar course of infection. However, Pestiviruses, closely related to HCV have 3 types of variants differing in host range,
22
method of transmission and type of disease. This suggests the HCV genotypes might have biological differences, which might have clinical importance.
Unavailability of cell culture system to propagate of HCV and to study differences in cytopathic properties as well as neutralization of HCV led to use of nucleotide sequence comparisons and genotyping as the main techniques for characterizing different variants of HCV.
Several studies have been performed to investigate the clinical significance of HCV genotypes. The relation of HCV genotype with response to IFN, natural course of infection, outcome after transplantation, diagnosis of HCV antibodies has been suggested and summarized below:
1.8.1 Molecular Epidemiology and Transmission
Genotyping is of scientific importance in characterizing HCV, in understanding its evolution and natural history and also in tracing the routes of transmission in epidemiological studies. HCV genotyping was previously used in suspected cases of mother-to-infant and inter spouse tranmission (Akahane et al., 1994; Ohto et al., 1994). Ohto et al (1994) determined that in 6 out of 7 families studied, the genotypes of mother and infant were the same, indication of vertical transmission. More sensitive determination of transmission is provided by the sequence analysis. The HCV isolates from recipient and suspected source of the infection are sequenced and their relatedness
23 provides the evidence for the transmission.
1.8.2 Diagnosis
One major concern related with the hepatitis C infection is to prevent the new cases of infection. Therefore, the diagnosis of HCV is very important. ELISA is the routinely used technique for diagnosis and most ELISA techniques detect the presence of anti-HCV antibodies in individuals by utilizing recombinant proteins derived from only one genotype (mainly subtype 1a). The reported antigenic variation between genotypes has raised a question about the effectiveness of these tests in determination hepatitis C patients infected with other variants of HCV.
First and second generation HCV antibody tests were found to less sensitive for detection of type 2 and type 3 than type 1 infections (Harrison and Zuckerman, 1997). The reduction in reactivity for type 4 infections is 40% and it is 35 % for type 6 infections (McOmish et al., 1993). Dhaliwal et al examined the sensitivity of third generation ELISA assay and found approximately 5 fold reduction in reactivity of type 2 and type 3 samples compared to that of type 1 samples (Dhaliwal et al., 1996). Genotype-specific sensitivity of all three generation assays may lead to reduction in the number of patients that can be determined if they are infected with genotypes other than type1 and the amount of false-negative results due to this inefficiency has not been calculated.
24 1.8.3 Interferon Treatment
Interferon-α (IFN-α) is the only approved treatment for hepatitis C infection. However, the response rate to therapy is only ~50%. Host factors like age, histology and viral factors such as viremia, and genotype have been suggested as the predictors of sustained response to IFN-α, among which genotype, viremia and histology are independently associated with the outcome of therapy (Chemello et al., 1994; Martinot-Peignoux et al., 1995). The independent effects of viral factors to response suggested the presence of intrinsic property of HCV to confer the sensitivity to IFN-α. Among the analyzed genotypes, 1a, 1b, 3a, 2 and 4, genotype 1b and 4 have been associated with low response rate, while 1a, 3a, 2 have been associated with higher response rate (Chemello et al., 1994; Tsubota et al., 1994; Yoshioka et al., 1992).
As the subtype 1b is highly prevalent in many countries. It has been the focus of attention. Enomoto et al by comparing full length genome sequences identified a 39 amino acid long region (2209-2248) in carboxy terminus of N55A, which is associated with sensitivity to interferon and referred as interferon sensitivity determining region (ISDR) (Enomoto et al., 1996). They found that the IFN-α resistant strains had same sequences with HCV- 1b prototype strains in the ISDR region (HCV- J, HC- J4 and HCV- JTa). Mutations in this region lead the sensitivity to IFN. For example, between ISDR region of type 2 and that of HCV- 1b prototypes there are 14 amino acid differences and deletion of 4 amino acids (Kurosaki et al., 1997). Findings of several studies are in parallel with Enomoto`s study (Chayama et al., 1997a; Halfon et al.,
25
2000), however, there are contradictory reports as well (Hofgartner et al., 1997; Khorsi et al., 1997; Squadrito et al., 1997). Whether, the presence wild type ISDR sequence is the basis of interferon sensitivity should studied further.
The analysis of genotype and its effects on response to IFN are limited to genotypes 1a, 1b, 2, 3a, 4. Whether other genotypes such as 5 or 6 or subtypes confer resistance to IFN remains to be elucidated.
1.8.4 Disease Progression
The relation between genotype of HCV and progression of liver diseases has been subject to investigation. Most of the studies have the form of cross-sectional studies in which the frequency of infection due to different genotypes are in comparison with different stages or outcomes of the disease, such as cirrhosis and HCC.
Several studies indicated the association with certain genotypes and different histopathological manifestations. Several studies showed that subtype 1b infections proceed much faster to severe forms of chronic hepatitis, cirrhosis (Booth et al., 1995; Kasahara et al., 1995; Watson et al., 1996), and hepatocellular carcinoma (Bruno et al., 1997; Silini et al., 1996; Zein et al., 1996). However, there are also reports failed to show the association between subtype 1b infections and faster progression into cirrhosis (Dusheiko et al., 1994; Mita et al., 1994) or HCC (Lee et al., 1996; Yotsuyanagi et al., 1995)
26
To date, type 1 and type 2 infections have been examined to identify the possible effect of genotypes on disease progression. Although in subtype 1a and type 2 infections there have been observed cirrhosis and HCC, both cases have been associated with less severe states of disease compared with subtype 1b infections. In Middle East and Europe, type 4 infections are associated with high frequencies of cirrhosis and HCC. However, in Central Africa it has a benign course of disease. Unfortunately, there are no studies characterizing infections of other subtypes or types.
1.8.5 Vaccine Development
There is no vaccine available for hepatitis C virus. Development of a suitable HCV vaccine has been impaired by the ability of HCV to establish persistent infection in the presence of an immune response, and by the heterogeneous nature of HCV with 6 main genotypes and 70 subtypes. It has been suggested that the sequence heterogeneity may lead to differences in antigenic properties of epitopes of the HCV. It was shown that antibodies to type 1 derived NS4 and NS3 proteins do not recognize the non-type 1 derived NS4 and NS3 proteins.
Presence of genotype-specific antibodies pointed out the importance of development of a multivalent HCV vaccine. Therefore, to improve the vaccine potency for the different regions of the world with different genotype prevalence rates, there should be immunogens from each major genotypes or cross-reactive HCV epitopes. The
27
future of the battle to protect new cases of infection HCV will depend on knowledge of subtypes of HCV in different countries, regions and risk group under study. With high prevalence rate and worse clinical spectrum subtype 1b is one of major consideration.
1.9 Genotyping Methods
Several genotyping methods have been developed to genotype HCV rapidly and specifically. The important point in the development of the method is the target genomic region to be analyzed. It should represent the diversity of entire genome. The region should be variable enough to distinguish between types and subtypes, but also it should be conserved enough to develop sensitive and specific primers or probes. For genotyping studies, 5' UTR, E1, core and NS5B regions have been used and methodologies include type-specific PCR, RFLP, InnoLipa probe assay, direct sequencing and subsequent phylogenetic analysis of subgenomic regions. The concordance in HCV genotype assignment among these approaches has been questioned. In a previous study, 6 different genotyping methods were compared and overall concordance have been found as 93%. Therefore, the choice of method depends on the aim and nature of the study, advantages and disadvantages of methods, size of the sample population and cost-effectiveness.
1.9.1 Type-Specific PCR
28
1a, 1b, 2a and 2b in which a part of core region was amplified with a universal set of primers, followed by a nested amplification with subtype-specific primers (Okamoto et al., 1992b). The amplified PCR products with different lengths were analyzed by agarose gel electrophoresis. The genotypes are deduced from the length of fragments. New variations of this method from both this region and NS5B region have been developed to increase genotyping of more types or subtypes (Chayama et al., 1993; Ohno et al., 1997; Okamoto et al., 1993).
1.9.2 Restriction Fragment Length Polymorphism
RFLP analysis of HCV genome for genotyping was initially reported by Nokao and his co-workers (Nakao et al., 1991). Subtype or type-specific restriction enzyme recognition sites present in amplified PCR products are utilized to cut PCR fragments with different restriction endonucleases. Electrophoresis profiles of these are used to identify the genotype of the sequence. In the RFLP analysis, 5’UTR or NS5B region has been used widely with variations.
1.9.3 Reverse Hybridization Techniques
1.9.3.1 The Line Probe Assay (LIPA)
The line probe assay (INNOLIPA HCV II, Innogenetics, Zwijndrecht, Belgium) is a reverse hybridization assay and utilizes the variations found in the 5’UTR of the
29
different HCV genotypes. In this technique, probes of 16 nucleotides are attached to nitrocellulose membrane with a poly(T) tail added by terminal deoxynucleotidyl transferase. Biotin labeled PCR products obtained from 5’UTR are then reversely hybridized to probes on the strip, allowing identification of genotype, 1a, 1b, 2a-2c, 3a-3c, 4a-4h, 5a and 6a.
1.9.3.2 DNA Enzyme Immunoassay (DEIA)
The principle of DEIA is same with the InnoLipa Assay; however, it is based on the genotype-specific probes deduced from core region. The DEIA Kit (GEN-ETI-K DEIA Kit; Sorin, Soluggia, Italy) allows the identification of subtype 1a, 1b, 2a, 2b, 2c, 3a, 4, and 5. Overall agreement between LIPA-I and DEIA is 87.5%.
1.9.4 Direct Sequencing
In theory, the most accurate method for HCV genotyping is the sequencing of whole genome and phylogenetic tree construction. However, in practice this method is not appropriate and feasible in genotyping large numbers of samples as full-length genome sequencing is too laborious and expensive. Hence, subgenomic regions representative of whole genome have been investigated. To this date, phylogenetic analysis E1, NS5B, and 5’UTR sequences correlated with whole genome based phylogenetic analysis suggesting the equivalence of sequence relationships between HCV genotypes in different regions of genome. This finding formed the basis of the
30
proposal by Simmonds et al. that a new HCV genotype should be assigned only if phylogenetic analysis of at least two genomic regions showed a distinct phylogenetic branch (Simmonds et al., 1994). 5’UTR region is the most conserved region of HCV genome. Therefore, it may have identical sequence in different subtypes but contains variations aiding determination of 6 genotypes and some subtypes.
Amplification of NS5B, core, E1 regions, followed by sequence comparison and phylogenetic tree construction for confirmation, is currently considered “gold-standard” for the assignment of HCV genotypes. However, there are limitations of this method. Amplification of some genomic regions may not be efficient. In this case, use of different sets of primers would be needed, which may lead to the selection of certain genotypes or quasispecies. In a large-scale genotyping study, mixed infections would not be identified. In these studies, the cost of the study and labor-intensive nature of this technique also puts boundaries to its usage.
31
1.10 AIM OF THE STUDY
Due to heterogeneous nature, there exist 6 main genotypes and around 70 subtypes of HCV. The prevalences of genotypes and subtypes differ between many countries or within countries as well. The determination of genotype distribution is important for molecular epidemiology studies to understand origin and pattern of spread of HCV throughout the population. The clinical importance of genotyping is due to effect of genotypes in diagnosis, disease progression and treatment. Therefore, determination of genotypes in selected population would be helpful to design the prevention policy for hepatitis infection accordingly. Up to this date, there is only one reported genotyping study in Turkey (Abacýoglu et al., 1995) and it showed that the predominant genotype is subtype 1b. An initial study conducted in our laboratory by sequencing and phylogenetic analysis of part of 5UTR region also indicated subtype 1b as the predominant genotype (Yýldýz et al., unpublished data). The high prevalence rate of HCV-1b infection and limitations of these techniques created the need of confirmation the previous results. In this study, we determined the genotypes of infected patients in Turkey.
The aim of this study was to confirm HCV genotyping through the analysis of a part of NS5B region of HCV. In addition, we aimed to finish whole genome sequencing of a Turkish HCV-1b isolate, as the predominant genotype of Turkish patient.
32
2. MATERIALS AND METHODS
2.1 MATERIALS
2.1.1 Chemicals and Enzymes
All enzymes or reagents were purchased from the sources below:
Material Manufacturer
Taq Polymerase MBI Fermentas
dNTPs MBI Fermentas
100bp DNA Marker MBI Fermentas
Gene ruler DNA Ladder MBI Fermentas
Nucleotide Removal Kit Qiagen
Revert Aid First Strand
cDNA Synthesis Kit MBI Fermentas
Viral RNA Isolation Kit Qiagen
33
2.1.2 Equipments
The list of equipments used and their manufacturers are given below:
Equipment Manufacturer Automatic Pipettes P10 Gilson P20 Eppendorf P200 Eppendorf P1000 Eppendorf
GeneAmp PCR System 9600 and 2400 Perkin Elmer
Gel Tanks
Horizontal Minicell E-C Apparatus Horizontal Midicell E-C Apparatus
pH Meter E-C Apparatus
Spectrophotometer DU 640 Beckman
Power Supply PAC 300 BioRad
UV Transilluminator BioRad Gel Doc 2000
34
2.1.3 Plastic Disposables
The list of plastic disposables used and their manufacturers are listed below:
Disposables Manufacturer
Microcentrifuge Tubes Costar
0.2 µl 1.5 µl 2.0 µl
Test Tubes Costar
15 ml 50 ml
Micropipette Tips Costar
Micropipette Filter Tips Greiner
2.1.4 Solutions
2.1.4.1 Solutions for Agarose Gel Electrophoresis
EDTA 0.5 M (stock solution), pH 8.0
35
1X gel Loading Buffer 0.25% bromophenol blue, 0.25% xylene
cyanol, 50% glycerol, 1mM EDTA
EtBr 10 mg/ml in water (stock solution)
30 ng/ml (working solution)
2.1.4.2 Solutions for RNA Extraction
Guanidium Thiocyanate 4M, prepared with RNase free ddH2O and
stored at 4°C
N-Laurylsarosine 0.5%, prepared with RNase free ddH2O
and stored at 4°C
Sodium Acetate 25 mM (pH 7.0), prepared with RNase free
36
2.2 METHODS
2.2.1 Patients
Sera from 150 Turkish anti HCV positive patients from the Gastroenterology Department of Çukurova University in Turkey was collected and stored at –70 °C until use. For ethical considerations, the samples were handled under code: i.e., we dealt with samples designated with numbers.
2.2.2 Viral RNA Extraction and cDNA Synthesis
Total RNA isolation was performed by guanidium thiocyanate method (Ausubel et al., 1987) with minor modifications.
RNA extracted from 300µl serum with freshly prepared lysis buffer, composed of guanidine-HSCN solution, mercaptoethanol and carrier RNA (1µg/ml). Recovery of RNA was provided through isopropanol precipitation. Recovered RNA was resuspended in 10µl DEPC-ddH2O and incubated at 95°C for 3 minutes to denature the
secondary structure. Extracted RNAs are either stored at -70°C or used in cDNA synthesis.
First strand cDNA was synthesized by First Strand cDNA Synthesis Kit (MBI Fermentas, Catalogue # K1612). cDNA synthesis was performed on 11µl resuspended
37
RNA in a 20 µl reaction volume by using 0.2 µg of random primer, 40 unit of M-MuLV Reverse Transcriptase, 20 unit of Ribonuclease Inhibitor and 1mM (each) deoxyribonucleotide at 37°C for 1 hr.
2.2.3 Oligonucleotide Synthesis
A single primer pair (Enomoto et al., 1990) was used to amplify NS5B region of HCV isolates from different patients. Sequences of the primers are given in Table 2.1. In the NS5B reverse primer, there is T›A transversion at the 9th nucleotide.
Oligonucleotides, used in PCR and in sequencing, were either synthesized in our department using Oligo 1000M DNA Synthesizer (Beckman) or obtained from IONTEK (Bursa, Turkey). The concentrations of the oligonucleotides were determined by using oligodeoxynucleotide quantification option of the spectrophotometer.
Table 2.1: PCR and Sequencing Primers
Primer Position of Sequence (5'›3') 5' base*
NS5B Forward 7904 TGGGGATCCCGTATGATACCCGCTGCTTTGA NS5B Reverse 8304 GGCGGAATACCTGGTCATAGCCTCCGTGAA
38
2.2.4 Polymerase Chain Reaction
NS5B region of the HCV genome was used for genotyping of HCV isolates from Turkey. To amplify DNA fragments from NS5B region single primer pair (Enomoto et al., 1990), thought to be highly conserved amongst different variants of HCV was used.
Due to low viral titer of HCV, two-step PCR with the same primer was established. By two step PCR, a 400 bp DNA fragment covering region 7904 to 8304 (Position of 5` base relative to HCV genomic sequence in Choo et al., 1991) was amplified with Thermus aquaticus Polymerase (MBI Fermentas, Catalogue # EPO401). To avoid risk of contamination, different places of the laboratory were assigned as pre and post PCR areas for each step of the two step PCR. Each area contained different reagents, disposables and equipment.
For optimization studies, an NS5B DNA fragment, cloned from a Turkish HCV 1b isolate (by Aslý Öztan in our department) was used. Several concentrations of DNA template (NS5B clone), dNTPs, primer and MgCl2 were tested. Optimized PCR
39
Table 2.2: Optimized PCR Conditions
Fragment 1st PCR Mix 2nd PCR Mix PCR
NS5B ¼ of total cDNA 4/50 of the PCR 94 °C 4’
50 pmol/µl primer product 94 °C 40” 1X Taq Polymerase Buffer 50 pmol/µl primer 58 °C 40” 60µM dNTP 1X Taq Polymerase Buffer 72 °C 40” 2.5 units of Taq Polymerase 60µM dNTP 72 °C 10’
2.5 units of Taq Polymerase
* Each PCR step was performed as 30 cycles.
2.2.5 Agarose Gel Electrophoresis of DNA Fragments
DNA fragments were separated by gel electrophoresis using agarose at concentrations of 1.7% w/v in 1x TAE (Maniatis et al., 1982). 0.2-0.4 µg EtBr per ml of the gel was used to visualize the DNA. DNA samples were loaded into the wells with 1X loading buffer. Electrophoresis was performed by running the gel for 1 hour at 100 V. PCR products were visualized by UV illuminometer at 302 nm and the gels were photographed by Sony Video Graphic Printer UP-890 CE. The length of DNA fragments was determined by comparison of NS5B fragments with molecular weight standards, that had been loaded and run on the same agarose gel. DNA weight markers used in this study were PhiX174/HinfI marker (MBI Fermentas, Catalogue # SMO0261) and 100bp DNA ladder (MBI Fermentas, Catalogue # SMO242).
40
2.2.6 Automated DNA Sequencing
The amplified DNA fragments were processed with Nucleotide Removal Kit (Quiagen, Catalogue # 28304) to remove excess dNTPs, MgCl2, etc. After purification
concentrations of the PCR products was determined by comparison with known weight standards through utilizing agarose gel electrophoresis. The PCR products having 20-100 ng/µl concentrations were sequenced with the same primer pair (Table 2.1) by ABI Prism 377 DNA Sequencer at Molecular Biology and Genetics Department in Bilkent University by Tülay Arayýcý. For sequencing reactions, Big DyeTM Terminator Cycle
Sequencing Ready Reaction Kit (ABI Prism, Catalogue # 4303152) was used. Cycle sequencing employs a thermostable DNA polymerase and dideoxynucleotides are used in a polymerization reaction to create a nested set of DNA fragments with dideoxynucleotides at the 3' terminus of each fragment. As each of the four dideoxies labeled with a different color fluorescent dye, the reaction can be performed in single tube and the sequence can be determined easily. Electropherograms of each sample were analyzed and ambiguities in the sequence data are solved by comparison of the results of both forward and reverse primers as well as by comparison with the HCV sequences in the NCBI database. Genotypes of each sample were determined after sequence analysis.
41
2.2.7 Analysis of DNA Sequences and Genotype Determination
Multalin program (http://npsa-pbil.ibcp.fr) was used to perform the multiple sequence alignment of all available NS5B sequences at NCBI Taxonomy database (http://www.ncbi.nlm.nih.gov/Taxonomy/taxonomyhome.html) to reveal the subtype-specific consensus sequences of 1a, 1b, 1c, 2a, 2b, 2c, 3a, 4a, 4d, 4f, 4h, 5a, 6a (given in Appendix B). Consensus sequence represents an average sequence for each HCV group. The obtained NS5B sequences were aligned with subtype-specific consensus sequences by Clustal W program (http://workbench.sdsc.edu). The alignment of the sequences was used to construct the phylogenetic tree to determine the genotypes of the samples. Phylogenetic tree was inferred by using Drawtree program. The tree can be viewed under the account with “hcv” username and “hcv” password (http://workbench.sdsc.edu). Genotype of the sample is determined as the genotype of consensus sequence, if they are present under same phylogenetic branch.
2.2.8 Characterization of HCV-1b Isolate from Turkey
Full length HCV isolate from a female, 59 years old, Turkish patient was amplified in 7 overlapping PCR fragments (Figure 2.1) and cloned into pGem-T Easy Vector System (Aslý Öztan, M.S. Thesis, MBG, Bilkent). The automated DNA sequencing of the inserts were performed with sequencing primers by ABI Prism 310 Sequencer.
42
The obtained nucleic acid sequence was translated into protein sequence by Translator program (http://www.expasy.ch/tools/dna.html). Inferred amino acid sequence of Turkish HCV-1b isolate were aligned with protein sequences of other HCV isolates in NCBI database (http//:www.ncbi.nlm.nih.gov) by Clustal W program to identify the differences in amino acid sequences, that may be specific to the Turkish isolate. Alignment is present at the same URL mentioned above. At each position, we compared the amino acid sequences and we defined an amino acid difference if and only if none of the amino acid sequence agree with that of Turkish HCV-1b isolate.
43
44
3. RESULTS
3.1 Review of the Previous Study
In our laboratory, sequencing of 5' UTR region and subsequent phylogenetic analysis was utilized to assign the genotypes of HCV isolates obtained from 123 anti HCV positive patients living in Southern Anatolia in Turkey (Yýldýz et al., unpublished data). In 115 (93.5%) patients, HCV RNA was detected by RT-PCR of 5' UTR. In eight (6.5%) patients, HCV RNA could not be detected and this is confirmed by analysis of different aliquots of same serum samples of the patients. The clinical features of patients with positive and negative HCV RNA are present in the Table 3.1. The results of genotyping from 5' UTR showed that the predominant genotype in Turkey is subtype 1b (91.1%). Subtype 1a (6.3%), subtype 2a (1.3%) and genotype 4 (1.3%) are also present with lower prevalence (Table 3.2). The 5' UTR region is a highly conserved region, subtype 1a and subtype 1b is not efficiently discriminated from this region. Therefore, it was important to confirm the previous study by analyzing a different region of HCV in selected samples.
In this study, we analyzed the HCV isolates from the same patients by sequencing of part of the NS5B of the HCV genome after PCR amplification, as a means of validating results obtained with the 5' UTR.
45
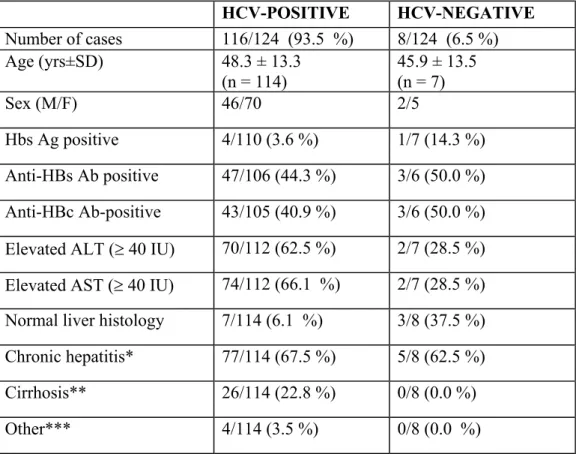
Table 3.1: Clinical features of 123 HCV antibody-positive patients with or without
HCV RNA HCV-POSITIVE HCV-NEGATIVE Number of cases 116/124 (93.5 %) 8/124 (6.5 %) Age (yrs±SD) 48.3 ± 13.3 (n = 114) 45.9 ± 13.5 (n = 7) Sex (M/F) 46/70 2/5 Hbs Ag positive 4/110 (3.6 %) 1/7 (14.3 %) Anti-HBs Ab positive 47/106 (44.3 %) 3/6 (50.0 %) Anti-HBc Ab-positive 43/105 (40.9 %) 3/6 (50.0 %) Elevated ALT (≥ 40 IU) 70/112 (62.5 %) 2/7 (28.5 %) Elevated AST (≥ 40 IU) 74/112 (66.1 %) 2/7 (28.5 %) Normal liver histology 7/114 (6.1 %) 3/8 (37.5 %) Chronic hepatitis* 77/114 (67.5 %) 5/8 (62.5 %) Cirrhosis** 26/114 (22.8 %) 0/8 (0.0 %) Other*** 4/114 (3.5 %) 0/8 (0.0 %)
*Severe chronic hepatitis (n=43), mild chronic hepatitis (n=28), chronic hepatitis (n=7), severe chronic active hepatitis (n=2), chronic active hepatitis (n=1), chronic persistant hepatitis (n=1).
**Cirrhosis (n=11), active cirrhosis (n=8), macronodular cirrhosis (n=3), macro and micronodular cirrhosis (n=3)
***Non specific reactive hepatitis (n=1), severe hepatitis (n=1), single cell necrosis (n=1), periportal steatosis (n=1).
46
Table 3.2: HCV genotypes in Turkish Patients
Genotype 1a Genotype 1b Genotype 2a Genotype 4
Number of cases 5/79 (6.3 %) 72/79 (91.1%) 1/79 (1.3 %) 1/79 (1.3 %) Age (yrs; mean ± S.D.) 49.75 ± 3.6
(n=4)
48.7 ± 13.5 (n=71)
52 39
Sex (M/F) 2/3 24/47 1/0 0/1
Elevated ALT (≥ 40 IU) 2/4 (50.0 %) 44/69 (63.8 %) 0/1 (0.0 %) 1/1 (100.0 %) Elevated AST (≥ 40 IU) 1/4
(25.0 %) 47/69 68.1 %) 1/1 (100.0 %) 1/1 (100.0 %) Normal liver histology 0/5
(0.0 %) 3/71 (4.2 %) 0/1 (0.0 %) 0/1 (0.0 %) Chronic hepatitis 3/5 (60.0 %) 48/71 (67.6 %) 1/1 (100.0 %) 1/1 (100.0 %) Cirrhosis 2/5 (40.0 %) 17/71 (23.9 %) 0/1 (0.0 %) 0/1 (0.0 %) Other 0/5 (0.0%) 3/71 (4.2 %) 0/1 (0.0 %) 0/1 (0.0 %)
3.2 Partial Amplification of NS5B Region
400 bp fragment of NS5B region of HCV isolates was amplified by two-step two step PCR with same primer pair (Table 2.1). Due to low amount of HCV template, the yield of PCR amplification was low. Therefore, two step PCR was used to increase the yield. To avoid contamination during amplification procedure, first round of PCR
47
(designated as PCR1) and second round of PCR (designated as PCR2) was performed in different areas of laboratory. The pre and post PCR areas of each step were also different and each area contained its own settings, pipettes, pipette tips, etc. To control the presence of contamination in the PCR1 two negative controls were included, ddH2O
and cDNA of the patients, in which HCV RNA could not be detected previously by Esra Yýldýz. In the PCR2, addition to two negative controls one more negative control, ddH2O was added to eliminate the risk of contamination coming from the second round
of PCR.
The amount of cDNAs was not suitable to optimize the PCR conditions it was not possible to test several dNTP, MgCl2, primer or template concentrations by using
same cDNA as a template. Therefore, optimized PCR conditions were established through utilizing the NS5B clone.
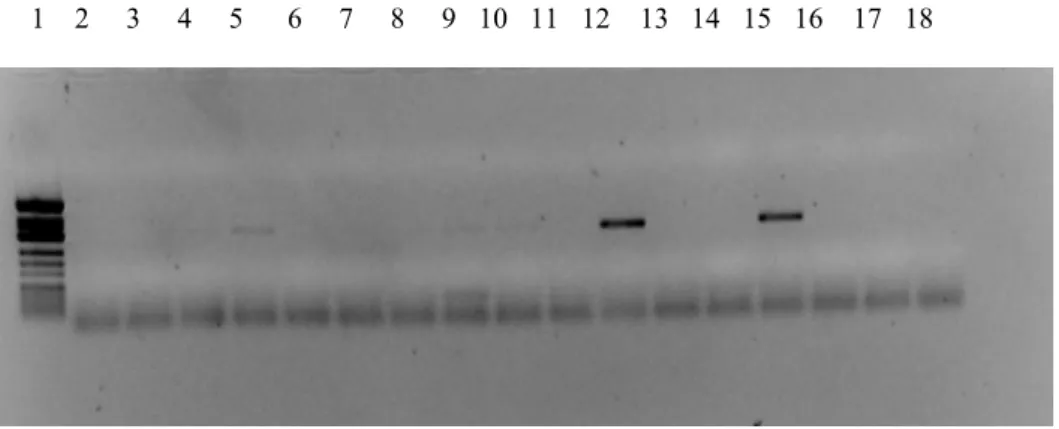
In the Figure 3.1, Figure 3.3, Figure 3.5 agarose gel electrophoresis profiles of NS5B PCR products after the first round of PCR can be seen. In the Figure 3.2, Figure 3.4, Figure 3.6 that of NS5B PCR products after the second round of PCR can be observed.
48
Figure 3.1: Agarose gel electrophoresis of PCR1 products. Lane 1: PhiX174/HinfI marker (MBI), Lane 2: Sample 8, Lane 3: Sample 8, Lane 4: Sample 24, Lane 5: Sample 40, Lane 6: Sample 67, Lane 7: Sample 20, Lane 8: Sample 76, Lane 9: Sample 80, Lane 10: Sample 85, Lane 11: Sample 94, Lane 12: Sample 114, Lane 13: Sample 126, Lane 14: NC*, Lane 15: NC* *NC: Negative control
Figure 3.2: Agarose gel electrophoresis of PCR2 products. Lane 1: PhiX174/HinfI marker (MBI), Lane 2: Sample 8, Lane 3: Sample 24, Lane 4: Sample 40, Lane 5: Sample 67 Lane 6: Sample 20, Lane 7: Sample 76, Lane 8: Sample 80, Lane 9: Sample 85, Lane 10: Sample 94, Lane 11: Sample 114, Lane 12: Sample 126, Lane 13: NC*, Lane 14: NC*
1 2 3 4 5 6 7 8 9 10 11 12 13 14 1 2 3 4 5 6 7 8 9 10 11 12 13 14 15