Full Terms & Conditions of access and use can be found at
https://www.tandfonline.com/action/journalInformation?journalCode=tsdw20
International Journal of Sustainable Development &
World Ecology
ISSN: 1350-4509 (Print) 1745-2627 (Online) Journal homepage: https://www.tandfonline.com/loi/tsdw20
Renewable energy, non-renewable energy and
sustainable development
Taner Güney
To cite this article: Taner Güney (2019) Renewable energy, non-renewable energy and
sustainable development, International Journal of Sustainable Development & World Ecology, 26:5, 389-397, DOI: 10.1080/13504509.2019.1595214
To link to this article: https://doi.org/10.1080/13504509.2019.1595214
View supplementary material
Published online: 19 Mar 2019.
Submit your article to this journal
Article views: 2267
View related articles
View Crossmark data
Renewable energy, non-renewable energy and sustainable development
Taner Güney
Department of Economics, Karamanoglu Mehmetbey University, Karaman, Turkey
ABSTRACT
The purpose of the present study is to analyse the effects of renewable energy and non-renewable energy on sustainable development. This study is pioneering in this respect because it analyses the effect of renewable energy on adjusted net savings, which is a good sustainable development variable. For this purpose, the data of 40 developed and 73 developing countries were included. According to the estimation results obtained in the study, renewable energy has a positive and statistically significant effect on sustainable development both in developed countries and in developing countries. The impact of renew-able energy on sustainrenew-able development is greater than the impact of non-renewrenew-able energy. In this respect, as the renewable energy amount increases, the level of sustainable develop-ment increases. According to these results, the fact that countries use renewable energy more than non-renewable energy sources is extremely important in terms of making progress towards sustainability of development and the 2030 Sustainable Development Goals.
ARTICLE HISTORY
Received 26 January 2019 Accepted 8 March 2019
KEYWORDS
Sustainable development; renewable energy; non-renewable energy; endogeneity; panel data analysis
Introduction
Sustainable development can be defined as maintaining the amount of the sources used by society for today’s needs at a level that will not deprive future generations of their needs. In the context of this definition, sustain-able development has three dimensions, which are eco-nomic, social and environmental. For this reason, it has become necessary to cover the ever-increasing energy need in order to achieve sustainable development; in other words, to improve the living standards of indivi-duals, to realize the production necessary for society, and to minimize the pollution of the resources used in these processes (Ozturk and Acaravci2011). Nowadays, almost all countries cover their energy needs from fossil fuels such as coal and natural gas, and as the energy consumption of countries increases, carbon emission is increasing as well (Elum and Momodu 2017). When fossil fuels are used, they leave a certain amount of residue in the form of solid substances and gases. This residue, which is caused by fossil fuels, cannot be re-used in any way; and therefore, it causes environmental pollution (Dogan and Seker2016; Apergis et al.2018). In this respect, satisfying the increasing energy need from renewable resources such geothermal, solar, wind, bio-mass and biofuels will help to keep the pollution of the sources at the lowest level for sustainable development. In other words, sustainable development requires long-term potential action, and renewable energy1sources seem to be one of the most common and effective solutions in this direction (Dincer 2000). Fortunately, technological developments mean that demand and
interest for renewable energy sources has increased due to reasons such as the increase in environmental pollution and the fast fossil fuel consumption. Topics such as energy, energy security and global warming are being discussed in many countries; and regulations are being made in this context. The most important pio-neering study in this field belongs to the United Nations (UN). By listing 17 Sustainable Development Goals (SDGs), the UN has emphasized the actions countries should take by 2030 for sustainable development. The 7th Goal concerns access to affordable, reliable, modern and sustainable energy by everyone. In this respect, the importance of renewable energy for sustainable devel-opment has been highlighted . However, contrary to the relationship between renewable energy and carbon emission, there is a gap in the literature regarding the effects on sustainable development. This study is pio-neering in this regard, because while GDP is used as a sustainable development indicator in several studies in this field, as mentioned in the literature section, in this study the adjusted net savings (Aidt2009,2010; Güney
2017) was used as well as carbon emissions . In this respect, the present study aims to analyse the effect of renewable energy on sustainable development in devel-oped and developing countries. According to the esti-mation results, renewable energy affects sustainable development in both developed and developing coun-tries in a positive way. Moreover, impact of renewable energy on sustainable development is more than the impact of non-renewable energy. In other words, as the use of renewable energy by countries increases, the
CONTACTTaner Güney [email protected]
2019, VOL. 26, NO. 5, 389–397
https://doi.org/10.1080/13504509.2019.1595214
possibility of reaching the 2030 targets which were defined by the UN is increasing as well. Therefore, this study reveals the importance of renewable energy use of developed and developing countries in terms of sustainable development.
This study is organized as follows. In the second part, the relationship between renewable energy and sus-tainable development is examined, as is the literature on the effect of renewable energy on sustainable devel-opment. The data and methods are included in the fourth section, while the estimation results are given in the fifth section. The sixth section concludes the study.
The renewable energy and 2030 sustainable development goals
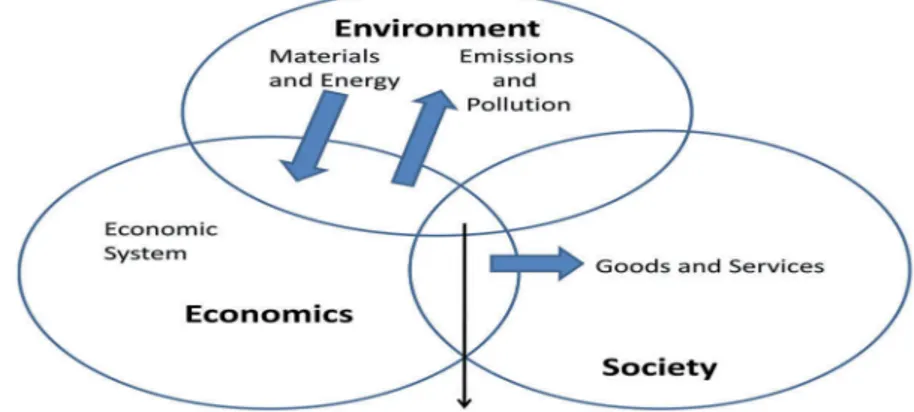
The use of renewable energy sources and sustainable development are two separate variables that are related closely with each other. As is seen inFigure 1, sustainable development is a variable that is at the crossroads of environment and, therefore, has three dimensions: environmental, social and economic vari-ables. The economy uses materials and energy in pro-duction by taking them from the environment for the purpose of producing the necessary goods and ser-vices for the society; and as a result of these activities, the environment is subject to emissions and pollutions. For this reason, as the production continues, so does the pollution of the environment. The environment that is polluted as a result of these activities must be protected from this in order for future generations to be able to use it for their own needs as well.
When the United Nations identified the Millennium Development Goals (MDGs) for sustainable develop-ment and the 2030 SDGs, it defined these objectives, and in this way, the significant relationship between the use of renewable energy source and sustainable devel-opment also emerged. One of the eight Millennium Development Goals of the United Nations is related to ensuring environmental sustainability involving the integration of the sustainable development principles with national policies and programmes and changing
the losses in environmental resources into an acquisi-tion situaacquisi-tion. The 7th Goal of the 2030 SDGs of the United Nations includes the following variables:
● Providing universal access to economic, safe and modern energy services until 2030,
● Increasing the share of renewable energy in the global energy mix at a considerable level until 2030,
● Doubling the rate of global development rate in energy efficiency until 2030,
● Developing international cooperation to facili-tate access to renewable energy including advanced and clean fossil fuel technology and energy efficiency; and promoting investments in energy infrastructure and clean energy technol-ogy until 2030,
● Expanding the infrastructure and the innovative technology to provide modern and sustainable energy services in developing countries, espe-cially in the least developed countries, in devel-oping countries that have the form of small islands, and in other developing countries that have no seas, until 2030 in accordance with their own support programs.
According to the definition of the United Nations (2016), energy use is the most dominant cause of cli-matic change and is responsible for about 60% of total global greenhouse gas emissions. For this reason, redu-cing carbon intensity is an important objective in energy use in long-term climatic targets. In the 7th SDG, this is also the reason for renewable energy being brought to the forefront. As a result of the renewable energy pre-ference of countries being more than non-renewable energy use, carbon intensity will be reduced; and in this way, the achievement rate of this target will also increase. As a result, today’s society will pollute the environment at the lowest level while covering its own needs, and will also ensure that the future society has enough resources to meet its own needs. Decisions that were taken unanimously by 195 countries that met at the UN Paris Conference (UN Framework Convention on
Figure 1.Sustainable development concept (Azapagic and Perdan2000, p. 244).
Climate Change [UNFCCC]) in2015show the progress of these efforts so far. According to the results of the conference, countries that participated in the Paris Convention should try to keep global warming below 2 degrees until the end of the century. The main goal, however, was to decrease the temperature by as low as 1.5 degrees, as requested by societies such as island states which are threatened by floods and global warming. In the convention, it was agreed to establish a mechanism that would reduce green-house gas emission and support sustainable develop-ment. In this way, mutual work would be done through voluntary cooperation between countries to determine ‘pollution’ targets. Within the 2030 SDGs objectives framework, the Paris Convention requires that developed countries provide financial support for reducing pollution in developing countries. The amount of this aid was declared as 19 billion dollars. In addition, the parties to the Convention prepared a climate financing budget until 2025. Based on all these data, it is understood that all countries involved in the Convention consider the transition to renew-able energy as a‘savior’ with the least damage to the environment and for the sustainability of develop-ment target; and will provide incentives for the transi-tion to renewable energy and not hesitate to take compulsive measures for this transition.
Related literature
There is an extremely wide-ranging literature on the relationship between renewable energy and carbon emission. For detailed literature data, the studies con-ducted by Apergis et al. (2018), Dogan and Seker (2016), and Liu (2017)2 should be referred to. Although some studies have reported just the opposite (Dogan and Seker
2016), most of the studies suggest that renewable energy reduces carbon emissions. On the other hand, the litera-ture on the effect of renewable energy on sustainable development is extremely insufficient because mostly the growth3rate and similar variables are used as the sustain-able development varisustain-ables in the studies that investi-gate the relationship between renewable energy and sustainable development. For example, Ozturk and Acaravcı (2011), Tugcu et al. (2012), Soytaş and Sari (2003), Ocal et al. (2013), Sinha (2015), Apergis and Danuletiu (2014), Apergis and Payne (2010) Bozkurt and Destek (2015) and Bilgili et al. (2017) are among the studies that have these features. These studies have shown that renewable energy has a positive effect on growth rate, or that there might be a‘mutual causality’ relation between these two variables.
Data and method
The description of the data used in the study and the empirical method are explained in this section of the
study. While the first sub-section describes the data that were used, the second section contains the model specification.
Data
The following model is used to predict the effect of renewable energy on sustainable development in all countries,4 40 developed and 73 developing coun-tries, which is the main purpose of the present study. As is evident from the model, this study focuses merely on the effects of using renewable and non-renewable resources. For this reason, no other inde-pendent variables were included in the models.
Ansit¼β1Renergyitþβ2Energyitþεit (1)
in equation (1), Ansit refers to the annual sustainable
development level; Renergy refers to the rate of the renewable energy consumption to the GNP. The rate of electricity production performed with renewable energy sources such as geothermal, solar, wind, biomass and biofuels to the total electricity production is used as the variable to show the renewable energy indicator. Energy refers to the fossil fuel energy consumption (% of total). It covers coal, crude oil and natural gas. The data on the variables covering the 1990–2014 period were taken from the World Bank (WB).
Aidt (2009), Aidt (2010), Güney (2017) and Spaiser et al. (2018) used the adjusted net savings as an indica-tor of sustainable development. Therefore, in this study, the adjusted net savings5(% of GNP) variable is used as the sustainable development variable. However, as mentioned earlier, GDP was used as the sustainable development indicator in previous studies that dealt with the relationship between renewable energy and sustainable development. This is also the case for stu-dies conducted on development. Many of the empirical studies conducted in this field use real GDP per capita to measure development. However, researchers believe that development is associated with sustainable devel-opment in human welfare. For this reason, it is widely accepted that per capita GDP is not a good criterion for sustainable development in human welfare, because GDP per capita emerges as a flow variable. In other words, GDP records the value of the goods and services produced by the economy in a certain year over market prices. By using the capital stocks such as non-renewable resource reserves or human capital, stock may be used for a certain period by an economy to increase this flow, or in other words, the GDP. However, because of the decrease of capital stocks as a result of use, the result will be decreased GDP for the future. Therefore, it is probable that the increase in GDP growth rates (or the GDP growth rate per capita) within a certain time period might correspond to a decline in the future level of social welfare when the conse-quences for future generations are considered (Aidt
2010). Therefore, adjusted net saving6is a better sustain-able development indicator when compared to GDP. National gross saving is obtained by subtracting the Depreciation (Dep) share of the produced capital from the Ans Gross Saving (Gs). In National Net Saving (Gs-Dep), after the expenses of the public authority made for education (E) are added by subtracting the reduction (R) in the income obtained from the natural capital as a result of using the natural capital and the Carbon Dioxide emission (CD), the Adjusted Net Saving, i.e. the Ans, will be obtained (Ans = Gs-Dep+E-R-Cd).
As is evident from the studies conducted by Hamilton and Clemens (1999), Bolt et al. (2002), Arrow et al. (2004) and Hamilton (2005), adjusted net savings are obtained from the gross national savings by making four adjustments reflecting the counterpart of an invest-ment on the productive base of the economy or reflect-ing the return on investment. The first correction is a deduction of an estimate of the fixed capital consump-tion to enable the accounting of the amortisement of the capital generated. This refers to the substitution value of the capital that is consumed by the production process. The second correction is associated with esti-mating the investments added to human capital and adding this estimation to human capital. Public expenses on education are used as a proxy for this. The third correction concerns the social cost of environ-mental pollution; and consists of two subsequent parts. The first is designed to measure the cost of global warming. Here, presuming that the mean social cost of one ton of carbon is US$30, estimations of the social cost of carbon dioxide emissions are made and deducted from national savings. The second part is designed to compute the effects of local environmental disruption. The WB estimates the health losses stem-ming from urban air pollution (particulate emissions) and deduces these from national savings. The fourth correction of the adjusted net saving reflects the invest-ment return or the investinvest-ment in the productive base of the economy which is associated with the environmen-tal variables. In this respect, the energy sources, minerals and net forest remainders that are consumed due to production are deduced from the net national savings. In this process, the rents of the sources that are relevant are estimated and deduced. For this reason, the envir-onmental and social harms of carbon emission are also included in the corrected net savings.
Method
In the present study, in addition to the OLS method, System-GMM and IV (2SLS) methods were preferred. These methods were used in order to eliminate the biases related to the correlation between the delayed depen-dent variable and the error term, to exclude individual effects and to prevent the endogeneity between
renewable energy and the sustainable development vari-able. In dynamic panel data models, adding the delayed state of the dependent variable as an explanatory variable might cause the prediction made by correlating it with the delayed variable error term to be inconsistent. To overcome this problem, using the‘instrumental variable’ is recommended instead of the ‘delayed variable’ (Blundell and Bond1998; Tatoğlu2012). Anderson and Hsiao (1981), Arellano and Bond (1991) and Arellano and Bover (1995) developed methods to solve such problems. However, these methods remain weak if the autoregres-sive parameters are too many or the rate of unit effect variance to the residual error variance is very high, and still remain weak in unstable panel data or when the relative T is small. In unbalanced panels, when the first difference of the variables is taken, the data that belong to some units may be completely lost. To solve this problem, Arellano and Bover (1995) used the advanced orthogonal deviations method instead of the first difference, which reduces the data loss to a minimum level. On the other hand, it was proved that in case N > T, the System-GMM Method, which was developed by Blundell and Bond (1998) – and which shows the importance of extra moment condition used to obtain the effective estimator of the dynamic panel data model– was better than the method that was developed Anderson and Hsiao (1981), Arellano and Bond (1991) and Arellano and Bover (1995). In the method developed by Roodman (2006), more test results are obtained and consistent estimators can be obtained even in the case of heteroscedasticity and auto-correlation. This method is more flexible than Blundell and Bond (1998) in terms of the specification of the delay structure, a the endogeneity of the variables can be modelled.
In this study, the instrumental variable IV(2SLS) method was used to prevent endogeneity between renewable energy and the sustainable development variable. The appropriate instrumental variable used in the literature (Mauro1995; La Porta et al.1998; Hall and Jones1999; Gupta et al.2002; Aidt2010; Güney 2017) was latitude, ethno-linguistic fractionalisation (ELF), common law and corruption of the previous period (initial ICRG index). The latitude variable indicates the distance from the equator. Data were obtained from La Porta et al. (1999). Initial ICRG index data indicating the corruption of the previous period were taken from Political Risk Services (PRS). The ELF variable is com-posed of ethnicity, language and religion variables and the variables data were provided by Alesina et al. (2003). Table 1 shows the descriptive statistics of the variables.
Estimation results
Table 2 shows the effect of using renewable energy sources on sustainable development in all countries, while Table 3 shows the prediction results for
developed countries, and Table 4 shows the predic-tion results for developing countries. In the first col-umn in the tables, present pooled OLS estimates for the effect of renewable energy and non-renewable energy on the Ans are given. The second column in the tables presents the IV (2SLS) estimates for the relevant variables, while in the third column of the tables, System-GMM estimates of the related variables are presented.
According to Table 2, the Pooled OLS estimates demonstrate that renewable and non-renewable energy has a positive and statistically significant effect on Ans. The positive effect of renewable energy is greater than the impact of non-renewable energy. However, in the second column, the results of the Hausman test indi-cate that renewable energy is an endogen variable. Therefore, the initial ICRG index and language variables were used to prevent this endogeneity. The Anderson canonical LM test was used to determine whether the two variables were correlated with the endogen variable. The statistical significance of the Anderson canonical
correlation LM test indicates that the initial ICRG index and language variables are associated with renewable energy. The Sargan test was used to test the validity of these tool variables. The statistical significance of the Sargan test indicates that valid instrumental variables were used. The power of these instrumental variables is determined by the Cragg-Donald F7statistic. According to both this and Stock and Yogo (2005), the instrumental variables used are larger than the maximum IV size of 10% and hence ‘very powerful’ instrumental variables. Therefore, the estimates of IV (2SLS) with valid instrumen-tal variables have a positive and statistically significant effect on the Ans of renewable and non-renewable energy. The impact of renewable energy on the sustain-able development varisustain-able is much more than the effect of non-renewable energy. Similar results are seen in System-GMM estimates. Again, renewable energy in the System-GMM estimates has a significant impact on the sustainable development variable rather than non-renewable energy. In the System-GMM estimate, the Wald test shows that the model is entirely significant. While the statistical insignificance of the Hansen J test indicates that valid instrumental variables are used, the statistical significance of the difference-in-Hansen test indicates that the instrumental variables used in the regression are sufficient. AR(1) and AR(2) tests were used to detect the presence of 1st and 2nd level autocorrela-tion in the model. According to AR(1) estimaautocorrela-tion, since AR (1) is statistically significant, there is autocorrelation in the 1st degree, but since AR(2) is statistically insignificant, there was no autocorrelation at the 2nd level. According
Table 1.Descriptive statistics of the variables.
Variable Obs. Mean Std. Dev. Min . Max.
All Countries Ans 2918 0.066 0.156 −1.835 0.957 Renergy 3413 0.008 0.028 0.000 0.497 Energy 2796 0.577 0.335 0.000 1.00 Developed Countries Ans 904 0.101 0.080 −0.267 0.416 Renergy 975 0.014 0.035 0.000 0.431 Energy 1024 0.559 0.329 0.000 1.00 Developing Countries Ans 2020 0.064 0.199 −1.835 0.957 Renergy 2311 0.006 0.025 0.000 0.497 Energy 1837 0.552 0.355 0.000 1.00
Table 2.Estimates: All Countries.
Pooled OLS IV(2SLS) System-GMM
Ansit-1 0.815512* 0.002237 Renergy 0.118983*** 0.063648 8.787654* 1.245984 0.290018* 0.038914 Energy 0.072031* 0.005786 0.121590* 0.018457 0.106118* 0.002709 Wald 1.14e+06 (0.0000) AR(1) −2.20 (0.027) AR(2) 0.98 (0.329) Hansen J-test 111.71 (0.999)
Diff-in- Hansen test 1.74
(0.419) Anderson canon. LM 65.404 (0.0000) Sargan 0.060 (0.8057) Cragg-Donald Wald F 33.778a Hausman (Endogeneity) 161.170 (0.0000) N 2375 1871 2254
For OLS estimation, heteroscedasticity and correlation problems were corrected. Italic values are standard error estimations; values in brackets are p- estimations; all estimations have a year and country dummy. a Stock, Yogo (2005) weak identification test critical values for 10%, 15%, 20%, and 25% are 19.93, 11.59, 8.75, and 7.25 respectively. IV(2SLS) instrumental variables: initial ICRG index and language. * p < 0.001, ** p < 0.01, *** p < 0.5
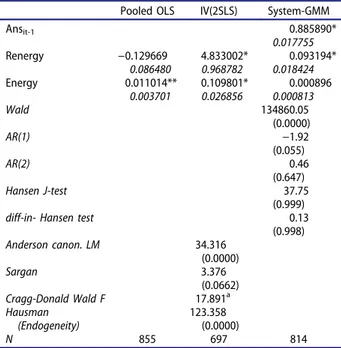
Table 3.Estimates: Developed Countries.
Pooled OLS IV(2SLS) System-GMM
Ansit-1 0.885890* 0.017755 Renergy −0.129669 0.086480 4.833002* 0.968782 0.093194* 0.018424 Energy 0.011014** 0.003701 0.109801* 0.026856 0.000896 0.000813 Wald 134860.05 (0.0000) AR(1) −1.92 (0.055) AR(2) 0.46 (0.647) Hansen J-test 37.75 (0.999)
diff-in- Hansen test 0.13
(0.998) Anderson canon. LM 34.316 (0.0000) Sargan 3.376 (0.0662) Cragg-Donald Wald F 17.891a Hausman (Endogeneity) 123.358 (0.0000) N 855 697 814
For OLS estimation, heteroscedasticity and correlation problems were corrected. Italic values are standard error estimations; values in brack-ets are p- estimations; all estimations have a year and country dummy. a
Stock and Yogo (2005) weak identification test critical values for 10%, 15%, 20%, and 25% are: 19.93, 11.59, 8.75, and 7.25 respectively. IV (2SLS) instrumental variables: initial ICRG index and religion. * p < 0.001, ** p < 0.01, *** p < 0.5
to the results of these three estimators, as the use of renewable energy sources increases, the level of sustain-able development, which is measured by the adjusted net saving indicator, also increases.
According to Table 3, which includes estimates for developed countries, the Hausman test shows that renewable energy is an endogen variable. The Anderson canonical LM test indicates that renewable energy is associated with the initial ICRG index and religion is used as the instrumental variable. The Sargan test indicates that these variables are valid (5% statistical significance level). The Cragg-Donald F test, according to Stok and Yogo (2005), indicates that the instrumental variables used are ‘strong’ instrumental variables because they are valued at the maximum IV size of between 10% and 15%. In System-GMM estima-tion, the Wald test demonstrates that the model is entirely significant. The Hansen J test shows that the valid instrumental variables are used, while the differ-ence-in-Hansen test shows that the instrumental vari-ables used in the regression are sufficient. According to AR(1) estimation, there is autocorrelation in the 1st degree (for at 10% statistical significance), but there was no autocorrelation at the 2nd level. In Table 3, Pooled OLS estimation indicates that, renewable energy, in developed countries, has an effect that does not have statistical significance on Ans. However, non-renewable energy has a positive and statistically significant effect on Ans. The reason of these estimation results is the
endogeneity problem of energy variables. As described above, the Hausman test also found that energy vari-ables are endogen. On the other hand, IV (2SLS) and System-GMM estimates for developed countries show that renewable energy and non-renewable energy have a positive effect on Ans. This positive effect of renewable energy is much greater than the effect of non-renewable energy on Ans. However, the positive direc-tional effect on non-renewable Ans is not statistically significant according to the System-GMM estimate. Therefore, prioritization of renewable energy by devel-oped countries will increase the level of sustainable development further.
A similar result applies to developing countries. According to the estimates in Table 4, the Hausman test shows that renewable energy is an endogen vari-able. The Anderson canonical LM test indicates that the renewable energy variable is associated with the lan-guage and latitude used as the instrumental variable, while the Sargan test indicates that these variables are valid variables. The Cragg-Donald F test and Stock and Yogo (2005) demonstrate that the instrumental vari-ables are ‘very powerful’ because they have a value greater than 10% with a maximum IV size. For System-GMM estimation, the Wald test shows that the model is entirely significant, while the Hansen J test reveals that the valid instrumental variables are used, and the differ-ence-in-Hansen test demonstrates that the instrumental variables used in the regression are sufficient. According to AR(1) estimation, there is autocorrelation in the 1st degree (for a 10% statistical significance), but there was no autocorrelation at the 2nd level.
According to the predictions obtained for devel-oping countries inTable 4, all of the estimates across the two columns show that renewable energy has a positive and statistically significant effect on Ans. Although the effect of non-renewable energy on Ans is positive and statistically significant in developing countries, this effect is quite low foron all estimates compared to renewable energy. Therefore, as in developed countries, renewable energy in develop-ing countries is a more important source of energy in terms of sustainable development. These results indi-cate that the use of renewable energy sources has a positive effect on sustainable development in developed countries, and in the developing coun-tries included in the analysis. For this reason, it can be concluded that when developed and developing countries use renewable resources for energy pro-duction, sustainable development levels increase. Based on these results, the use of renewable energy sources was found to have a positive effect on sus-tainable development in developed countries and in developing countries that were included in the ana-lysis. For this reason, it was concluded that when
Table 4.Estimates: Developing Countries.
Pooled OLS IV(2SLS) System-GMM
Ansit-1 0.683457* 0.002363 Renergy 0.175125*** 0.079666 4.955099* 1.019383 0.398130* 0.037352 Energy 0.100329* 0.008050 0.108474* 0.018071 0.205057* 0.006135 Wald 277612.20 (0.0000) AR(1) −1.92 (0.055) AR(2) 0.67 (0.503) Hansen J-test 67.81 (0.999)
diff-in- Hansen test −2.68
(0.999) Anderson canon. LM 53.818 (0.0000) Sargan 1.407 (0.2356) Cragg-Donald Wald F 27.842a Hausman (Endogeneity) 45.952 (0.0000) N 1521 1433 1419
For OLS estimation, heteroscedasticity and correlation problems were corrected. Italic values are standard error estimations; values in brack-ets are p- estimations; all estimations have a year and country dummy. aStock and Yogo (2005) weak identification test critical values for 10%, 15%, 20%, and 25% are: 19.93, 11.59, 8.75, and 7.25 respectively. IV (2SLS) instrumental variables: language and latitude. * p < 0.001, ** p < 0.01, *** p < 0.5
developed and developing countries use renewable resources for energy production, the sustainable development levels increase.
Estimation results showed that renewable energy sources should be preferred instead of fossil energy use, which is the most dominant cause of climate change and accounts for about 60% (UN2016) of total global green-house gas emissions. Achieving universal access to eco-nomic, safe and modern energy services by 2030 is crucial for sustainable development, as set out in the 7th Goal of the 2030 SDGs. For this reason, especially in developing countries, renewable energy projects should be sup-ported to increase renewable energy production by 2030, and legislative and tax regulations that facilitate renewable energy investments and make these invest-ments cheaper are required. Investinvest-ments in energy infra-structure and clean energy technology should be prioritized by the state in developed and developing countries. Defining an objective item in the public budget can be very useful. However, research and projects to increase energy efficiency should be supported. But, there may be a difference between countries in terms of energy efficiency. In order to increase energy efficiency, it seems necessary to create an international structure that will enable the countries to share their technology, knowl-edge, and experiences among themselves. Thus, renew-able energy will be higher than non-renewrenew-able energy use, carbon intensity will decrease and success rate of the 7th Goal of the 2030 SDGs will increase.
Conclusions
The purpose of the present study was to analyse the effect of using the energy obtained from renewable and non-renewable sources on carbon emission and on sustainable development. The United Nations, which emphasizes the importance of the sustainable development, has set the 2030 SDGs for this purpose. One of the essential elements of these goals is that the importance given to renewable energy sources was revealed. One of the goals, of which there are eight in total, involves the transformation of the loss of environmental resources into a winning situation to ensure environmental sustainability. Using renewable resources more in energy production will also reduce the loss of resources. One of the seventeen 2030 SDGs shows how important renewable energy sources are in terms of sustainable development in a clear man-ner. According to the 7th SDG, the aim is to increase the share of renewable energy in the global energy mix by 2030 at a significant level. In addition, the aim is to develop international collaboration and invest-ment in energy infrastructures and in clean energy technology for the purpose of facilitating access to clean energy research and technology, including renewable energy, energy efficiency and advanced and clean fossil fuel technology by 2030. On the
other hand, the relationship between good sustain-able development and renewsustain-able energy -except for carbon emissions- has been neglected in the litera-ture. The present study is a pioneering one in this respect because the effect of renewable energy on on adjusted net savings, which is a good sustainable development variable, has been analysed in this study. In other words, for the purpose of achieving the SDGs set by the United Nations, both developed and developing countries need to give due impor-tance to the use of renewable energy sources. According to the estimation results, which were obtained from the analyses performed for this pur-pose, renewable energy is increased, the adjusted net savings are increased. The effects of the energy obtained from renewable and non-renewable sources on sustainable development are considered, it is clear that the effect is positive for developed and develop-ing countries. In other words, renewable energy has a positive and statistically significant effect on sustain-able development both in developed countries and in developing countries. On the other hand, the positive effect of renewable energy on sustainable develop-ment is higly higher compared with non-renewable energy. Therefore, when developed and developing countries prefer renewable resources instead of non-renewable resources for energy production, the sus-tainable development levels increase further. Therefore this study, reveals the importance of renewable energy use especially in developed and developing countries in terms of sustainable opment and 2030 SDGs. In this respect, as devel-oped and developing countries use renewable energy sources, the sustainable development levels increase. For this reason, in terms of sustainable development, in order to avoid future generations being deprived of the resources they will use to meet their needs; in other words, to sustain their level of prosperity, the resources used today must be minimally polluting. Therefore, countries must increase the use of renewable energy sources as much as they can. As a result, this paper, suggests to policymakers that production and consumption of renewable resources should be considered as the first goal in order to ensure the least pollution of resources and to increase welfare.
Notes
1. Renewable energy sources include hydropower, bioe-nergy, thermal, geothermal, wind, photochemical, photoelectric, tidal, wave, and solar energy. It excludes energy from fossil fuel sources (oil, coal and natural gas) (TREIA2015).
2. The following studies also provide further details: Apergis et al. (2010), Menyah and Wolde-Rufael (2010), Jebli et al. (2016), Jebli et al. (2015), Jebli and Youssef (2015), Solarin et al. (2017).
3. Bilgili et al. (2017) contains a wide range of literature on the impact of renewable energy on carbon emissions and growth.
4. Countries are provided in the Appendix A.
5. The World Development Indicators uses the term‘adjusted net saving’ or ‘genuine saving’ or ‘genuine investment’. 6. WB benefits from work such as Hamilton and Clemens
(1999) and Hamilton (2005) in the calculation of the net adjusted savings variable.
7. If the Cragg-Donald F statistic exceeds the 10% maximal IV size reported in Stock and Yogo (2005), the instru-ment is considered as‘very powerful.’ If it is between 10% and 15% maximal IV sizes, it is labeled as‘powerful.’ If it is between 15% and 20% maximal IV sizes, it is considered as ‘medium.’ For the values between 20% and 25% maximal IV sizes, it is marked as‘weak’.
Disclosure statement
No potential conflict of interest was reported by the author.
References
Aidt TS. 2009. Corruption, institutions, and economic development. Ox Rev of Eco Pol. 25(2):271–291.
Aidt TS. 2010. Corruption and sustainable development. Cambridge (MA): Faculty of Economics and Jesus College, University of Cambridge. CWPE 1061.
Alesina A, Easterly W, Devleeschauwer A, Kurlat S, Wacziarg R. 2003. Fractionalization. J of Econ Growth. 8:155–194.
Anderson TW, Hsiao C.1981. Estimation of dynamic models with error components. J of the Ame Sta Assoc. 76 (375):598–606.
Apergis N, Danuletiu DC.2014. Renewable energy and eco-nomic growth: evidence from the sign of panel long-run causality. Int J of En Econ and Policy. 4(4):578–587. Apergis N, Jebli MB, Youssef SB. 2018. Does renewable
energy consumption and health expenditures decrease carbon dioxide emissions? Evidence for sub-Saharan Africa countries. Rene Energy. 127:1011–1016.
Apergis N, Payne JE.2010. Renewable energy consumption and growth in Eurasia. Energy E. 32:1392–1397.
Apergis N, Payne JE, Menyah K, Wolde-Rufael Y. 2010. On the causal dynamics between emissions, nuclear energy, renewable energy, and economic growth. Ecol Econ. 69:2255–2260.
Arellano M, Bond S. 1991. Some tests of specification for panel data: monte Carlo evidence and an application to employment equations. Rev of Econ Studies. 58 (2):277–297.
Arellano M, Bover O.1995. Another look at the instrumental variable estimation of error-components models. J of Econometrics. 68(1):29–51.
Arrow Kenneth J, Dasgupta P, Goulder L, Daily G, Ehrlich P, Heal G, Levin S, K-G M, Schneider S, Starrett D, et al.2004. Are we consuming too much? The J of Econ Perspec. 18 (3):147–172.
Azapagic A, Perdan S.2000. Indicators of sustainable devel-opment for industry: a general framework. Trans of I Chem E Part B. 78:243–261.
Bilgili F, Koçak E, Bulut Ü, Kuşkaya S. 2017. Can biomass energy be an efficient policy tool for sustainable development? Rene and Sustain Energy Rev. 71:830–845.
Blundell R, Bond S. 1998. Initial conditions and moment restrictions in dynamic panel data models. J of Econometrics. 87(1):115–143.
Bolt K, Matete M, Clemens M2002. Manual for calculating adjusted net savings. Unpublished Working Paper Environmental Department. Washington (DC): The World Bank.
Bozkurt C, Destek MA.2015. Renewable energy and sustain-able development nexus in selected OECD countries. Int J of Ener Econ and Policy. 5(2):507–514.
Dincer I.2000. Renewable energy and sustainable develop-ment: a crucial review. Rene and Sust Ene Reviews. 4 (2):157–175.
Dogan E, Seker F.2016. Determinants of CO2 emissions in the European Union: the role of renewable and non-renewable energy. Rene Energy. 94:429–439. Elum ZA, Momodu AS.2017. Climate change mitigation and
renewable energy for sustainable development in Nigeria: a discourse approach. Rene and Sust Ene Reviews. 76:72–80.
Güney T. 2017. Governance and sustainable development: how effective is governance? The J of Int Trade & Eco Devel. 26(3):316–335.
Gupta S, Davoodi HR, Alonso-Terme R. 2002. Does corrup-tion affect income inequality and poverty? Econ of Governance. 3(1):23–45.
Hall R, Jones CI.1999. Why do some countries produce so much more output per worker than others? Quar J of Econ. 114(1):83–116.
Hamilton K2005. Sustaining economic welfare: estimating changes in per capita wealth. World Bank Policy Research Working Paper No: 2498. Washington DC: The World Bank.
Hamilton K, Clemens M. 1999. Genuine savings rates in developing countries. W B Econ Review. 13(2):333–356. Jebli MB, Youssef SB. 2015. The environmental Kuznets
curve, economic growth, renewable and non-renewable energy, and trade in Tunisia. Renew Sustain Energy Rev. 47:173–185.
Jebli MB, Youssef SB, Apergis N.2015. The dynamic interac-tion between combustible renewables and waste con-sumption and international tourism: the case of Tunisia. Environ Sci Pollut Res. 22:12050–12061.
Jebli MB, Youssef SB, Ozturk I.2016. Testing environmental Kuznets curve hypothesis: the role of renewable and non-renewable energy consumption and trade in OECD countries. Ecol Indicat. 60:824–831.
La Porta R, de-Salines FL, Shleifer A, Vishny RW. 1998. Law and finance. J of Pol Econ. 106(6):1113–1155.
La Porta R, de-Salines FL, Shleifer A, Vishny RW.1999. The quality of government. J Ecs Law & Org. 15(1):222–279. Liu X, Zhang S, Bae J.2017. The impact of renewable energy
and agriculture on carbon dioxide emissions: investigat-ing the environmental Kuznets curve in four selected ASEAN countries. J of Clean Produc. 164:1239–1247. Mauro P. 1995. Corruption and growth. Quar J of Econ.
110:681–712.
Menyah K, Wolde-Rufael Y. 2010. CO2 emissions, nuclear energy, renewable energy and economic growth in the US. Energy Pol. 38:2911–2915.
Ocal O, Ozturk I, Aslan A. 2013. Coal consumption and economic growth in Turkey. Inter J of Ener Econ and Pol. 3(2):193–198.
Ozturk I, Acaravci A.2011. Electricity consumption and real GDP causality nexus: evidence from ARDL bounds testing approach for 11 MENA countries. Applied Ene. 88:2885–2892.
Roodman D2006. How to do xtabond2: an introduction to “difference” and “system” GMM in Stata. The Center for Global Development Working Paper Series, No. 103. Sinha A. 2015. Modeling energy efficiency and economic
growth: evidences from India. Inter J of Ener Econ and Pol. 5(1):96–104.
Solarin SA, Usama A-M, Ozturk I.2017. Validating the envir-onmental Kuznets curve hypothesis in India and China: the role of hydroelectricity consumption. Rene and Sust Ene Reviews. 80:1578–1587.
Soytaş U, Sari R.2003. Energy consumption and GDP: casual-ity relationship in G-7 countries and emerging markets. Energy Econ. 25:33–37.
Spaiser V, Scott K, Owen A, Holland R. 2018. Consumption-based accounting of CO2 emissions in the sustainable devel-opment goals agenda. Int J Sust Dev W Ecology. DOI:
10.1080/13504509.2018.1559252.
Stock JH, Yogo M. 2005. Testing for weak instruments in linear IV regression. In: Andrews DWK, Stock JH, editors. Identification and inference for econometric models: essays inhonor of Thomas Rothenberg. Cambridge (UK): Cambridge University Press; p. 80–108.
Tatoğlu FY. 2012. Ileri panel veri analizi: stata uygulamalı [Advanced panel data analysis: stata applied]. Istanbul (IS): Beta.
TREIA.2015. Definition of renewable energy. [accessed 2018 Jan 18].http://www.treia.org/renewable-energy-defined. Tugcu CT, Ozturk I, Aslan A. 2012. Renewable and
non-renewable energy consumption and economic growth relationship revisited: evidence from G7 countries. Energy Econ. 34:1942–1950.
UN. 2016. Affordable and clean energy: why it matters. [accessed 2018 Jan 22] https://www.un.org/sustaina
bledevelopment/wp-content/uploads/2016/08/7_Why-it-Matters_Goal-7_CleanEnergy_2p.pdf
UNFCCC. 2015. Outcomes of the U.N. climate change conference in Paris. [accessed 2018 Jan 18]. https://
www.c2es.org/site/assets/uploads/2015/12/outcomes-of-the-u-n-climate-change-conference-in-paris.pdf.
Appendix A: Countries
Albania, Angola, Argentina, Australia, Austria, Azerbaijan, Bangladesh, Belarus, Belgium, Benin, Botswana, Brazil, Bulgaria, Cambodia, Cameroon, Canada, Chile, China, Colombia, Congo Dem. Rep, Congo Rep., Cote d’Ivoire, Croatia, Cyprus, Czech Republic, Denmark, Ecuador, Egypt Arab Rep., El Salvador, Eritrea, Estonia, Finland, France, Gabon, Georgia, Germany, Ghana, Greece, Guatemala, Haiti, Honduras, Hungary, Iceland, India, Indonesia, Iran Islamic Rep., Iraq, Ireland, Israel, Italy, Jamaica, Japan, Jordan, Kazakhstan, Kenya, Korea Rep., Kyrgyz Republic, Latvia, Lebanon, Libya, Lithuania, Luxembourg, Macedonia FYR., Malaysia, Mauritius, Mexico, Moldova, Mongolia, Morocco, Mozambique, Namibia, Nepal, Netherlands, New Zealand, Nicaragua, Niger, Nigeria, Norway, Pakistan, Panama, Paraguay, Peru, Philippines, Poland, Portugal, Romania, Russian Federation, Saudi Arabia, Senegal, Serbia, Singapore, Slovak Republic, Slovenia, South Africa, Spain, Sri Lanka, Suriname, Sweden, Switzerland, Tajikistan, Tanzania, Thailand, Togo, Trinidad and Tobago, Tunisia, Turkey, Ukraine, United Kingdom, United States, Uruguay, Venezuela, RB., Vietnam, Zimbabwe.