The effect of dry-land training on functional strength and
swimming performance of 10-12 years old swimmers
Kutlukhan Ya
ğmur Ozeker
1, Murat Bilge
2, Damla Selin Yildirim Kose
31 Ministry of Youth and Sports, Konya Provincial Directorate, Konya, Turkey 2 Faculty of Sports Sciences, Kırıkkale University, Kırıkkale, Turkey 3 Faculty of Sports Sciences, Lokman Hekim University, Ankara, Turkey
Abstract. Study Objectives: The objective of this study was to examine the effect of three weeks of dry-land
training on functional strength and swimming performance in addition to eight weeks of swimming training of 15 female athletes in the 10-12 years age group with at least three years of training history. A total of 30 athletes between the ages of 10-12 participated in the study; it was divided into control and experimental groups. Methods: Muscle strength tests and swimming performance tests (50 m freestyle, 400 m freestyle, critical swimming speed tests) were applied to all groups before and after the test at eight week intervals. The dry-land training program applied to the experimental group was prepared for the 10 most frequently used muscle groups in swimming branch in the literature. Descriptive statistics were applied to the obtained data. The normality of data were analyzed with Kolmogorov-Smirnov test and it was found that the data showed a normal distribution. Paired samples t test was used for within group comparisons in the analysis of data and independent samples t test was used for comparison of measurement times of the groups. Results: Trapezius middle left-right deltoid anterior left-right, deltoid middle-right, triceps brachii left-right, gluteus maximus left-right, tensor facia latasol-right, biceps femoris left-right, quadriceps femoris left-right; a statistically significant difference was found between the groups in terms of 400 m free style and 50 m free style criti-cal swimming speed variability (p <0.05). When the pre-test and post-test values of the experimental group were compared, Trapezius middle left, deltoid anterior left-right, biceps brachii left-right, brachio radialis left-right, gluteus maximus left-right, tensor fasia lata left-right, biceps femoris left-right, quadriceps femoris left-right statistically significant differences were found in 400 m free style, 50 m free style critical swimming speed variables (p <0.01). When the developmental values of the experimental and control groups were exam-ined, trapezius middle-left, deltoid anterior left-right, deltoid middle-left, biceps brachii left-right, brachio radialis left-right, gluteus maximus left-right, tensor facia lata left, biceps phemoris left-right, quadriceps femoris left-right; statistically significant differences were found in 400 m free style and 50 m free style criti-cal swimming speed variables (p <0.05). Conclusion: Dry-land training has a positive effect on swimming and functional strength performance in 10-12 years old strength swimmers.
Keywords: Swimming, Dry-Land Training, Microfet2, Critical Swimming Speed Introduction
Swimming is defined as an Olympic branch in which free style, back, breast stroke, butterfly and mixed techniques are used, which is a combination of movements that a person does to cover a certain
distance against water resistance in the shortest time possible and uses all body muscles (1-4). Swimmers use different energy systems depending on the length of the race. Strength and condition training helps to train these energy systems (4-7). In addition to swim-ming training, physical training outside the water is
also used to improve performance in swimming. These trainings are called “Dry-Land Trainings” in swim-ming (7-9). In order to increase their underwater per-formance, swimmers should also do resistance training on land as well as in water. Performance for the success of swimmers is important that the strength and power are at the appropriate level (4,5,8,10). Dry-land train-ing occupies an important place in swimmtrain-ing traintrain-ing as it provides strength, power and flexibility to the to-tal development of the swimmer. The objective of dry-land training is to provide endurance to the muscles by increasing the strength of active muscle groups, and then to gain speed by strengthening them (4,11-13).
Swimmers who will compete in the international platform are required to do 8-12 swimming training and 3-5 dry-land training per week. If the distance covered per week and the approximate training times are considered as 80-90 km and 22-26 hours, it is seen that a significant part of these studies are dry-land training. Therefore, correct planning should be made for strength development in dry-land training (14-17).
Dry-land strength training may include exercises in which the stroke is simulated using swimming benches, mediocreiners or IV hoses. (18,19). Also, other resistance exercises such as weight training, stretching exercises, medicine ball, and plyometric ex-ercises can do the same. Dry-land exex-ercises to increase swimming power should consist of 4-12 repetitions. These repetitions should be done quickly and without interruption. The number of sets should be between 3-6 and the rest periods between sets should be 2-3 minutes (20-23).
It’s much easier to measure strength training per-formances on land than in water. Swimming benches that can measure work done numerically are motivat-ing and provide a very accurate method of measurmotivat-ing spent performance. When weight machines are used, the amount of the load lifted in a certain number of repetitions provides an excellent measurement oppor-tunity. When using instruments that allow measuring resistance, such as the median and IV tubing, the time required to complete a certain number of repetitions should be recorded. Later, this period should be im-proved (8,20,21,24). The objective of this research is to examine the effect of dry-land training 3 days a week,
in addition to swimming training for eight weeks, on strength and swimming performance of 15 female ath-letes in the 10-12 years old group with at least three years of training history.
Material and Methods
Participants
10-12 years old thirty female athletes with a training history of at least three years participated in the study. In order for the athletes to participate in the study, a “Parent Consent Certificate” was ob-tained from the parents. The athletes participating in the study were divided into two as the experimen-tal group (11.18 ± 0.80 years; n = 15) and the con-trol group (11.16 ± 0.83 years; n = 15). Both groups participated in swimming training 6 days a week for 8 weeks. In addition to the 6-day swimming training, the experimental group participated in the dry-land training three days a week before the swimming train-ing and then started the swimmtrain-ing traintrain-ing. This study was conducted with the approval of the ethics commit-tee of Selçuk University (Decision Number: 21, Date: 12.04.2018). Additionally, the study was conducted in accordance with the guidelines of the revised Helsinki Declaration.
Data Collection Tools
Hoggan MicroFET2 Manual Muscle Strength Meter
MikroFET2 (Hoggan Scientific, LLC, Salt Lake City UT, USA); it is designed for objective, reliable and measurable muscle test measurements. MikroFET2 software automatically checks calcula-tions and validity, and creates tables and graphs from test data. It shows the application location of the test with a picture. The device is powered by battery; it is designed to fit in an ergonomic and comfortable palm lighter than 1kg. This patented system using advanced digital technology provides an indicator that detects even subtle changes in the direction of application (25).
MikroFET2 features
Selectable units of measurement: Pound (lbs), Newton (N) or Kilogram-Force (kgf ) (at 1% error rate).
Muscle testing has two threshold settings.
• Low threshold-0.8 ld-300 lbs. In 0.1 lb increments.
• High threshold-3.0 lbs. 300lbs. In 0.1lb increments (1lb = 0.45kg).
Experimental Design
Before the tests were applied, two groups were informed about the tests. In order to get the best re-sults during the tests, motivating speeches were made to the athletes and the athletes were warned to per-form their perper-formance at the highest level. While the critical swimming speed test data were taken, it was aimed to swim better degrees by bringing the athletes with close swimming degrees to swim in the same series. In the muscle strength test, 10 muscle groups that are used more effectively in the biomechanics of swimming were targeted. For each muscle group, the same measurement was made on both the right and left sides three times, and the highest values were re-corded separately as right and left. Pound (lbs) was chosen as the unit of measurement and recorded. The selected muscle groups and measurement methods are as follows:
1-Anterior Deltoid: The shoulder flexion device was held in the anterior region of the upper arm near the elbow, while the subject pushed the shoulder at the maximal level backwards.
2-Middle Deltoid: Sholder abduction kept the transducer in the lateral region of the upper arm near the elbow, while the experiment pushed the shoulder upwards at the maximal level.
3-Triceps Brachii: Elbow extension pushed the experimental hand at maximal force while holding the transducer near the wrist in the direction of the pos-terior elbow.
4-Brachio Radialis: While holding the elbow flexion transducer in the region of the forearm near the wrist in a radial view, the experiment pulled the hand towards itself with its maximal force.
5-Biceps Brachii & Brachialis: While holding the elbow flexion transducer in the anterior region of the forearm near the wrist, the experiment pulled the hand towards itself with its maximal force.
6-Gluteus Maximus: Hip extension while hold-ing the posterior part of the upper foot in the region close to the knee, the experiment lifted the foot up-wards with its maximal force.
7- Tensor Disaster Lata: When the hip abduction from flexed position (hip removal from the stretched position) is held in the lateral region of the upper foot near the knee, the experiment lifts the foot upwards with its maximal force.
8-Biceps Femoris: When the knee flexion trans-ducer is held close to the ankle in the posterior region of the lower foot and the lower foot is rotated laterally, the experiment pulled the foot towards itself with its maximal force.
9- Quariceps Femoris: While the knee extension (knee deployment) held the transducer near the ankle in the antrerior region of the lower foot, the experi-ment pushed the foot with its maximal force.
10-Middle Trapezius: While the scapular ad-duction was held by taking the transducer into the shoulder approximately with the lateral angle of the scapula, the experiment raised the hand with its max-imal force.
While the critical swimming speed test was ap-plied to the subjects in the pre and post-test stages in the olympic swimming pool. 50 meters of free style swimming was performed after the warm-up swim, and 400 meters of free style time was taken after the same warm-up swim the next day. It is planned to give a day break between swims, to apply the maximum force and to obtain the best swim-ming degree.
Critical Swimming Speed Test
The Critical Swimming Speed Test (CSS), dis-covered by Ginn in 1993, is used to observe the aero-bic capacity of swimmers. The result of this test can also be used to estimate the appropriate goal time for each repetition of swimmers’ aerobic training sessions. CSS is defined as “the maximum theoretically sustain-able maximum swimming speed without getting tired
or exhausted” (26). This test consists of a maximum of two swims over 400 meters and 50 meters. Adequate rest periods should be given between each swim to en-sure that swimmers can fully rest.
Requirements for the test: swimming pool, stop-watch, assistant.
Critical swimming speed calculation
The calculation of the swimmers’ CSS is based on 400 m and 50 m performance times and is calculated as follows.
D1 = 50m, D2 = 400m, T1 = 50m’s swam seconds and T2 = 400m’s swam
CSS = (D2 - D1) / (T2 - T1) (8).
Dry Land Training Design
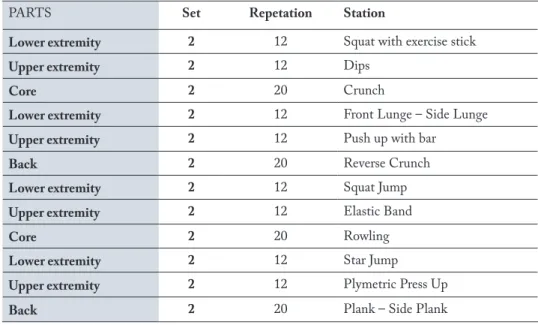
In addition to warming up and cooling, 12 move-ments aimed at working and strengthening the lower-upper extremity muscles, abdominal and back muscles were determined and applied in 2 sets to the experi-mental group as dry-land training. The exercises aim-ing to strengthen the lower-upper extremity muscles were applied to the athletes as 12 repetitions, and the
movements aiming to strengthen the abdominal and back muscles were applied to the athletes as 20 repeti-tions (Table 1) (27).
Statistical Analysis
Descriptive statistics were applied to the obtained data. the normality of data was examined with the Kolmogorov-Smirnov test and it was found that the data were normally distributed. Paired samples t test was used for within group comparisons in the analysis of data and independent samples t test was used for comparison of measurement times of the groups. Since there was a difference between the pre-test values of the experimental and control groups, whether there was a difference between the groups in the variables examined after the training was examined by calculat-ing the percentage of improvement. Development per-centages were calculated as [(Post-test value - Pre-test value) x 100] / Pre-test value. Whether there is a dif-ference between the experimental and control groups in these calculated improvement percentages was ex-amined using the t test.
PARTS Set Repetation Station
Lower extremity 2 12 Squat with exercise stick
Upper extremity 2 12 Dips
Core 2 20 Crunch
Lower extremity 2 12 Front Lunge – Side Lunge
Upper extremity 2 12 Push up with bar
Back 2 20 Reverse Crunch
Lower extremity 2 12 Squat Jump
Upper extremity 2 12 Elastic Band
Core 2 20 Rowling
Lower extremity 2 12 Star Jump
Upper extremity 2 12 Plymetric Press Up
Back 2 20 Plank – Side Plank
Results
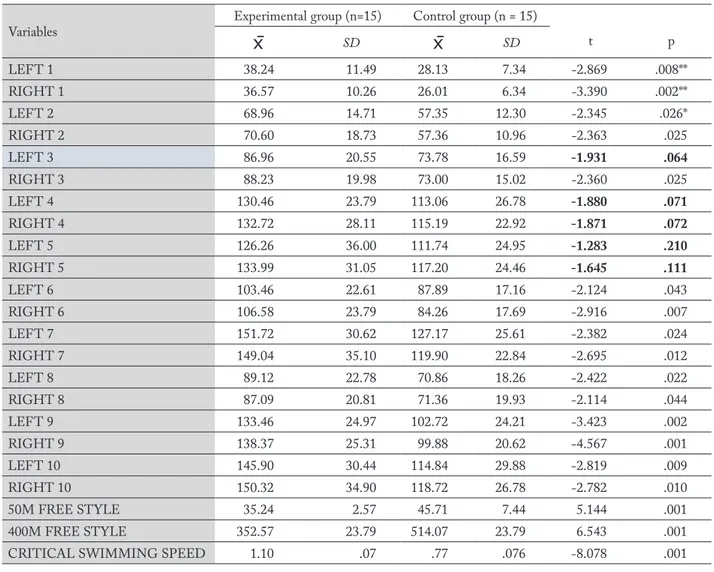
Descriptive statistics and t test results regard-ing the pretest values of the experimental and control groups are presented in Table 2.
As seen in Table 2, a statistically significant dif-ference was found between the groups in all variables except for the variables LEFT3, LEFT4, LEFT4, LEFT5, RIGHT5 in the pre-test values of the variables (p <0.05). When the averages are examined, it is seen that the values of the experimental group are higher than the values of the control group in the variables related to the force. When the average of swimming test
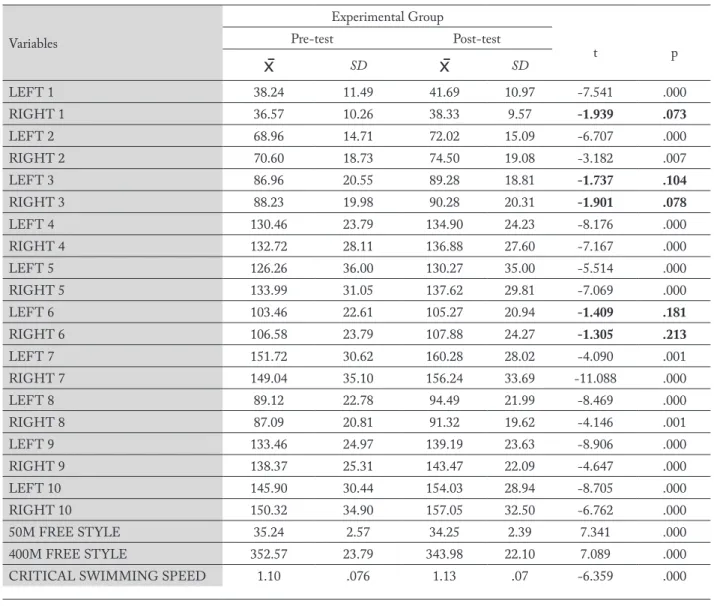
results (50M FREE STYLE, 400M FREE STYLE, PRE-CRITICAL SWIMMING SPEED) are exam-ined, it is seen that the values of the experimental group are lower than the values of the control group. Descrip-tive statistics regarding the pre-test and post-test values of the experimental group and the t-test results in de-pendent groups are presented in Table 3.
As seen in Table 3, a statistically significant dif-ference was found in all variables except RIGHT 1, LEFT 3, RIGHT 3, LEFT 6 and RIGHT 6 between the pretest and posttest values of the experimental group (p <0.01). When the averages are examined, it is seen that there is an increase in the strength variables
Variables Experimental group (n=15) Control group (n = 15)
t p
SD
SD LEFT 1 38.24 11.49 28.13 7.34 -2.869 .008** RIGHT 1 36.57 10.26 26.01 6.34 -3.390 .002** LEFT 2 68.96 14.71 57.35 12.30 -2.345 .026* RIGHT 2 70.60 18.73 57.36 10.96 -2.363 .025 LEFT 3 86.96 20.55 73.78 16.59 -1.931 .064 RIGHT 3 88.23 19.98 73.00 15.02 -2.360 .025 LEFT 4 130.46 23.79 113.06 26.78 -1.880 .071 RIGHT 4 132.72 28.11 115.19 22.92 -1.871 .072 LEFT 5 126.26 36.00 111.74 24.95 -1.283 .210 RIGHT 5 133.99 31.05 117.20 24.46 -1.645 .111 LEFT 6 103.46 22.61 87.89 17.16 -2.124 .043 RIGHT 6 106.58 23.79 84.26 17.69 -2.916 .007 LEFT 7 151.72 30.62 127.17 25.61 -2.382 .024 RIGHT 7 149.04 35.10 119.90 22.84 -2.695 .012 LEFT 8 89.12 22.78 70.86 18.26 -2.422 .022 RIGHT 8 87.09 20.81 71.36 19.93 -2.114 .044 LEFT 9 133.46 24.97 102.72 24.21 -3.423 .002 RIGHT 9 138.37 25.31 99.88 20.62 -4.567 .001 LEFT 10 145.90 30.44 114.84 29.88 -2.819 .009 RIGHT 10 150.32 34.90 118.72 26.78 -2.782 .010 50M FREE STYLE 35.24 2.57 45.71 7.44 5.144 .001 400M FREE STYLE 352.57 23.79 514.07 23.79 6.543 .001CRITICAL SWIMMING SPEED 1.10 .07 .77 .076 -8.078 .001
Table 2. Descriptive statistics and t test results regarding the pretest values of the experimental and control groups
and the critical speed variable, and a decrease in the swimming test values.
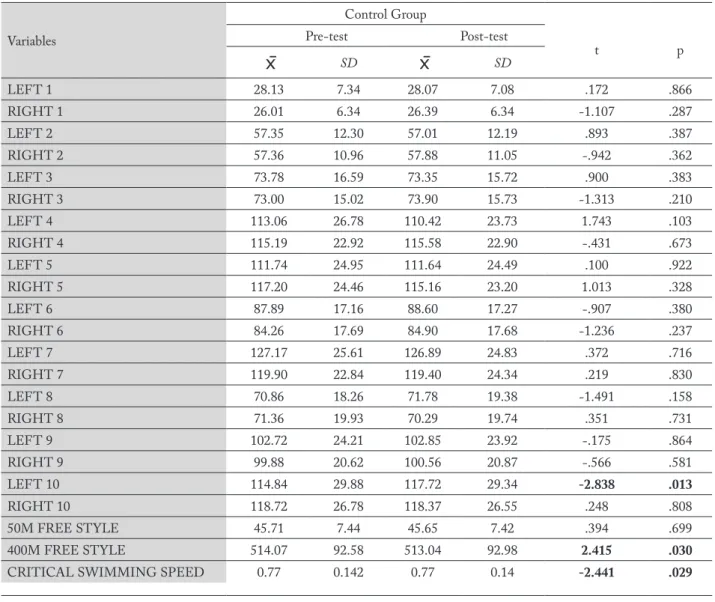
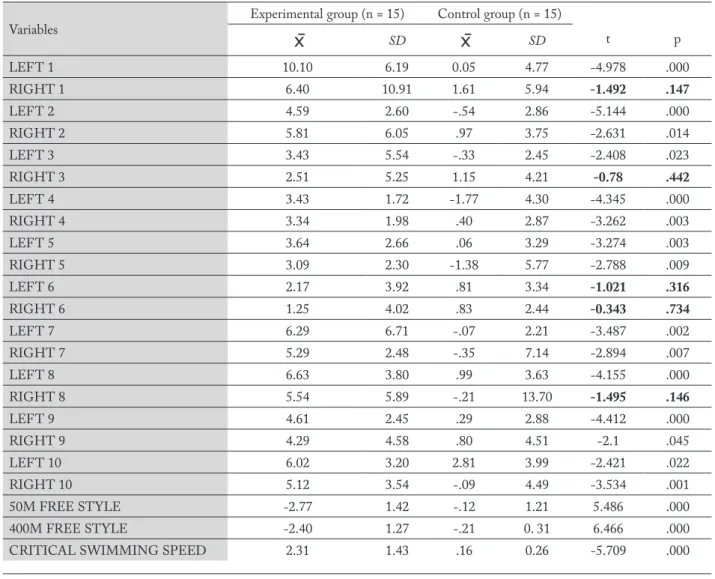
As seen in Table 4, there was no statistically sig-nificant difference between the pretest and posttest values of the experimental group in all variables ex-cept LEFT 10, 400M free style and critical swimming speed (p> 0.01). When the averages are examined, it is seen that there is an increase in the strength variables and the critical speed variable, and a decrease in the 400m free style swimming test values.
As seen in Table 5, a statistically significant differ-ence was found between the development values of the
experimental and control groups in all variables except RIGHT 1, RIGHT 3, LEFT 6, RIGHT 6, RIGHT 8 (p <0.01, p <0.05). When the averages are examined, it is seen that there is an increase in the strength vari-ables and the critical swimming speed variable, and a decrease in the swimming test values.
Discussion and Conclusion
As a result of the findings of the study, the pre-test and post-pre-test values of the experimental group
Variables Experimental Group t p Pre-test Post-test
SD
SD LEFT 1 38.24 11.49 41.69 10.97 -7.541 .000 RIGHT 1 36.57 10.26 38.33 9.57 -1.939 .073 LEFT 2 68.96 14.71 72.02 15.09 -6.707 .000 RIGHT 2 70.60 18.73 74.50 19.08 -3.182 .007 LEFT 3 86.96 20.55 89.28 18.81 -1.737 .104 RIGHT 3 88.23 19.98 90.28 20.31 -1.901 .078 LEFT 4 130.46 23.79 134.90 24.23 -8.176 .000 RIGHT 4 132.72 28.11 136.88 27.60 -7.167 .000 LEFT 5 126.26 36.00 130.27 35.00 -5.514 .000 RIGHT 5 133.99 31.05 137.62 29.81 -7.069 .000 LEFT 6 103.46 22.61 105.27 20.94 -1.409 .181 RIGHT 6 106.58 23.79 107.88 24.27 -1.305 .213 LEFT 7 151.72 30.62 160.28 28.02 -4.090 .001 RIGHT 7 149.04 35.10 156.24 33.69 -11.088 .000 LEFT 8 89.12 22.78 94.49 21.99 -8.469 .000 RIGHT 8 87.09 20.81 91.32 19.62 -4.146 .001 LEFT 9 133.46 24.97 139.19 23.63 -8.906 .000 RIGHT 9 138.37 25.31 143.47 22.09 -4.647 .000 LEFT 10 145.90 30.44 154.03 28.94 -8.705 .000 RIGHT 10 150.32 34.90 157.05 32.50 -6.762 .000 50M FREE STYLE 35.24 2.57 34.25 2.39 7.341 .000 400M FREE STYLE 352.57 23.79 343.98 22.10 7.089 .000CRITICAL SWIMMING SPEED 1.10 .076 1.13 .07 -6.359 .000
Table 3. Descriptive statistics regarding the pre-test and post-test values of the experimental group and t-test results in dependent
were compared and there was a statistically significant increase in trapezius middle left, deltoid anterior left-right, biceps brachii left-left-right, brachio radialis left- right, gluteus maximus left-right, tensor facia lata left-right, biceps femoris left-right, quardiceps femo-ris left-right muscle strength and critical swimming speed. When the critical swimming speed test results are examined, it shows that dry-land training signifi-cantly increases swimming performance in 10-12 years old female swimmers. In the experimental group, im-provement was observed in 50 m free style and 400 m free style swimming degrees. Considering the
developmental percentages of the experimental group, an increase was observed in all muscle strength and critical swimming speed, while a statistically significant decrease in swimming degrees was observed. As a re-sult of the research, a positive effect of dry-land training on functional strength and swimming performance was observed in 10-12 years old swimmers.
The developmental percentage of dry-land train-ing strength and swimmtrain-ing performances in 10-12 years old swimmers was found to be higher than those who did not do dry-land training. Atabaş (2017) re-ported that the 8-week functional strength training
Variables Control Group t p Pre-test Post-test
SD
SD LEFT 1 28.13 7.34 28.07 7.08 .172 .866 RIGHT 1 26.01 6.34 26.39 6.34 -1.107 .287 LEFT 2 57.35 12.30 57.01 12.19 .893 .387 RIGHT 2 57.36 10.96 57.88 11.05 -.942 .362 LEFT 3 73.78 16.59 73.35 15.72 .900 .383 RIGHT 3 73.00 15.02 73.90 15.73 -1.313 .210 LEFT 4 113.06 26.78 110.42 23.73 1.743 .103 RIGHT 4 115.19 22.92 115.58 22.90 -.431 .673 LEFT 5 111.74 24.95 111.64 24.49 .100 .922 RIGHT 5 117.20 24.46 115.16 23.20 1.013 .328 LEFT 6 87.89 17.16 88.60 17.27 -.907 .380 RIGHT 6 84.26 17.69 84.90 17.68 -1.236 .237 LEFT 7 127.17 25.61 126.89 24.83 .372 .716 RIGHT 7 119.90 22.84 119.40 24.34 .219 .830 LEFT 8 70.86 18.26 71.78 19.38 -1.491 .158 RIGHT 8 71.36 19.93 70.29 19.74 .351 .731 LEFT 9 102.72 24.21 102.85 23.92 -.175 .864 RIGHT 9 99.88 20.62 100.56 20.87 -.566 .581 LEFT 10 114.84 29.88 117.72 29.34 -2.838 .013 RIGHT 10 118.72 26.78 118.37 26.55 .248 .808 50M FREE STYLE 45.71 7.44 45.65 7.42 .394 .699 400M FREE STYLE 514.07 92.58 513.04 92.98 2.415 .030CRITICAL SWIMMING SPEED 0.77 0.142 0.77 0.14 -2.441 .029
approach had a positive effect on strength performance in young swimmers (28), while Pedro et al (2012) re-ported that strength is one of the main factors that can increase swimming speed in their study examining the effects of dry-land training on swimming performance (6). The research findings obtained in this framework can be considered to support the results of the study.
Girold et al (2007) found that, 2 methods com-bining swimming and dry-land strength or swimming and the resisted- and assisted-sprint training were more efficient than the swimming program alone in increasing sprint performance, whereas no differences were observed between swimming and resisted- and
assisted-sprint training. Muscle strength increased in swimming and resisted- and assisted-sprint training, whereas stroke rate increased only in resisted- and assisted-sprint training. The muscle strength gain in concentric condition of the elbow extensors was a good predictor of the 50-m performance in swimming, while the stroke depth and the stroke rate variations were good predictors of the 50-meter performance in resisted- and assisted-sprint training(15).
On the other hand, according to Sadowski et al’s (2012) data, it is not clear that strength training allowed the improvement in swimming performance in youth swimmers although a tendency to improve
Variables Experimental group (n = 15) Control group (n = 15)
t p
SD
SD LEFT 1 10.10 6.19 0.05 4.77 -4.978 .000 RIGHT 1 6.40 10.91 1.61 5.94 -1.492 .147 LEFT 2 4.59 2.60 -.54 2.86 -5.144 .000 RIGHT 2 5.81 6.05 .97 3.75 -2.631 .014 LEFT 3 3.43 5.54 -.33 2.45 -2.408 .023 RIGHT 3 2.51 5.25 1.15 4.21 -0.78 .442 LEFT 4 3.43 1.72 -1.77 4.30 -4.345 .000 RIGHT 4 3.34 1.98 .40 2.87 -3.262 .003 LEFT 5 3.64 2.66 .06 3.29 -3.274 .003 RIGHT 5 3.09 2.30 -1.38 5.77 -2.788 .009 LEFT 6 2.17 3.92 .81 3.34 -1.021 .316 RIGHT 6 1.25 4.02 .83 2.44 -0.343 .734 LEFT 7 6.29 6.71 -.07 2.21 -3.487 .002 RIGHT 7 5.29 2.48 -.35 7.14 -2.894 .007 LEFT 8 6.63 3.80 .99 3.63 -4.155 .000 RIGHT 8 5.54 5.89 -.21 13.70 -1.495 .146 LEFT 9 4.61 2.45 .29 2.88 -4.412 .000 RIGHT 9 4.29 4.58 .80 4.51 -2.1 .045 LEFT 10 6.02 3.20 2.81 3.99 -2.421 .022 RIGHT 10 5.12 3.54 -.09 4.49 -3.534 .001 50M FREE STYLE -2.77 1.42 -.12 1.21 5.486 .000 400M FREE STYLE -2.40 1.27 -.21 0. 31 6.466 .000CRITICAL SWIMMING SPEED 2.31 1.43 .16 0.26 -5.709 .000
performance due to both types of training was noticed. It is uncertain whether dry-land strength training leads to improved sprint performance while swimming (29). As a result, strength training using in dry-land training can increase the ability to generate propulsion in water, especially for short distance swimming. More work is needed to determine the appropriate volumes and intensities of training programs by gender and level.
As a result of this research, the following sugges-tions can be developed;
1- This study can be done for different age groups. 2- It can be looked at the effect of dry-land train-ing on male swimmers.
3- Dry-land training with free weights can be ap-plied to adult swimmers.
4- By expanding the scope of the study, it can be examined on a larger population group.
Acknowledgement
This study was obtained from Kutlukhan Yagmur Ozeker’s master thesis.
Conflicts of Interest
The authors declare that there is no conflict of in-terest about this manuscript.
References
1. Hanula D. The swim coaching bible. Human Kinetics 2001; 21–133.
2. Bozdoğan A. Swimming physiology - mechanic-method. Ilpress Printing and Publishing İstanbul 2003; 23–132. 3. Wilke K, Madsen O. Coaching the young swimmer. Sports
Support Syndicate; 1990.
4. Salo D, Riewald SA. Complete conditioning for swimming. Human Kinetics 2008; 27–200.
5. Newton D, Hase S, Ellis A. Effective implementation of online learning: a case study of the queensland mining in-dustry. Jounal of Workplace Learning 2002; 14(4): 156–165. 6. Toussaint HM. Strength power and technique of swim-ming performance: Science meets practice. In: Schwimmen
Lernen und Optimieren. Ed: Leopold, W. Schwimmtrainer – Vereinigung V, Beucha, Deutschland 2007; 43-54.
7. Tanaka H, Costill DL, Thomas R, Fink WJ, Widrick JJ. Dry-land resistance training for competitive swimming. Med Sci Sports Exerc 1993; 25: 952–959.
8. Garrido N, Marinho DA, Reis VM, Van Den Tillaar R, Costa AM, Silva AJ. Does combined dry-land strength and aerobic training inhibit performance of young competitive swimmers? J Sport Sci Med 2010; 9: 300–310.
9. Morouco P, Keskinen KL, Vilas-Boas JP, Fernandes RJ. Re-lationship between tethered forces and the four swimming techniques performance. J Appl Biomech 2011; 27(2): 161–9.
10. Kramer JW, Fleck SJ. Strength Training for Young Athletes. Second edition. Human Kinetics 2005; 1–219.
11. Kalapotharakos V, Smilios L, Parlavatzas A, Tokmakidis SP. The effect of moderate resistance strength training and de-training on muscle strength and power in older men. Journal Geriatr Phys Ther 2007; 30(3): 109–113.
12. Strass D. Effects of maximal strength training on sprint per-formance of competitive swimmers. In: Swimming Science V. Eds: Ungerechts B.E, Wilke K and Reischle K. Spon Press London 1988; 149–156.
13. Inverninizi PL, Scuratti R, Longo S, Gatta G, Michielon G. Relationships between swimming style and dry-land stregth in breaststroke Sporst Sci Healt 2014; 10,11–16.
14. Soydan S. The effect of classical and 8-week strength training with body weight on the degrees in 200m free style swimming in 12–14 age group female athletes. Ko-caeli University Institute of Health Sciences, Master’s thesis; 2006.
15. Girold S, Maurin D, Dugue B, Chatard JC, Millett G. (2007) Effects of dry-land vs. resisted-and assisted-sprint exercises on swimming sprint performances. Journal of Strenght and Conditioning Research 2007; 21(2): 599–605 16. Garrido N, Marinho DA, Barbosa TM, Costa AM, Silva
AJ, Perez-Turpin JA, Marques MC. The relationship be-tween dryland strength, power variable sand short sprint performance in young competitive swimmers. Offical Jour-nal of the Area of Physical Education and Sport 2010; 5 (2): 240–249.
17. Sharp RL, Troup JP, Costill DL. Relationship between power and sprint freestyle swimming. Med Sci Sports Exerc 1982; 14: 53–56.
18. Hawley JA, Williams MM, Vickovic MM, Handcock PJ. Muscle power predicts Freestyle swimming performance. Brit J Sport Med 1992;26(3): 151–155.
19. Faigenbaum AD, Milliken LA, Loud RL, Burak BT, Do-herty CL, Westcott WL. Comparison of 1 and 2 days per week of strength training in children. Res Q Exercise Sport 2002;73: 416–424.
20. Lucero B. Strength training for faster swimming. Meyer & Meyer Sport 2012: 31–57.
21. Crowe SE, Babington JP, Tanner DA, Stager JM. The re-lationship of strength to dryland power, swimming power,
and swimming performance. Med Sci Sports Exerc 1999; 31(5): 255.
22. Aspenes S, Kjendlie PL, Hoff J, Helgerud J. Combined strength and endurance training in competitive swimmers. J Sport Sci Med 2009; 8: 357–365.
23. Scott OR. A strong start. Strength and resistence training guideliness for children and adolescets. American Fitness 2002; 38–34.
24. Shellock FG, Prentice WE. Warming-up and stretching for improved physical performance and prevention of sportsre-lated injuries. Sports Medicie 1985; 2: 267–278.
25. Newton RU, Jones J, Kraemer WJ, Wardle H.. Strength and power training of Australian olympic swimmers. Strength Cond J 2002; 24 (3): 7–15.
26. Mackenzie, B. Performance evaluation tests. London: Elec-tric World plc 2005: 24(25), 57–158.
27. Sweetenham B, Atkinson J. Championship swim training. Australia. Human Kinetics Publishers 2003; 153.
28. Atabaş E. The effect of 8-week functional training ap-proach applied to young swimmers on strength, flexibility and swimming performance. Süleyman Demirel University Institute of Health Sciences, Master’s Thesis 2017. 29. Sadowski J, Mastalerz A, Gromisz W & Niźnikowski T. ().
Effectiveness of the power dry-land training programmes in youth swimmers. Journal of human kinetics, 2012: 32(1), 77–86.
Correspondence: Murat Bilge
Faculty of Sports Sciences, Kırıkkale University, Kırıkkale, Turkey