© TÜBİTAK
doi:10.3906/kim-1808-38 h t t p : / / j o u r n a l s . t u b i t a k . g o v . t r / c h e m /
Research Article
Synthesis, crystal structure, and characterization of two heterometallic transition
metal citrate complexes [M = Co(II) and Cd(II)]
Zeki KARTAL1,∗,, Onur ŞAHİN2,, Abdülkerim YAVUZ3,
1Department of Physics, Faculty of Arts and Sciences, Kütahya Dumlupınar University, Kütahya, Turkey 2Scientific and Technological Research Application and Research Center, Sinop University, Sinop, Turkey
3Institute of Science and Technology, Kütahya Dumlupınar University, Kütahya, Turkey
Received: 13.08.2018 • Accepted/Published Online: 31.12.2018 • Final Version: 03.04.2019
Abstract: In this study, two heterometallic transition metal complexes with the formulas [CoK4(µ10-C6H5O7)2]n and
[CdK( µ8-C6H5O7)(µ -H2O)(H2O)]n were synthesized as crystalline compounds. The structures of these crystalline
metal complexes were characterized by their spectral analyses (FT-IR, FT-Raman, thermal analysis, magnetic properties, and single-crystal X-ray diffraction techniques). According to the spectral data of the new metal complexes obtained, both metal complexes are in the monoclinic crystal system and in the P21/c and P21 space groups, respectively.
The asymmetric unit of the metal complex [CoK4(µ10-C6H5O7)2]n contains one Co(II) ion, two potassium cations,
and one (C6H5O7) citrate ligand, whereas that of the asymmetric unit of the metal complex [CdK( µ8-C6H5O7)(µ
-H2O)(H2O)]n contains one Cd(II) ion, one potassium cation, one (C6H5O7) citrate ligand, and two coordinated water
molecules.
Key words: Transition metal complexes, single-crystal X-ray diffraction analysis, vibrational spectra, citric acid, citrate
ion
1. Introduction
Chlorophyll, which gives color to green plants around us and helps transport oxygen in the blood of living things, as well as almost all of the polymers that make our life easier, are known as coordination compounds. In order to obtain the coordination compounds, metals, (usually transition metals) and different ligand molecules are required to form compounds with them. The transition metal atoms are the metal atoms having partially filled d (or f ) electron orbits, while the ligands are molecules or groups that bind with the transition metal atom. The main feature of all the coordination compounds is that the coordination bonds are formed between ligands and metal atoms or ions. While the ligands are known as electron pair donors, the metals are also known as electron acceptors. Many coordination compounds obtained by different transition metal atoms and different ligand molecules play a very important role in biochemistry, bioorganic chemistry, and bioinorganic chemistry.1
Citric acid is a natural chemical substance and a weak organic tricarboxylic acid having the chemical formula C6H8O7 (hereafter abbreviated as CitH3) .2 Although CitH3 is an acidic substance, it plays a role in helping to lower the acidity levels of the body fluids of living beings by binding to alkali metal atoms.3 CitH
3 is not a strong antioxidant, but it increases the activity of many useful antioxidants.4,5 As an antioxidant,
∗Correspondence: [email protected]
CitH3 can neutralize the damaging effects of free radicals, which are unstable compounds that trigger the growth of cancerous tumors. CitH3 mixes easily with minerals and metals and facilitates their absorption in the bodies of living beings.6 Certain metals or metal compounds have been used in the treatment of many diseases in human history. Some of these metal compounds are metal compounds of CitH3 and citrate ion.7 The citrate (C6H5O37−) ion is a chemical compound that occurs when CitH3 loses three hydrogen atoms (hereafter abbreviated as Cit). CitH3 and Cit ions can have a wide variety of coordination compounds with metal atoms due to their structural flexibility and the possession of three carboxylic groups that can be electron-donating.8 A wide variety of metal–citrate compounds and mixed ligand crystals have been previously obtained by different researchers in recent years.9−18
The aim of this study is to obtain new coordination compounds using the CitH3 ligand and some transition metal salts, which are of great importance for living beings. This study also aims to explain the structural properties of these coordination compounds obtained by various spectroscopic methods.
As a result, two crystalline compounds were obtained using CitH3, cobalt and cadmium metal salts, their closed formulas being [CoK4(µ10-C6H5O7)2]n (hereafter abbreviated as 1) and [CdK( µ8-C6H5O7)(µ -H2O)(H2O)]n (hereafter abbreviated as 2), respectively.
2. Results and discussion
2.1. Crystal structures of crystals 1 and 2
The X-ray single-crystal study showed that crystals 1 and 2 have 3D coordination polymers. The molecular structures of crystals 1 and 2, with the atom numbering schemes, are shown in Figures 1 and 2.
Figure 1. The molecular structure of crystal 1 showing
the atom numbering scheme [(v)− x + 1, −y + 1, −z + 1].
Figure 2. The molecular structure of crystal 2 showing
the atom numbering scheme [(i)− x + 2, y + 1/2, −z +
1; (ii)x + 1, y, z] .
Details of data collection and crystal structure determinations are given in Table 1. The selected bond lengths and angles and the hydrogen bonding parameters for crystals 1 and 2 are summarized in Tables 2 and 3, respectively.
The asymmetric unit of crystal 1 contains one Co(II) ion, two potassium cations, and one Cit ion, while crystal 2 contains one Cd(II) ion, one potassium cation, one Cit ion, and two coordinated aqua ligands. In
Table 1. Crystal data and structure refinement parameters for crystals 1 and 2.
Crystal data 1 2
Empirical formula C12H10O14CoK4 C6H9O9CdK
Formula weight 593.53 376.63
Crystal size (mm) 0.12 × 0.11 × 0.08 0.10 × 0.08 × 0.07 Crystal system Monoclinic Monoclinic
Space group P21/c P21 a(Å) 8.7816 (13) 7.0520 (16) b(Å) 13.5344 (19) 8.4916 (19) c(Å) 9.0800 (13) 9.686 (2) β(°) 113.617 (4) 110.247 (6) V (Å3) 988.8 (2) 544.2 (2) Z 2 2 Dc(g cm−3) 1.993 2.298 µ (mm−1) 1.78 2.42 θ range (°) 3.1–28.3 3.1–28.3 Measured reflections 28735 13072 Independent reflections 1900 2694 Rint 0.036 0.034 S 0.93 1.14 R1 / wR2 0.097 / 0.248 0.034 / 0.092
∆ρmax/ ∆ρmin (eÅ−3) 2.01 / –0.89 1.44 / –1.27
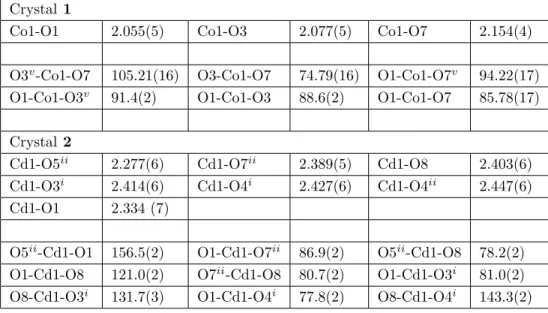
Table 2. Some selected bond distances and some angles for crystals 1 and 2 (Å, °).
Crystal 1
Co1-O1 2.055(5) Co1-O3 2.077(5) Co1-O7 2.154(4)
O3v-Co1-O7 105.21(16) O3-Co1-O7 74.79(16) O1-Co1-O7v 94.22(17) O1-Co1-O3v 91.4(2) O1-Co1-O3 88.6(2) O1-Co1-O7 85.78(17) Crystal 2
Cd1-O5ii 2.277(6) Cd1-O7ii 2.389(5) Cd1-O8 2.403(6) Cd1-O3i 2.414(6) Cd1-O4i 2.427(6) Cd1-O4ii 2.447(6) Cd1-O1 2.334 (7)
O5ii-Cd1-O1 156.5(2) O1-Cd1-O7ii 86.9(2) O5ii-Cd1-O8 78.2(2) O1-Cd1-O8 121.0(2) O7ii-Cd1-O8 80.7(2) O1-Cd1-O3i 81.0(2) O8-Cd1-O3i 131.7(3) O1-Cd1-O4i 77.8(2) O8-Cd1-O4i 143.3(2)
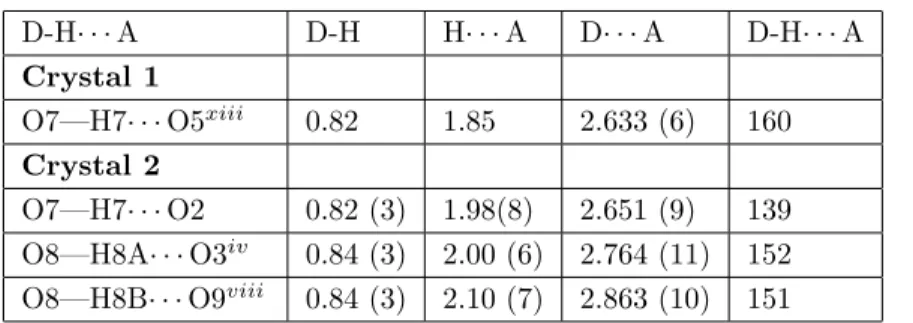
Table 3. Hydrogen-bond parameters for crystals 1 and 2 (Å, °). D-H· · · A D-H H· · · A D· · · A D-H· · · A Crystal 1 O7—H7· · · O5xiii 0.82 1.85 2.633 (6) 160 Crystal 2 O7—H7· · · O2 0.82 (3) 1.98(8) 2.651 (9) 139 O8—H8A· · · O3iv 0.84 (3) 2.00 (6) 2.764 (11) 152 O8—H8B· · · O9viii 0.84 (3) 2.10 (7) 2.863 (10) 151
Symmetry codes: (xiii) – x + 1,− y + 1, − z + 2 for crystal 1; (iv) – x + 2, y − 1/2, − z + 1; (viii) x + 2, y, z + 1
for crystal 2.
crystal 1, the Co(II) ion is located on a center of symmetry and is coordinated by six oxygen atoms [Co1-O1 = 2.055(5) Å, Co1-O3 = 2.077(5) Å, and Co1-O7 = 2.154(4) Å] from two Cit ions.19−24 The coordination geometry around the Co(II) ion can be described as a distorted octahedral geometry. For charge neutralization, the carboxylate groups of the Cit ion are fully deprotonated. The Cit ion is of very low symmetry and has space group P 21/n .14 The highest possible symmetry point group is Cs. The K+ cations are of two coordination types. In the first coordination, the K1 cation is coordinated by seven O atoms from carboxylate groups. In the second coordination, cation K2 is coordinated by six O atoms from carboxylate groups. Adjacent K+ cations are linked together by two oxygen bridges to form a four-membered ring with a K2O2 core. Adjacent K2O2 binuclear motifs are further joined by the Co(II) ions and the Cit ligands through carboxyl atoms, generating a 3D coordination polymer (Figure 3).
In crystal 2, the Cd(II) ion is coordinated by six oxygen atoms [bond distances ranging between 2.277(6) and 2.447(6) Å] from three the Cit ligands and one oxygen atom [Cd1-O8 = 2.403(6) Å] from the aqua ligand. These bond distances are comparable to the corresponding bonds lengths in the literature.25−31 In crystal 2, for charge neutralization, the carboxylate groups of the Cit ligand are fully deprotonated. The K1 cation is coordinated by five oxygen atoms from the Cit ligands and one oxygen atom from the aqua ligand. Adjacent Cd(II) and K+ ions are further joined by the Cit ligands and the aqua ligands, generating a 3D coordination polymer (Figure 4).
The molecules of crystals 1 and 2 are connected by O-H· · · O hydrogen bonds (Table 3). The O· · · O
distances range from 2.651(9) to 2.864(10) Å, respectively. 2.2. Spectral characterization of crystals 1 and 2
The vibrational spectra (FT-IR and FT-Raman) of CitH3 (Figure 5a) as a ligand molecule and the Cit in crystal 1 (Figure 5b) and crystal 2 (Figure 5c) are compatible with each other. The following spectra (Figures 5b and 5c) show that crystal 1 and crystal 2 have analogous spectral features. As can be seen in Figures 5a–5c, the presence of bands belonging to the ligand shows the existence of the Cit in crystals 1 and 2.
The most important absorption bands of the free CitH3are the O-H, C-H, C =O, C-C, and C-O stretching and bending frequencies. For the IR and Raman spectra of the free CitH3 molecule, some observed bands correspond to the vibrations of the groups ν (O-H) at 3497 and 3495 cm−1, ν (CH2) at 3293 and 3289 cm−1,
Figure 3. An infinite 3D layer in crystal 1. Figure 4. An infinite 3D layer in crystal 2.
Figure 5. The vibrational (FT-IR and FT-Raman) spectra of the free CitH3 (a), the [CoK4(µ10-C6H5O7)2]n (1)
stretching at 1082–1053 cm−1 and 902–775 cm−1, γ (COO) o.o.p. deformation at 687 and 682 cm−1, and
τ (OH) torsion at 596 and 587 cm−1, respectively.32
Some of the major IR and Raman absorption bands of the CitH3 ligand observed in the vibration spectra of crystal 1 formed by the CitH3 ligand with the potassium and cobalt atoms are ν (CH2) at 3287 and 3283 cm−1, ν (C-OH) stretching at 1176 and 1165 cm−1, ν (C-C) stretching at 1080–1069 cm−1 and 910–904 cm−1,
γ (COO) o.o.p. deformation at 678 and 671 cm−1, and τ (OH) torsion at 594 and 583 cm−1, respectively. Similarly, some of the major IR and Raman absorption bands of the CitH3 ligand observed in the vibration spectra of crystal 2 formed by the CitH3 ligand with the potassium and cadmium atoms are ν (CH2) at 3285 and 3279 cm−1, ν (C-OH) stretching at 1172 and 1168 cm−1, ν (C-C) stretching at 1078–1070 cm−1 and 906–902 cm−1, γ (COO) o.o.p. deformation at 679 and 674 cm−1, and τ (OH) torsion at 595 and 586 cm−1, respectively.
These absorption vibration bands were not affected by the formation of crystals 1 and 2 and remained almost constant. These vibration bands do not contribute to the formation of crystals 1 and 2.
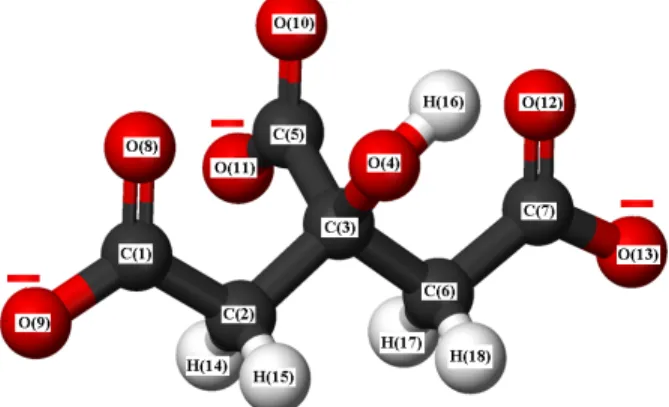
The CitH3 ligand molecules are converted into Cit ions by losing hydrogen atoms of three carboxyl groups in the reaction medium. Due to the Cs symmetry point group that the Cit ion possesses, all its vibration modes are both IR-active and Raman-active. The molecular structure of the Cit ion is shown in Figure 6.
Figure 6. The molecular structure of the Cit ion.
In the vibrational spectra of crystals 1 and 2, no ν (O-H) and δ (O-H) peaks are observed. This is due to the fact that the CitH3 molecule loses three hydrogen atoms from its three carboxyl groups while returning to the Cit structure. In the Cit ion, there is only one hydroxyl group. The intensity of the vibration peak of this hydroxyl group is very weak compared to the intensity of the vibration peaks of the hydroxyl groups in the other three carboxyl groups of the free CitH3. Therefore, the intensity of these vibration peaks in the vibration spectra of crystals 1 and 2 is very weak compared to the intensity peaks of the free CitH3.
As can be seen in the Figure 6, there is one hydroxyl group [O (4) H(16)] and three carboxylate groups [C (5) O (10) O (11)−], [C(1)O(8)O(9)−] , and [C(7)O(12)O(13)−] in a Cit ion. The Cit ion can bind to a variety of metal atoms from an oxygen atom in one hydroxyl group and from six oxygen atoms in the three carboxylate groups of its structure. Different binding forms of Cit ions in the structures of crystals 1 and 2 with K, Co, and Cd ions are shown in Figures 1 and 2.
There are peaks of several functional groups of the Cit ion in the IR and Raman spectra of crystals 1 and 2. Some of these peaks have shifted a small amount to the low frequency region or high frequency region
relative to the free CitH3 peaks due to the formation of the coordination compounds. These small frequency shifts are not very important.
In addition, there are two carboxylate stretching vibrations due to Cit formation, which are not found in the free CitH3. Two different stretching (COO−) vibrations occur in the vibrational spectroscopy of Cit because one of the three carboxylate groups present in the Cit ion is an α -carboxylate group [C(5)O(10)O(11)−] and two are β -carboxylate groups [C (1) O (8) O (9)−] and [C(7)O(12)O(13)−] (see Figure 6).32 Each carboxylate group of the Cit ion has two stretching vibrations, called symmetric [ νs(COO−) ] and antisymmetric [ νas(COO)−].
The νas(COO−) bands of the Cit ions in the IR and Raman spectra are observed at 1614 and 1577 cm−1 for IR and at 1620 and 1583 cm−1 for Raman for crystal 1 and at 1619 and 1583 cm−1 for IR and at 1609 and 1560 cm−1 for Raman for crystal 2. The νs(COO−) bands of the Cit ion in the IR and Raman spectra are observed at 1414 and 1379 cm−1 for IR and at 1414 and 1396 cm−1 for Raman for crystal 1 and at 1421 and 1397 cm−1 for IR and at 1441 and 1398 cm−1 for Raman for crystal 2, respectively.
The difference between the antisymmetric and symmetric stretching of the carboxylate groups, ∆ [ νas(COO−)− νs(COO−) ], was closer to 200 cm−1 in crystals 1 and 2, which shows that bridging com-pounds with two separate metal atoms32 and the carboxylate groups of the Cit ion coordinate to the K, Co, and Cd ions in a polydentate fashion (Figures 1 and 2).
The water molecules are found in the structure of crystal 2 as water of crystal. This situation can be seen clearly in its vibration spectra. In the IR and Raman spectra of crystal 1, there is no stretching vibration peak of water of crystal in the region 3600–3000 cm−1, whereas in the IR and Raman spectra of crystal 2 there is a stretching vibration peak of the water of the crystal at 3371 cm−1 for IR and 3394 cm−1 for Raman (Figures 5b and 5c).33
Due to the formation of metal–citrate bonds, the characteristic metal–oxygen stretching vibrations occur in crystals 1 and 2. The ν(Co− O) bands of the Cit ion in the IR and Raman spectra of crystal 1 are observed
at 594 and 588 cm−1, respectively. The ν(Cd− O) bands of the Cit ion in the IR and Raman spectra of crystal 2 are observed at 429 and 421 cm−1, respectively. The ν(K− O) bands of Cit in the Raman spectra of crystals
1 and 2 are observed at 340 and 308 cm−1, respectively. Similar metal–oxygen bond stretching vibrations have been found in other studies.34−36
2.3. Thermal behavior of crystals 1 and 2
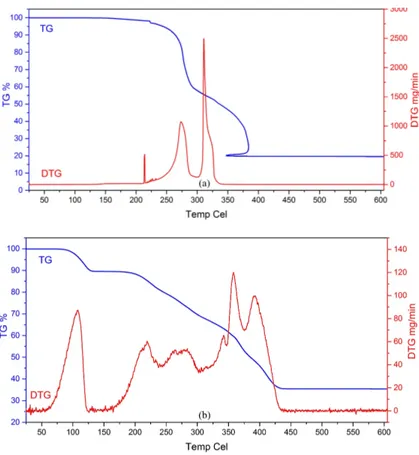
TG and DTG curves were obtained to study the thermal behavior of crystals 1 and 2. The thermal curves of crystals 1 and 2 are shown in Figures 7a and 7b. As shown in Figure 7a, crystal 1 without water of crystal in its structure is stable up to 165 °C during heating. The first mass loss occurs when it is heated in the range of 165 °C to 230 °C and the complex begins to decompose. These decompositions occur in three steps with DTG maximum values of 223 °C, 278 °C, and 344 °C. Above about 350 °C, crystal 1 is completely decomposed. As a result of the thermal decomposition, it was found that the metal oxides (CoO + KO) remaining in the experimental medium were present and the percentage value of the mixture of these metal oxides was 22% theoretically and 23.4% experimentally.
As shown in Figure 7b, crystal 2 was thermostable up to 86 °C. The first mass loss happens between 86 °C and 130 °C (DTG maxima 119 °C) with mass loss of 9.23%, corresponding to the departure of two coordinated waters (the calculated value was 9.56%). Above 130 °C, the anhydrous complex begins to decompose in five
steps with DTG maximum values of 228 °C, 284 °C, 352 °C, 368 °C, and 406 °C. Above 370 °C, crystal 2 is completely decomposed. As a result of thermal decomposition for crystal 2, it was thought that the residual material in the high temperature test environment could be cadmium oxide and potassium (CdO + K). The percentage value of this remaining mixture was seen to be 44.44% theoretically and 39.4% experimentally. These theoretical and experimental results support the accuracy of our method.
Figure 7. The TG and DTG curves of crystals 1 (a) and 2 (b).
2.4. The magnetic moments and the temperature-dependent magnetization values of crystals 1 and 2
Since crystal 1 has only one high-spin Co2+ (d7) ion in an octahedral structure, the number of unpaired electrons for this crystal is three. There are no unpaired electrons for crystal 2 due to Cd2+ (d10) ions. According to these results, the calculated values of the magnetic moments of crystals 1 and 2 are of 3.87 BM and 0.00 BM, respectively. The room temperature experimental magnetic moments values of crystal 1 measured by the Gouy method were found to be 3.84 BM.
Since only crystal 1 has a magnetic moment, its temperature-dependent magnetization value was inves-tigated. Measurements of the magnetization value of crystal 1 were made in two separate stages, with magnetic field heating (field heated, FH) and magnetic field cooling (field cooled, FC). The graphs of the temperature dependence of the magnetization value of crystal 1 are shown in Figure 8.
According to the crystal structure analysis of crystal 1, its molar mass and density were obtained as
Mr = 593.53molg and ρ = 1.993cmg3, respectively. For crystal 1, using the experimental data obtained from
magnetic moment value was found to be 3.80 BM. µef f = √ MrkM T NAρH (1)
When diamagnetic corrections are made for the ligands and ions forming crystal 1, the value of its effective magnetic moment is 3.92 BM. This result, obtained by the vibrating sample magnetometer (VSM) method for effective magnetic moment value, shows that the theoretical value and other experimental values are in good agreement. According to the data obtained from these graphs, crystal 1 has a ferromagnetic material property in the experimental temperature range of 243–373 K. However, the value of the magnetic property of crystal 1 increases in accordance with the experimental and literature results as its temperature decreases. While the temperature of crystal 1 decreases in the low temperature region, crystal 1 passes to the other structural phase from a structural phase at a certain temperature. The graph of temperature dependence of the changes of the magnetization value of crystal 1 is also shown in Figure 9.
Figure 8. The graphs of the temperature dependence of
the magnetization value of crystal 1.
Figure 9. The graph of temperature dependence of the
changes of the magnetization value of crystal 1.
The structural phase transition temperatures of crystal 1 were obtained according to the TC= dMdT graph, from FC data as TC,F C = 323 K and from FH data as TC,F H = 313 K . We measured the magnetization values of crystal 1 due to the temperature being under the influence of the constant magnetic field. The magnetization values [M(T)] of crystal 1 under the constant magnetic field effect were measured at a temperature range of 243 to 373 K. At the specified temperature range, crystal 1 was first cooled under the influence of the magnetic field (FC) and then heated under the same magnetic field (FH). The dM
dT ratios were obtained from the M(T) graphs of the obtained FC and FH states, and the graph of the dM
dT ratios was drawn based on the temperature. The temperatures of the dM
dT ratios in these graphs are minimum Curie temperatures, which cause phase transitions for crystal 1. These two Curie temperatures are different from each other, which indicates the presence of some impurities or crystal defects in the structure of crystal 1. The absence of hysteresis in the magnetization curve of crystal 1 and the fact that the magnitude of its magnetization value does not change much in the specified temperature range indicates that crystal 1 does not make a magnetic phase transition; it only makes a structural phase transition at this temperature range.
2.5. Conclusions
Our synthesis studies were carried out in aqueous media and at pH ~5.5. The cobalt and cadmium ions reacted with CitH3 in aqueous solution and afforded the [CoK4(µ10-C6H5O7)2]n and [CdK( µ8-C6H5O7)(µ -H2O)(H2O)]n, which were isolated in crystalline forms and were characterized by X-ray single-crystal data analysis method. FT-IR, Raman spectral, and thermal analyses studies were also conducted. The two cobalt-citrate and cadmium-cobalt-citrate complexes with zigzag chains were further connected into a 3D network by K+ ions.
Formations of crystals 1 and 2 destroy the carbonyl stretching vibrations of the free citric acid ligand at wave numbers 1750–1703 and 1735–1691 cm−1. Instead of the missing carbonyl stretching vibrations, two new asymmetric and symmetric carboxylate stretching vibrations occur in the citrate ion in the 1615–1580 and 1415–1395 cm−1 wavenumber regions. The differences between symmetric and asymmetric stretching vibrations in crystals 1 and 2 are less than 200 cm−1. This indicates that the citrate ligand acts as a bridge between the metal atoms. These changes of the carbonyl stretching vibration regions are most evident in the formation of cobalt citrate and cadmium citrate compounds.
The structures of crystals 1 and 2 were stable with temperature changes of up to 165 and 86 °C, respectively, and were not disturbed. It has also been observed that the magnetization values of crystal 1 depend on the temperature and that the structural phase changes occur at temperatures TC,F C = 323 K and
TC,F H = 313 K .
3. Experimental
3.1. Materials and syntheses of the crystals [CoK4(µ10-C6H5O7)2]n and [CdK( µ8-C6H5O7) ( µ -H2O)(H2O)]n
Cobalt chloride (CoCl2· 6H2O, Merck, 99%), cadmium chloride (CdCl2· 2H2O, Fluka, 96%), CitH3 (C6H8O7, Acros Organics, 99%, anhydrous), and potassium hydroxide (KOH, Acros Organics, 85%) are chemicals rep-resenting commercially analytical reagents and are used without further purification. The following chemical treatments were carried out to produce the title compounds: first, 1 mmol of CitH3 (0.192 g) was dissolved in distilled hot water (10 mL); afterwards, a solution of 1 mmol MCl2 [M(II)Cl2 = CoCl2· 6H2O (0.238 g) or CdCl2· 2H2O (0.219 g)] in distilled hot water (5 mL) was added to the mixture. Then the pH value of the reaction medium was adjusted to 5.5 using appropriate amounts of KOH solution for each compound. The whole mixture was stirred in a magnetic stirrer for 1 day at a constant temperature of 70 °C. Then the mixtures were filtered to remove impurities and allowed to crystallize at room temperature.
Crystals were formed in about 3 weeks as light pink for Co(II) (3.26 mg, 55% yield) and colorless crystals for Cd(II) (2.58 mg, 62% yield). Their chemical formulas were proved to be [CoK4(µ10-C6H5O7)2]n (1) and [CdK( µ8-C6H5O7)(µ -H2O)(H2O)]n (2), as determined by spectral analyses.
3.2. Instrumentation
Suitable crystals of 1 and 2 were selected for data collection, which was performed on a Bruker D8-QUEST diffractometer equipped with graphite-monochromatic Mo-Kα radiation ( λ = 0.71073 Å) at 296 K. The structures were solved by direct methods using SHELXS-9737 and refined by full-matrix least-squares methods on F2 using SHELXL-2013.38 All nonhydrogen atoms were refined with anisotropic parameters. The H atoms of water atoms were located in a difference map refined freely. The other H atoms were located from different
maps and then treated as riding atoms with C-H distances of 0.96 Å and O-H distances of 0.82 Å. The crystal of 1 used for data collection was rather thin (0.08 mm) and not very good in quality. Therefore, the R1 value (0.097) was not as desired. In crystal 1, the high residual electron densities (maxima and minima) and potassium cation center separations are 0.02 and 0.47 Å. A number of procedures were implemented in our analysis, and the data were corrected for absorption effects using the multiscan method. The following procedures were implemented in our analysis: data collection: Bruker APEX2;39 programs used for molecular graphics: MERCURY programs;40 software used to prepare material for publication: WinGX.41
The FT-IR spectra of crystals 1 and 2 were recorded at room temperature with a Bruker Optics Vertex 70 FT-IR Spectrometer having resolution of 2 cm−1 in the vibrational range of 4000–400 cm−1by KBr disk technique. The FT-Raman spectra of crystals 1 and 2 were recorded at room temperature with a Bruker Senterra dispersive Raman microscope using the 532-nm line of a 3B diode laser in the vibrational range of 4000–50 cm−1. The TG and DTG curves of crystals 1 and 2 were recorded in open air at a heating rate of 10 °C/min in the temperature range of 50–600 °C using platinum crucibles on a Hitachi STA 7300 thermal analyzer. Magnetic susceptibility measurements of crystals 1 and 2 were taken at room temperature using a Sherwood Scientific Magway MSB MK1 model magnetic balance by the Gouy method using Hg[Co(SCN)4] as the calibrant. At the same time, the temperature dependence of the magnetization value of crystal 1 was investigated experimentally by the MicroSense EV9 VSM in a magnetic field of H = 1 kOe in a temperature range of 243–373 K and ∆T = 5 K temperature step.
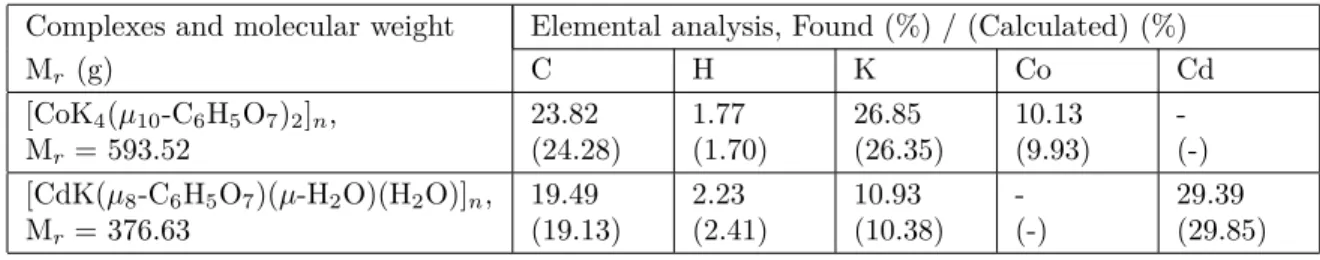
Newly produced crystals 1 and 2 were examined for their amounts of metals (K, Co, and Cd) with a PerkinElmer Optima 4300 DV ICPOES and for C and H amounts with a CHNS-932 (LECO) elemental analyzer. The results of experimentally obtained and theoretically calculated elemental analyses are given in Table 4 as a comparative example.
Table 4. Elemental analysis of crystals 1 and 2.
Complexes and molecular weight Elemental analysis, Found (%) / (Calculated) (%)
Mr (g) C H K Co Cd [CoK4(µ10-C6H5O7)2]n, Mr= 593.52 23.82 (24.28) 1.77 (1.70) 26.85 (26.35) 10.13 (9.93) -(-) [CdK(µ8-C6H5O7)(µ-H2O)(H2O)]n, Mr= 376.63 19.49 (19.13) 2.23 (2.41) 10.93 (10.38) -(-) 29.39 (29.85) Acknowledgments
The authors wish to thank in particular Dumlupınar University for the technical (Department of Physics and Chemistry) and financial support within the project numbered 2015/66. The authors also acknowledge the support of the Scientific and Technological Research Application and Research Center, Sinop University, Turkey, for the use of the Bruker D8 QUEST diffractometer. The authors are grateful to the Central Research Laboratory Application and Research Center (BÜMLAB), Bartın University, Turkey, for the use of the Hitachi STA 7300 thermal analyzer equipment.
References
1. Graham Solomons, T. W. Organic Chemistry (Special Topic M); John Wiley & Sons, Inc.: New York, NY, USA, 1996.
2. Apelblat, A. Citric Acid; Springer International Publishing: Basel, Switzerland, 2014.
3. Boling-Frankenbach, S. D.; Snow, J. L.; Parsons, C. M.; Baker, D. H. Poultry Sci . 2001, 80, 783-788. 4. Badii, F.; Howell, N. K. J. Agric. Food Chem. 2002, 50, 2053-2061.
5. Gul, Z.; Monga, M. Korean J. Urol. 2014, 55, 775-779.
6. Islam, K. M. ; Schaeublin, H.; Wenk, C.; Wanner, M.; Liesegang, A. J. Anim. Physiol. Anim. Nutr. (Berl.) 2012,
96, 808-817.
7. Penniston, K. L.; Nakada, S. Y.; Holmes, R. P.; Assimos, D. G. J. Endourol. 2008, 22, 567-570. 8. Wuana, R. A.; Okiemen, F. E.; Imborvungu, J. A. Int. J. Environ. Sci. Tech. 2010, 7, 485-496. 9. Kim, Y.; Koo, H. G.; Shin, D. H.; Park, L. O.; Lee, J. H. et al. J. Struct. Chem. 2010, 51, 382-385. 10. Che, P.; Fang, D. Q.; Zhang, D. P.; Feng, J. J. Coord. Chem. 2005, 58, 1581-1588.
11. Li, X. H.; Chen, W. L.; Wang, E. B. Acta Cryst. E 2009, 65, m183.
12. Lin, W. C.; Guo, W. G.; Wang, L. H.; Ma, X. L.; Xiang, S. C. et al. Chinese Struct. Chem. 2014, 33, 591-596. 13. Lensbouer, J. J.; Patel, A.; Sirianni, J. P.; Doyle, R. P. Am. Soc. Microbiol. 2008, 190, 5616-5623.
14. Bickley, R. I.; Edwards, H. G. M.; Gustar, R.; Rose, S. J. J. Mol. Struct. 1991, 246, 217-228.
15. Elbagerma, M. A.; Edwards, H. G. M.; Munshi, T.; Scowen, I. J. Cryst. Eng. Comm. 2011, 13, 1877-1884. 16. Lin, H. L.; Hsu, P. C.; Lin, S. Y. Asian J. Pharm. Sci. 2013, 8, 19- 7.
17. Ferreira, R. M.; Motta, M.; Batagin-Neto, A.; Frederico de Oliveira Graeff C.; Lisboa-Filho P. N. et al. Materials
Research 2014, 17, 550-556.
18. Bichara, L. C.; Lanús, H. E.; Ferrer, E. G.; Gramajo, M. B.; Brandan, S. A. Advances in Physical Chemistry 2011,
2011, 347072.
19. Liu, S. J.; Zeng, Y. F.; Hu, X.; Xue, L.; Han, S. D. et al. J. Solid State Chem. 2013, 204, 197-204. 20. Li, L.; Niu, S. Y.; Jin, J.; Meng, Q.; Chi, Y. X. et al. J. Solid State Chem. 2011, 184, 1279-1285. 21. Liu, R. B.; Zhang, J. J.; Tong, B. Z. Anorg. Allg. Chem. 2011, 637, 269-273.
22. Galloway, K. W.; Schmidtmann, M.; Sanchez-Benitez, J.; Kamenev, K. K.; Wernsdorfer, W. et al. Dalton Trans.
2010, 39, 4727-4729.
23. Matzapetakis, M.; Dakanali, M.; Raptopoulou, C. P. J. Biol. Inorg. Chem. 2000, 5, 469-474. 24. Zhou, Z. H.; Deng, Y. F.; Wan, H. L. Cryst. Growth Des. 2005, 5, 1109-1117.
25. Deng, Y. F.; Zhou, Z. H. J. Coord. Chem. 2009, 62, 778-788.
26. Xie, F. T.; Duan, L. M.; Chen, X. Y.; Cheng, P.; Xu, J. Q. et al. Inorg. Chem. Commun. 2005, 8, 274-277. 27. Dai, Y. M.; Cheng, J. K.; Zhang, J. J. Mol. Struct. 2005, 740, 223-227.
28. Guo, Y.; Lu, J.; Li, Y. J. Mol. Struct. 2006, 782, 44-48.
29. Zhang, G.; Yang, G.; Ma, J. S. Cryst. Growth Des. 2006, 6, 375-381. 30. Li, L.; Jin, J.; Shi, Z. L.; Zhao, L. Inorg. Chim. Acta 2010, 363, 748-754. 31. Kefalas, E. T.; Dakanali, M.; Panagiotidis, P. Inorg. Chem. 2005, 44, 4818-4828. 32. Tarakeshwar, P.; Manogaran, S. Spectrochim. Acta A 1994, 50, 2327-2343.
33. Nakamoto, K. Infrared and Raman Spectra of Inorganic and Coordination Compounds. Part B, Applications in
Coordination, Organometallic, and Bioinorganic Chemistry; John Wiley & Sons, Inc.: New York, NY, USA, 2009.
35. de Paola, R. A.; Hoffmann, F. M. J. Chem. Phys. 1987, 87, 1361-1366.
36. Eberhardt, W. (editor). Applications of Synchrotron Radiation: High-Resolution Studies of Molecules and Molecular
Adsorbates on Surfaces; Springer Science & Business Media: Berlin, Germany, 2012.
37. Sheldrick, G. M. Acta Cryst. 2008, A64, 112. 38. Sheldrick, G. M. Acta Cryst. 2015, C71, 3.
39. Bruker Inc. Bruker APEX2, (version 2014.11.0); Bruker AXS Inc.: Madison, WI, USA, 2014.
40. Macrae, C. F.; Bruno, I. J.; Chisholm, J. A.; Edgington, P. R.; McCabe, P. et al. J. Appl. Cryst. 2008, 41, 466-470. 41. Farrugia, L. J. J. Appl. Cryst. 2012, 45, 849-854.
Supplementary material
Crystallographic data for the structural analysis have been deposited with the Cambridge Crystallographic Data Centre, CCDC No. 1520235 for 1 and 1520236 for 2. Copies of this information may be obtained free of charge from the Director, CCDC, 12 Union Road, Cambridge CB2 1EZ, UK (fax: +44-1223-336033; e-mail: [email protected] or www: http://www.ccdc.cam.ac.uk).
![Figure 1. The molecular structure of crystal 1 showing the atom numbering scheme [(v) − x + 1, −y + 1, −z + 1].](https://thumb-eu.123doks.com/thumbv2/9libnet/4382391.74022/2.918.112.531.609.883/figure-molecular-structure-crystal-showing-atom-numbering-scheme.webp)