https://doi.org/10.33904/ejfe.843889 © Copyright 2020 by Forest Engineering and Technologies Platform on-line at www.http://dergipark.gov.tr/ejfe
* This work has been partially presented in Ecology2020 Symposium
**Author: Tel: +90 224 3003430 E-mail: inanç[email protected]
Received 20 December 2020; Accepted 28 December 2020 This work is licensed under a Creative Commons Attribution-NonCommercial 4.0 International License 87
Abstract
To use the resources allocated for firefighting in an optimum way, it is important to reach fire sites within the critical response time (CRT) and determine regions with high fire risk. This study aimed to evaluate forests that can be reached within CRT using GIS techniques, regarding fire risk levels. The study area is selected from Yeniköy Forest Enterprise Chief, which is in Bursa Regional Directorate of Forestry and located in second-degree fire-sensitive zone. The accessible forests within CRT were determined using the "Network Analyst" method in ArcGIS 10.4 software. Then, a fire risk map was developed using the AHP (Analytic Hierarchy Process) tool (ExtAHP 2.0) in ArcGIS 10.4. The results showed that the firefighting team near the study area can reach 24.25% of forests within CRT for the second-degree fire-sensitive areas (30 minutes). Besides, it was determined that 46.86% of forests can be reached in 40 minutes and 84.31% in one hour. It was found that 85% of forests were in a very high and high fire risk zones. It was determined that 42% of forests that could not be reached within CRT was in a very high fire risk zones while 43.45% was in a high fire risk zone.
Keywords: Forest fires, fire risk, network analysis, shortest path, AHP
1. Introduction
The pressure on forests, one of the renewable natural resources, has increased significantly in the last century. The most prominent reflection of this pressure on forest resources is forest fires (Ertuğrul, 2005). Forest fires, which are estimated to be about 95% human-caused, seriously damage forests, affect the sustainability of forest resources and cause significant biological and ecological damages on vegetation (Bilici, 2008). In order to fight forest fires effectively, it is necessary to respond to the fire as soon as possible. For this reason, it is of great importance to locate the forest fires when they start and to inform the first responders without delay (Çanakçıoğlu, 1993).
After receiving a fire notification, the optimum route that will enable the firefighting team to move with the firetruck from the fire station to reach the fire site within the critical response time should be determined in real-time. Critical response time varies according to the fire sensitivity level (Akay et al., 2012). The network analysis method is widely used in the solution of transportation problems aiming to determine the optimum route. Integrating advanced technologies into every stage of firefighting is of increasing importance in terms of efficient use of scarce resources (Kucuk and Bilgili, 2006). Developments in computer technology and Geographic Information Systems (GIS) enable the
use of GIS software modules based on the network analysis method in solving transportation problems.
It is essential to identify high fire risk areas and map them according to their risk levels in order to combat fire effectively. In recent years, GIS techniques have been integrated with Multi-Criteria Decision Making Analysis (MCDA) to provide a fast and effective method for fire risk mapping (Carmel et al., 2009; Vandeeru, et al., 2010; Eskandari, 2017). Analytical Hierarchy Process (AHP) is one of the most common MCDA methods used to solve complex spatial problems in forestry (Akay and Erdoğan, 2017; Çoban and Erdin, 2020). Fire risk is the possibility of new fire to start, depending on the presence and effect of the factors that caused the fire to start. In addition to topographical features such as slope and aspect, vegetation features such as tree type, stand age (stage) and canopy have strong effects on fire risk (Çanakçıoğlu, 1993). The slope, which shows the roughness of the land in forest fires, is of great importance in the spread of fires. As it is known, the higher the slope, the faster the fire spreads (Akay and Şahin, 2019). Fire conditions vary greatly depending on the landscape. Generally, the south and southeast views have the best conditions for the fire to start and spread. These places get more direct sunlight and increase the temperature and the flammable substance (Akay and Erdoğan, 2017).
Using GIS Techniques for Assessment of Accessible Forest Lands by Firefighting
Teams Considering Fire Risk Degrees
*Abdullah E. Akay , İnanç Taş **
88 Regarding forest fires, tree species appear to be one
of the most important factors affecting the fire risk, especially in terms of the humidity they carry. Low-moisture and high-burning resin trees such as Brutian pine carry a high risk of fire because they can ignite quickly, and broad-leaved species with high moisture value such as beech are resistant to fire since they will ignite late (Akay and Erdoğan, 2017).
The crown closure of the forest is also critical in terms of fire. It has an important effect on fires, especially when considered together with the tree stage of trees. Since forests consisting of individuals in the young age with 70% and above cover, they have high density in terms of easily ignited fine flammable material, causing fires to turn into hill fires and spread rapidly. In addition, it is difficult for the fire to peak and progress in forests that are less than 40% covered in over mature stand (Çanakçıoğlu, 1993).
In this study, a fire risk map was generated in the light of criteria such as tree type, ages, crown closure, slope and aspect. In the solution process, the factors affecting the forest fire risk were analyzed using GIS techniques and the AHP method. Then, using GIS techniques, it was aimed to evaluate the forest areas that can be reached within the critical response time by firefighting team according to the fire risk levels.
2. Material and Methods 2.1. Study Area
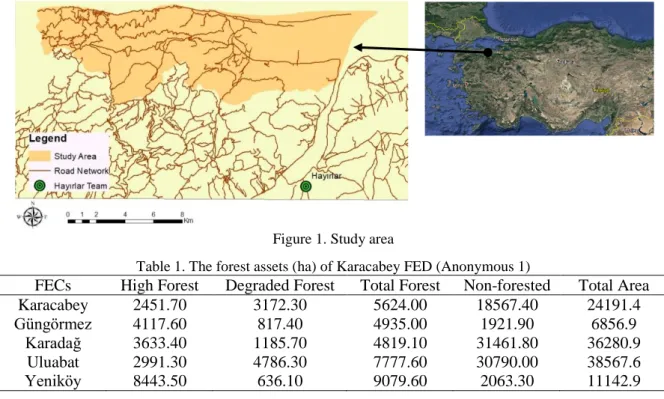
Yeniköy Forest Enterprise Chief (FEC) located on the border of the Karacabey Forest Enterprise Directorate (FED) in Bursa Regional Directorate of Forestry was selected as the study area (Figure 1). FED has forest areas that are second degree sensitive to the forest fire. The forest assets in the FED are given in Table 1. Common tree species in the study area are ash, oak, alder, chestnut and poplar, and there are stone pine and black pine within the territorial forest boundaries. There is a firefighting team (Hayırlar Team) near the work area. 2.2. GIS Database
Contour map, topographic map and management map obtained from the FED were used for the GIS database. First, the digital elevation model (DEM) (10 m) was produced by using the contour lines. Slope and aspect maps (10 m x 10 m) were obtained using this DEM. The road map was produced by using the topographic map of the study area. The roads around the study area were also included in the road map, taking into account the location of the firefighting team in the field. Then, land use type, tree type, stage, and crown closure maps were obtained by using the management map. Finally, a data layer showing the forests was generated to be used for forming the border of all other maps.
Figure 1. Study area
Table 1. The forest assets (ha) of Karacabey FED (Anonymous 1)
FECs High Forest Degraded Forest Total Forest Non-forested Total Area
Karacabey 2451.70 3172.30 5624.00 18567.40 24191.4
Güngörmez 4117.60 817.40 4935.00 1921.90 6856.9
Karadağ 3633.40 1185.70 4819.10 31461.80 36280.9
Uluabat 2991.30 4786.30 7777.60 30790.00 38567.6
Yeniköy 8443.50 636.10 9079.60 2063.30 11142.9
2.3. Fire Risk Analysis
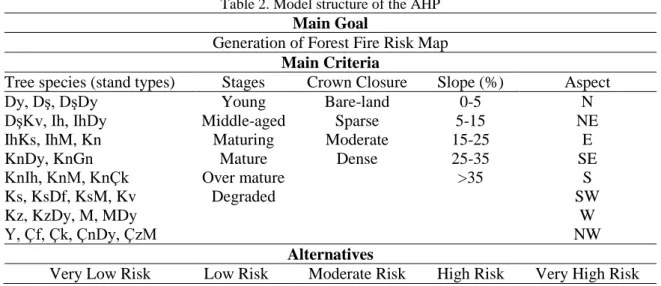
Fire risk analysis was performed in ArcGIS 10.4 using the AHP. In the process, data layers belonging to the risk factors produced for the Yeniköy FEC were taken as basis. Each set of components that make up the hierarchical structure in the AHP methodology defines a different hierarchy level (Saaty, 1977). At the top level of the structure, there is the main purpose, below it the criteria and sub-criteria that enable reaching the goal, and
at the lowest level there are alternatives. In this study, tree species (stand type), stand stages, crown closure, slope and aspect are evaluated as the main criteria. In the study, in order to determine the fire risk levels of forest areas, five risk groups were taken into consideration, starting from the areas with the lowest fire risk to the areas with the highest risk. Table 2 shows the structure of the AHP method.
89 Table 2. Model structure of the AHP
Main Goal
Generation of Forest Fire Risk Map Main Criteria
Tree species (stand types) Stages Crown Closure Slope (%) Aspect
Dy, Dş, DşDy DşKv, Ih, IhDy IhKs, IhM, Kn KnDy, KnGn KnIh, KnM, KnÇk Ks, KsDf, KsM, Kv Kz, KzDy, M, MDy Y, Çf, Çk, ÇnDy, ÇzM Young Middle-aged Maturing Mature Over mature Degraded Bare-land Sparse Moderate Dense 0-5 5-15 15-25 25-35 >35 N NE E SE S SW W NW Alternatives
Very Low Risk Low Risk Moderate Risk High Risk Very High Risk
The degree of influence caused by components of any level in the hierarchical structure on other components was determined by binary comparisons between criteria. Relative importance scale is used to express the significance levels of the criteria numerically in binary comparisons. In this study, the relative importance scale 1-9, which is widely used by researchers and gives good results, was preferred (Saaty, 1977) (Table 3).
Pairwise comparisons are made by the opinions of the expert person or persons on the subject of study. Decision-makers in the AHP studies can be a single person or may consist of more than one person (Özden, 2008). In case more than one person is the decision-maker, removing a single provision from all preferences has some drawbacks in terms of consistency. In this study, paired comparisons were made by a single decision-maker, based on the results of empirical studies demonstrating the effects of the criteria on fire risk, since it is easier to make decisions when there is only one decision-maker and gives more consistent results. The realism of the binary comparisons made by the decision-maker is evaluated by calculating the consistency ratio (CR - Consistency Ratio). A CR value less than 0.10 indicates that the decision-maker is consistent, while a value greater than 0.10 indicates the inconsistency of the decision-maker. Finally, the relative importance values of the alternatives in terms of general purpose were determined in AHP. In the decision phase, the fire risk level was determined by comparing the relative
importance values of the alternatives. At the last stage, "ExtAhp 2.0", which works as an extension in ArcGIS 10.4 environment, was used to create a fire risk map. 2.4. Network Analysis
In order to determine the optimum route that will provide access to the fire field as soon as possible, the average transportation time to be used by the vehicle (firetrucks carrying the firefighting team) on each road section should be determined. Transportation time can be calculated depending on the length of the road and the average speed of the vehicle. Average vehicle speed varies mainly depending on the type of road. Thus, attribute fields titled length (km), road type, vehicle speed (km / hour) and transportation time (minutes) were generated for each road section in the Attribute Table of the road data layer.
Road types were classified under four groups, depending on the current information on the study area, as asphalt paved road, gravel road, forest road (B-Type secondary forest road) and tractor road. In determining the average vehicle speeds, information recommended by Bilici (2008) and Traffic Inspection Branch Directorate were taken into consideration. In the light of this information, average vehicle speeds for asphalt, gravel, forest road and tractor road were determined as 15, 30, 50 and 60 km/h, respectively. Then, the transportation time for each section was calculated based on vehicle speed and road length.
Table 3. The relative importance values Importance Scale Description
1 Equal importance
3 Weak importance of one over another
5 Essential or strong importance
7 Demonstrated importance
9 Absolute importance
2, 4, 6, 8 Intermediate values between the two adjacent judgments
90 After the road network data layer containing the value
(transportation time) of each road segment was completed, Network Dataset (ND) was developed in ArcGIS 10.4 and then link (ND_Edges) and node (ND_Junctions) files were produced. The New Service Area methods under the Network Analyst were applied. In the New Service Area method, which is similar to the Buffer Analysis method as its working principle, a service point determined on the network system is accepted as the beginning and the regions remaining within a total link value (transportation time) determined by the user are determined on the network system.
In this study, it was aimed to determine the forest areas that can be reached within critical response times by taking the location of the current firefighting team as the center with the New Service Area method. Since the Yeniköy FEC consists of secondary fire-sensitive areas, 30 minutes were considered as critical response times (Akay et al., 2012). Forest areas that can be reached in
40 minutes and one hour were also identified in the study.
3.3. Results and Discussion 3.1. GIS Database
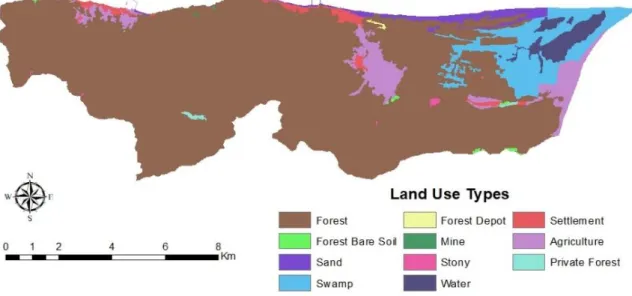
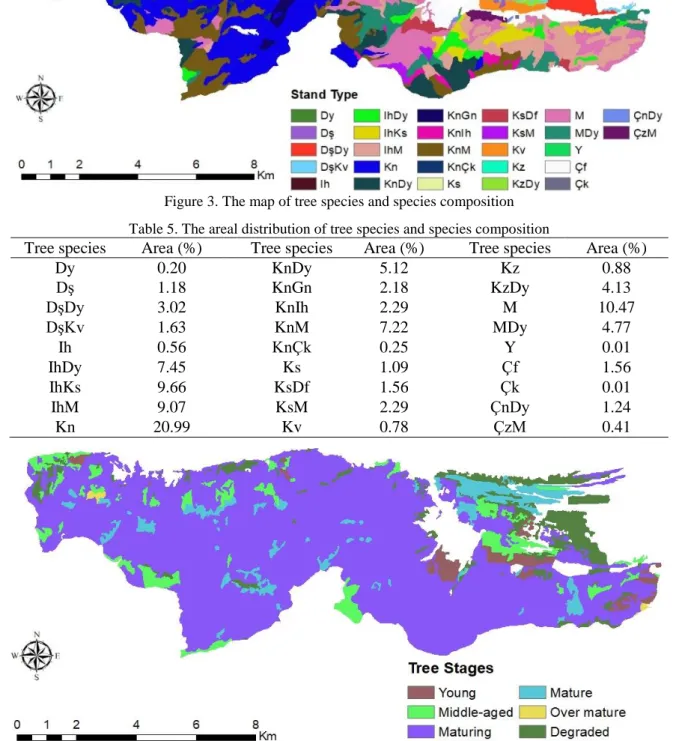
Land use types were classified using the digital stand map of the Yeniköy FEC and a data layer showing the forest areas was produced (Figure 2). Spatial information on land use types is given in Table 4. It has been determined that 81.77% of the study area was forest areas. There are 27 species and species composition in the forest area in terms of tree species (Figure 3). The most common plant species are beech (20.99%), followed by Oak (10.47%) and Linden-Chestnut composition (9.66%) (Table 5). In the study, a map of the stand stages was produced by using the digital stand map (Figure 4). According to the results, the most common stage was maturing (76.52%), followed by middle-aged (6.77%) and mature (6.08%) (Table 6).
Figure 2. Land-use type map
Table 4. The areal distribution of land-use types
Land use types Area (%)
Forest 81.34
Forest bare soil 0.20
Sand 1.93 Swamp 7.30 Forest depot 0.06 Mine 0.03 Stony 0.11 Water 2.23 Settlement 1.44 Agriculture 5.19 Private forest 0.18
91 Figure 3. The map of tree species and species composition
Table 5. The areal distribution of tree species and species composition
Tree species Area (%) Tree species Area (%) Tree species Area (%)
Dy 0.20 KnDy 5.12 Kz 0.88 Dş 1.18 KnGn 2.18 KzDy 4.13 DşDy 3.02 KnIh 2.29 M 10.47 DşKv 1.63 KnM 7.22 MDy 4.77 Ih 0.56 KnÇk 0.25 Y 0.01 IhDy 7.45 Ks 1.09 Çf 1.56 IhKs 9.66 KsDf 1.56 Çk 0.01 IhM 9.07 KsM 2.29 ÇnDy 1.24 Kn 20.99 Kv 0.78 ÇzM 0.41
Figure 4. The map of tree stages Table 6. The areal distribution of tree stages
Stages Area (%) Young 2.90 Middle-aged 6.77 Maturing 76.52 Mature 6.08 Over mature 0.23 Degraded 7.49
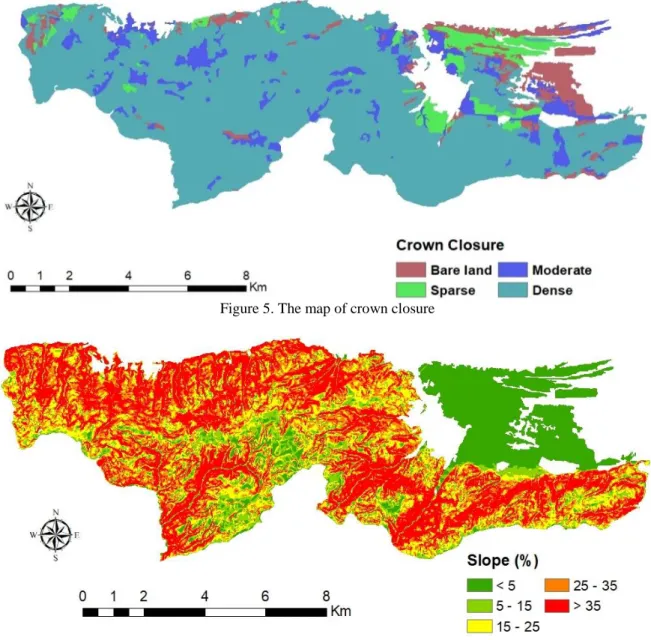
The crown closure map was produced with the data obtained from the digital stand map (Figure 5). According to the results, it has been determined that 76.7% of the forest areas within the scope of the study area consisted of dense closure, while 10.14% was moderate closed, 5.67% was sparse and 7.49% was bare-land. SAM of the study area was produced and then the slope map was developed (Figure 6). The average elevation and slope of forest areas were 309 m and 27.59%, respectively. According to the aspect map, the forest areas were generally north oriented.
92 Figure 5. The map of crown closure
Figure 6. The slope map 3.2. Fire Risk Map
In this study, in which fire risk analysis was made with the AHP approach, the tree species data layer was first evaluated. It was divided into five classes considering their resistance to forest fires. These classes according to their importance are given in Table 7. It was observed that the risk of fire increased from broad-leaved trees to coniferous tree species. In previous studies, it was stated that coniferous tree species such as Brutian pine have a high risk of fire, and broad-leaved species such as beech are more resistant to fire (Kodandapani et al., 2009; Akay and Şahin, 2019). In order to evaluate
stand stages, one of the fire risk factors, the tree stage data layer was developed (Table 8). In terms of tree stages, it was observed that the risk of fire increased from young to the maturing stage, then the risk decreased until the over mature stage. Stand crown closure data layer of the study area was produced according to four classes whose importance levels were determined with the AHP approach (Table 9). Results showed that the more the stand was closed, the higher the risk to fire. In previous studies, it was stated that the higher the closure, the higher the risk of fire (Çanakçıoğlu, 1993).
Table 7. The importance level for potential fire risk based on tree species
Tree species Importance levels
Dş, Ih, Kn, KnÇk, Ks, KsM, Kv, Kz, M 0.02
Dy, DşDy, DşKv, IhDy, IhKs, IhM, KnDy, KnGn, KnIh, KnM KsDf, KzDy, MDy, ÇnDy
0.03
ÇzM 0.07
Çf, Çk 0.08
93 Table 8. The importance level for potential fire risk based on
tree stages
Stages Importance levels
Young 0.27
Middle-aged 0.31
Maturing 0.23
Mature 0.12
Over mature 0.04
Table 9. The importance level for potential fire risk based on crown closure
Crown Closure Importance levels
Bare-land 0.09
Sparse 0.18
Moderate 0.32
Dense 0.41
In order to evaluate the slope and aspect among fire risk factors, the relevant data layers were classified according to the AHP methods (Tables 10 and Table 11). Considering the importance of the slope classes, it was determined that the higher the slope of the land, the higher the fire risk (Jaiswal et al., 2002; Sivrikaya et al., 2011). It was observed that the south and southwest aspects had the highest values, while the northern aspects had the lowest values. According to the literature, south, southeast and southwest aspects had more suitable conditions for the fire (Lin and Sergio, 2009).
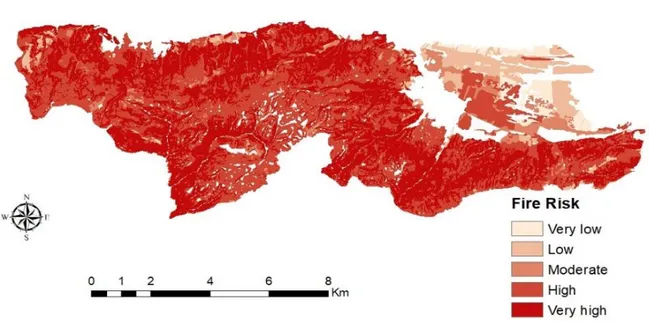
In the last stage, "ExtAHP 2.0" was used in ArcGIS 10.4 to generate a fire risk map by combining the weighted averages of the criteria (Table 12, 13, Figure 7). It was determined that the most effective criterion on forest fire was the tree species, followed by the stand stages. While the crown closure and slope had a similar effect on fire risk, the aspect had a relatively low effect on forest fire risk. It was found that 42.80% of the area was at high fire risk, while 42.52% was very high risk.
Table 10. The importance level for potential fire risk based on the ground slope
Slope (%) Importance levels
0-5 0.04
5-15 0.12
15-25 0.20
25-35 0.28
>35 0.36
Table 11. The importance level for potential fire risk based on the aspect
Aspect Importance levels
N 0.05
NE, E, NW, W 0.09
SE 0.14
S, SW 0.20
Table 12. The importance level of fire risk factors used in the study
Criteria Importance levels
Tree species 0.28
Stages 0.22
Crown closure 0.19
Slope 0.19
Aspect 0.13
Table 13. The areal distribution of fire risk levels in the study area
Fire risk Area (%)
Very low 2.79
Low 6.39
Moderate 5.50
High 42.80
Very high 42.52
94 3.3. Network Analysis Results
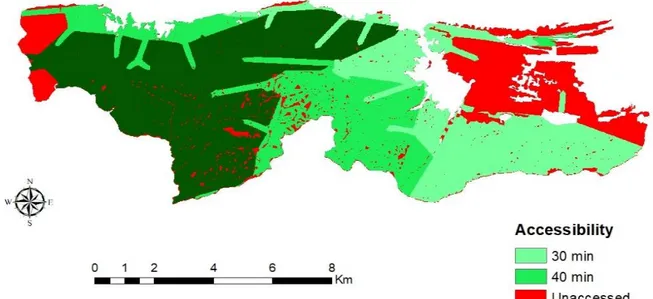
In ArcGIS 10.4, under the Network Analyst plug-in, using the New Service Area method, the location of the firefighting team was taken as the center, and the forest areas that can be reached in the study area within the critical response time (30 minutes) were determined. In addition, the areas where the firefighting team can be reached on the road network in 40 minutes and one hour were determined (Figure 8). According to the results, the firefighting team deployed near the study area can reach 24.25% of the forest areas in the study area within 30 minutes determined for areas susceptible to second-degree fire. In addition, it was determined that 46.86% of forest areas can be reached in 40 minutes and 84.31%
in one hour. Later, the fire risk map developed with the AHP approach and the service areas of the first responders were overlapped, and the distribution of the forest areas that the teams could reach within the specified time was determined according to the fire risk (Table 14). Results showed that 42% of the forests that could not be reached during the critical response time had a very high fire risk and 43.45% had a high fire risk. These rates were found to be 40.16% and 41.39% for the 40-minute period, respectively. For the one-hour period, these rates decreased to 12.20% and 32.11%, respectively.
Figure 8. The accessible forest areas within 30 min, 40 min, and one hour Table 14. The accessible forest areas within specified times (%)
Fire risk 30 min 40 min One hour
Accessible Inaccessible Accessible Inaccessible Accessible Inaccessible
Very low 9,78 90,22 7,58 92,42 7,62 92,38 Low 27,46 72,54 34,67 65,33 36,70 63,30 Moderate 30,80 69,20 44,53 55,47 61,55 38,45 High 23,56 76,44 48,61 51,39 88,23 11,77 Very high 25,62 74,38 49,82 50,18 95,50 4,50 4. Conclusion
In this study, GIS techniques and the AHP method were integrated in order to carry out the organization and planning of combating forest fires at an optimum level. Yeniköy FEC within the body of Karacabey FED affiliated to Bursa Regional Directorate of Forestry was chosen as the study area. In the study, firstly, fire risk analysis was made with the AHP approach. It was determined that the most influential factor among the risk factors considered during the analysis was the tree species, followed by stand stages. Then, a risk map was produced in the light of the criteria such as tree species, stages, crown closure, slope and aspect considered at this
stage. Accordingly, it was found that 85% of the study area had a very high and high fire risk. In the study, forest areas that can be reached during the critical response time by the firefighting stationed near the study area using GIS techniques were evaluated according to their fire risk degrees. The results showed that the firefighting team could reach 24.25% of the forest areas in the study area within 30 minutes. As a result, it was revealed that areas with forest fire risk can be predicted quickly and effectively with the GIS-based the AHP method. In future studies on this subject, it would be appropriate to consider fire towers and fire pools.
95 Ethics Committee Approval: N/A.
Peer-review: Externally peer-reviewed.
Author Contributions: Concept: A.E.A; Design: A.E.A. and İ.T.; Supervision: A.E.A.; Resources: A.E.A. and İ.T.; Data Collection: A.E.A. and İ.T.; Analysis: A.E.A.; Literature Search: A.E.A. and İ.T.; Writing Manuscript: A.E.A.; Critical Review: A.E.A.
Conflict of Interest: The authors have no conflicts of interest to declare.
Financial Disclosure: The authors declared that this study has received no financial support
Cite this paper as: Akay, A.E., Taş, İ., 2020. Using GIS Techniques for Assessment of Accessible Forest Lands by Firefighting Teams Considering Fire Risk Degrees.
European Journal of Forest Engineering, 6(2): 87-95
References
Anonymous 1. The area (ha) distribution of forest assets of FECs in Karacabey FED. Karacabey FED, Bursa.
https://bursaobm.ogm.gov.tr/KaracabeyOIM/Lists/O
rmanVarligi/AllItems.aspx (Access Date: 15
September 2020)
Akay, A.E., Şahin, H., 2019. Forest Fire Risk Mapping by using GIS Techniques and AHP Method: A Case Study in Bodrum (Turkey). European Journal of
Forest Engineering, 5(1):25-35.
Akay, A.E., Erdoğan, A., 2017. GIS-based Multi-criteria Decision Analysis for Forest Fire Risk Mapping. ISPRS Annals of the Photogrammetry, Remote Sensing and Spatial Information Sciences, Volume IV-4/W4, 2017, 4th International GeoAdvances
Workshop, Safranbolu, Karabuk, Turkey: October
14-15.
Akay, A.E., Wing, G.M., Sivrikaya, F., Sakar, D., 2012. A GIS-based decision support system for determining the shortest and safest route to forest fires: a case study in Mediterranean Region of Turkey,
Environmental Monitoring and Assessment,
184(3):1391-1407.
Bilici, E., 2009. A Study on the Integration of Firebreaks and Fireline with Forest Roads Networks and It's Planning and Construction (A Case Study of Gallipoly National Park) Istanbul University. Faculty
of Forestry Journal Series: A 59(2):86-102.
Carmel, Y., Paz, S., Jahashan, F., Shoshany, M., 2009. Assessing fire risk using Monte Carlo simulations of fire spread. Forest Ecol. Manag. 257(1):370-377. Çanakçıoğlu, H., 1993. “Forest Protection”. İstanbul:
Istanbul University Publications.
Çoban, H.O., Erdin, C., 2020. Forest fire risk assessment using GIS and AHP integration in Bucak Forest Enterprise, Turkey. Applied Ecology and Environmental Research, 18(1):1567-1583.
Ertugrul, M., 2005. The Situations of Forest Fires in the World and in Turkey. ZKU Bartın Faculty of Forestry
Journal, 7(7):43-50.
Eskandari, S., 2017. A new approach for forest fire risk modeling using fuzzy AHP and GIS in Hyrcanian forests of Iran. Arabian Journal of Geosciences, 10(190): 1-13.
Jaiswal, R.K., Mukherjee, S., Raju, D.K., Saxena, R., 2002. Forest fire risk zone mapping from satellite imagery and GIS. International Journal of Applied
Earth Observation and Geoinformation,
4(2002):1-10.
Kodandapani, N., Cochrane, M. A., Sukumar, R., 2009. Forest fire regimes and theirnecological effects in seasonally dry tropical ecosystems in the Western Ghats, India. – In: Cochrane, M. A. (ed.) Tropical Fire Ecology: Climate change, Land use and Ecosystem Dynamics. Springer Praxis Books, 335-354.
Kucuk O, Bilgili E., 2006. The conveyance of fire behavior characteristics into practice by using Geographical Information Systems (GIS): A Case Study in Kastamonu. Gazi University. Faculty of
Forestry Journal, 6(2):262-273.
Lin, J., Sergio, R., 2009. A derivation of the statistical characteristics of forest fires. Ecological Modelling, 220:898-903.
Özden, Ü.H., 2008. Choosing primary school with Analytical Hierarchy Process. Marmara University,
İ.İ.B.F. Journal, 24(1):299-320.
Saaty, T.L., 1977. A scaling method for priorities in hierarchical structures. Journal of mathematical
psychology, 15(3):234-281.
Sivrikaya, F., Akay, A. E., Oğuz, H., Yenilmez, N., 2011. Mapping Forest Fire Danger Zones Using GIS:
A Case Study from Kahramanmaraş. 6th
International Symposium on Ecology and
Environmental Problems. 17-20 November, Antalya.
Vadrevu, K. P., Eaturu, A., Badarinath, K.V.S., 2010. Fire risk evaluation using multicriteria analysis-a case study. Environment Monitoring and Assessment, 166: 223-239.