DETERMINANTS OF HOUSE PRICES IN TURKEY:
A HEDONIC REGRESSION MODEL
TÜRKİYE’DE KONUT FİYATLARININ BELİRLEYİCİLERİ: HEDONİK REGRESYON MODELİ
Sibel SELİM
Celal Bayar Üniversitesi, İ.İ.B.F., İşletme Bölümü
ABSTRACT: In real estate valuation and house market research, house prices and rental value are generally analyzed by hedonic model based on micro economic theory. Hedonic model examines the effect of characteristics of goods on their prices. Factors that determine the house prices in Turkey are analyzed in this paper using 2004 Household Budget Survey Data. The most important variables that affect house rents are type of house, type of building, number of rooms, size, and other structural characteristics such as water system, pool, natural gas.
Keywords: House price, Hedonic regression model, Turkey.
ÖZET: Emlak değerlemede ve konut piyasası araştırmalarında konutun piyasa değeri genellikle mikro ekonomik teoriye dayanan hedonik model yoluyla analiz edilmektedir. Hedonik model, bir malın özelliklerinin fiyat üzerindeki etkisini incelemektedir. Bu çalışmada Türkiye’de konut fiyatlarını belirleyen faktörler 2004 Hanehalkı Bütçe Anketi kullanılarak analiz edilmiştir. Konut fiyatlarını etkileyen en önemli değişkenler konutun tipi, yapı türü, oda sayısı konutun büyüklüğü ve diğer yapısal değişkenlerden konutun su sistemi, havuz, doğal gaza sahip olmasıdır.
Anahtar kelimeler: Konut fiyatı, Hedonik regresyon model, Türkiye.
1. Introduction
For many households, owner-occupied houses do not only offer an alternative for a place to live in. They represent the most important chunk of assets in these household’s portfolio. Indeed, in most industrialized countries real estate is the greatest component of private households’ wealth. As a consequence, the value of their house has a major impact on households’ consumption and savings opportunities (Case et al., 2004). House prices are therefore of great interest to real estate developers, banks, policy makers or, in short, the general public as well as to actual and potential home owners (Schulz and Werwatz, 2004).
The housing market is defined as one where housing services are allocated by the mechanism of supply and demand. One of the characteristics of the housing market that is different from markets of goods and services is the inelasticity of housing supply. Housing services are one of the most expensive household expenditures. Changing housing prices have been of concern to both individuals and governments in that they influence socio-economic conditions and have a further impact on national economic conditions. Expectations of capital gains from housing investments would affect housing prices by increasing the demand for housing; which in turn, would cause high volatility in housing prices. This causes increases in housing prices since the supply of housing cannot adjust in the short run. The
housing market can be influenced by macro-economic variables, spatial differences, characteristics of community structure, and environmental amenities (Kim and Park, 2005).
The valuation of real estate is required to provide a quantitative measure of the benefit and liabilities accruing from the ownership of the real estate. Valuations are required, and often carried out, by a number of different players in the marketplace such as real estate agents, appraisers, assessors, mortgage lenders, brokers, property developers, investors and fund managers, lenders, market researchers and analysts and other specialists and consultants. Market value is estimated through the application of valuation methods and procedures that reflect the nature of property and the circumstances under which the given property would most likely trade in the open market (Pagourtzi et al., 2003). Numerous methods are available to estimate market value in the literature. Pagourtzi et al. (2003) classify these methods into two categories: traditional and advanced. It is stated in the paper that, the majority of all methods will rely upon some form of comparison to assess market value, and this may be done, in its simplest form, by direct capital comparison or may rely upon a range of observations that allow determining a regression model. Any such method in their paper is referred to as ‘traditional’. Other models or methods that try to analyze the market by mimicking the thought processes of the players in the market in an attempt to estimate the point of exchange are referred to as ‘advanced’. Herein, the traditional valuation methods are comparable method, investment/income method, profit method, development/residual method, contractor’s method/cost method, multiple regression method and stepwise regression method. On the other hand, the advanced valuation methods are Artificial Neural Networks (ANN), hedonic pricing method, spatial analysis methods, fuzzy logic and autoregressive integrated moving average. In this paper, we employ hedonic pricing method in our analysis.
In property valuation and housing market research, the locational value is usually analyzed by hedonic methods that use multiple regression techniques on large data sets and require a formality based on microeconomic theory in the analyses. Hedonic methodology is mainly used for market valuation of goods for their utility-bearing characteristics. The goods under consideration embody varying amounts of attributes and are differentiated by the particular attribute composition that they possess. In most cases, the attributes themselves are not explicitly traded, so that one can not observe the prices of these attributes directly. In such a case, hedonic pricing models are very essential in order to determine how the price of a unit of commodity varies with the set of attributes it possesses. If the prices of these attributes are known, or can be estimated, and the attribute composition of a particular differentiated good is also known, hedonic methodology will provide a framework for value estimation (Ustaoğlu, 2003).
In this paper, determinants of house prices in Turkey are examined for the urban, rural and whole country using 2004 Household Budget Survey Data. Previous research dealing with house market in Turkey using hedonic price model includes local house price analysis (see e.g. Temurlenk and Özçelik, 2003; Ustaoğlu, 2003, Özus and Dökmeci, 2006, Kesbiç et al. 2007). However, this study presents an analysis for the whole Turkey, and provides important findings on the determinants of house prices in Turkey.
The remainder of the paper is organized as follows. Section 2 presents hedonic price model. Section 3 reviews the literature that employs hedonic regression model for real estate valuation. The data and functional form are introduced in Section 4. Section 5 reports the estimation results obtained by the hedonic regression model. Finally, we present some concluding remarks in section 6.
2. Hedonic Price Model
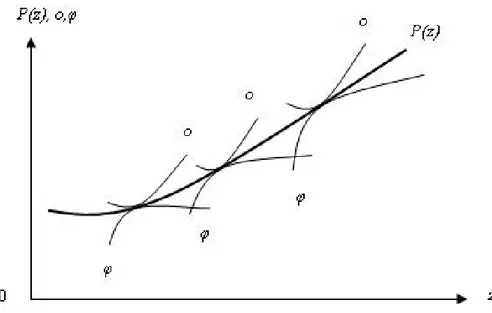
The term hedonic was used to describe “the weighting of the relative importance of various components among others in constructing an index of usefulness and desirability” (Goodman, 1998: 292). Rosen (1974: 34) defines hedonic prices as “the implicit prices of attributes and are revealed to economic agents from observed prices of differentiated products and the specific amounts of characteristics associated with them” (Ustaoğlu, 2003). Rosen (1974), comprehensively laid down a theoretical foundation for determining the bid price, or implicit value of the attributes of a commodity for different consumers. The bid price (φ) is defined as the maximum amount of money which a consumer is willing to pay for a good under the condition that he or she retains a specific level of happiness or utility. He proposed to utilize the information from the tangent of the market price curve with which the consumers or producers share the same value of the equilibrium conditions. The methods used to identify the consumer’s bid price function and the producer’s offer function (o) were fully discussed him. The offer function is defined as a function to determine the minimum value of price which a producer should accept to sell a good for a certain profit. The relationship among market price, bid price and offer functions are shown in Figure 1 (Hidano, 2002: 10).
Figure 1. Hedonic Price Function (Hidano, 2002)
As stated above, the theory of hedonic price functions provides a framework for the analysis of differentiated goods like housing units, whose individual features do not have observable market prices. The traditional use of hedonic estimation in housing studies has been for the purpose of making inferences about non-observable values
of different attributes like air quality, airport noise, commuter access (railway, subway or highway) and neighborhood amenities (Janssen et al. 2001).
Over the past three decades, the hedonic-based regression approach has been utilized extensively in the housing market literature to investigate the relationship between house prices and housing characteristics. The primary reasons for such extensive application are analyzing household demand for these characteristics as well as constructing housing price indices (see, for example, Can, 1992; Sheppard, 1999). However, this approach is subject to criticisms arising from potential problems relating to fundamental model assumptions and estimation such as the identification of supply and demand, market disequilibrium, the selection of independent variables, the choice of functional form of hedonic equation and market segmentation. These problems have been of great concern in the literature (see Sheppard, 1999; Malpezzi, 2003, Fan et al., 2006).
Most of the price studies are conducted with hedonic modeling and other methods based on multiple regression analysis. Basically, these methods are appropriate to a straightforward estimation of the relationship between price and the various characteristics. However, these techniques might become problematic if the agenda of the appraisal is widened to include aspects such as outliers, nonlinearity, spatial and other kind of dependence between observations, discontinuity, and fuzziness. There are, however, some plausible alternatives, one being the use of neural networks, which are better suited to deal with these aspects. The neural network is, in fact, an example of a flexible regression approach. These types of methods are basically different from the standard methods. Specifically, they allow for a broader range of variation in the output than the hedonic regression model, with its spatial extensions. However, it is not clear how the coefficients in the model vary in space, and there is no straightforward functional relationship between the input and output values (Kauko, 2003).
3. Literature Review
In this section, a review on the literature that employs hedonic regression model for real estate valuation is presented.
Hedonic price model is based on Lancaster (1966)’s consumer theory. Since this theory has been extended to the residential market by Rosen (1974), residential hedonic analysis has become widely used as an assessment tool and for property market and urban analysis. The regression of house prices on a variety of property specific and neighborhood descriptors evaluates their marginal contribution, also called implicit or hedonic prices. A comprehensive treatment of hedonic price theory is provided by Rosen (1974). A theory of hedonic prices is formulated as a problem in the economics of spatial equilibrium in which the entire set of implicit prices guides both consumer and producer locational decisions in characteristics space. Residential housing is an important aspect of quality of life in any community. Therefore, appropriate valuation of specific characteristics of a residential house is in order. To achieve this objective, empirical researchers often specify hedonic price functions or hedonic models (Ogwang and Wang, 2003). Among the researches, Adair et al. (2000) focuses upon factors affecting the price structure of residential property in the Belfast Urban Area, examining the relative influence of property
characteristics, socio-economic factors and the impact of accessibility. The analysis highlights the importance of investigation at a sub-market level and draws conclusions regarding the complexity of relationships within an urban area. Janssen et al. (2001) compares the performance of least squares and least median of squares, a robust method, in the estimation of price/income relationships for apartment buildings. Meese and Wallace (2003) compare two methods to evaluate the effect of market fundamentals on housing price dynamics. The first method follows the traditional two-step procedures found in the literature in which one first estimates a house price index and then uses the estimated index in subsequent structural modeling. The second method applies a Kalman filter strategy that allows for the simultaneous estimation of the parameters of a dynamic hedonic price model, the price index and the parameters of a structural model for housing prices. Stevenson (2004) re-examines the issue of heteroscedasticity in hedonic house price models. The paper uses data for Boston, which has a high average age of dwelling. The results largely support previous findings with evidence of heteroscedasticity with respect to the age of dwelling. The iterative GLS (Generalised Least Squares) correction, which is specified in terms of age, eliminates all heteroscedasticity at both aggregate and disaggregate levels. Fletcher et al. (2000) argue that a wider range of diagnostic statistics should be used in the specification search for a good model, in particular, but not exclusively, those concerned with predictive stability. The paper illustrates this approach by examining both in-sample and out-of-sample diagnostic tests of various specifications of a hedonic house price model using data taken from the sale of over 1,600 properties in the Midlands of the UK in 1999/2000. Bin (2004) estimates a hedonic price function using a semi-parametric regression and compares the price prediction performance with conventional parametric models. Data from Geographic Information Systems (GIS) are incorporated to account for locational attributes of the houses. Bao and Wan (2004) illustrate how the technique of smoothing splines can be used to estimate hedonic housing price models. Their illustration takes the form of a rather limited, but very promising, application with Hong Kong data. Kim and Park (2005) identify the spatial pattern of housing price changes and their determinants in Seoul and its neighboring new towns. The results of a cluster analysis show that the spatial pattern of housing price change rates is not correlated with housing prices. Filho and Bin (2005) model a hedonic price function for housing as an additive nonparametric regression. Estimation is done via a backfitting procedure in combination with a local polynomial estimator. It avoids the pitfalls of an unrestricted nonparametric estimator. They compare their results to alternative parametric models and find evidence of the superiority of our nonparametric model. Fan et al. (2006) utilize the decision tree approach, which is an important statistical pattern recognition tool in examining the relationship between house prices and housing characteristics. Using the Singapore resale public housing market as a case study, the article demonstrates the usefulness of this technique. Kestens et al. (2006) introduce household-level data into hedonic models in order to measure the heterogeneity of implicit prices regarding household type, age, educational attainment, income, and the previous tenure status of the buyers. Two methods are used for this purpose: a first series of models uses expansion terms, whereas a second series applies Geographically Weighted Regressions.
4. The Data
The data set contains 2004 Household Budget Survey Data for Turkey conducted by Turkish Statistical Institute (TURKSTAT). 2004 Household Budget Survey provides information on the socio-economic status, household composition, employment status and monthly and annually income values of the members, consumption expenditures, grouped by expenditure types, done by households via purchasing or other types of receiving for whole Turkey as well as urban and rural settlements. 2004 Household Budget Survey conducted on 8,600 sample households for the period 1 January 2004 - 31 December 2004.
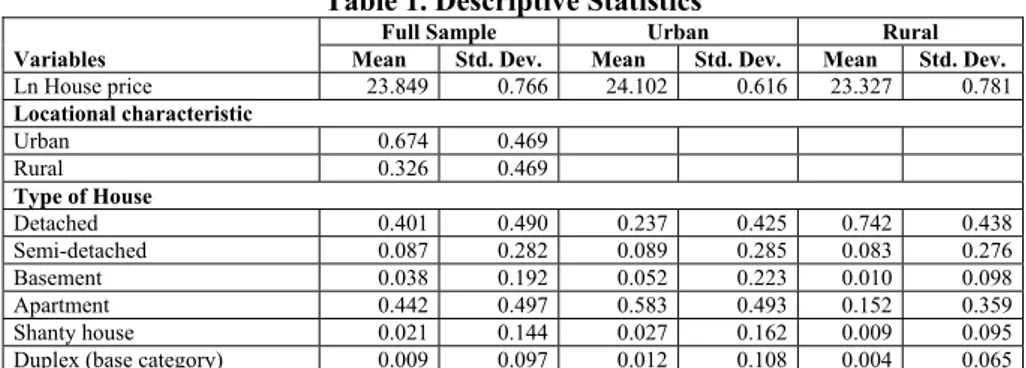
The size of the estimation sample (5741) enables extensive modeling of the housing characteristics. The model contains 46 variables, which are presented in Table 1 together with the descriptive statistics. The variables include ‘locational characteristic’, ‘type of house’, ‘age of the building’, ‘type of the building’, ‘saloon’ and ‘living rooms floors’, ‘bathroom floors’, ‘heating system’, ‘number of rooms’, ‘size’ (square meters), and other structural characteristics. Because of the characteristics of the data, environmental factors can not be considered.
While hedonic price models have been routinely used to analyze the market price of housing, selecting an appropriate functional form has been a frequent concern in the literature. The issue arises because there is little guidance from economic theory about the proper functional relationship between housing price and its attributes. The most common functional form recommended in the hedonic literature is the semi-logarithmic form. This form is preferred because it fits the data particularly well and because the coefficient estimates generated from the model can be interpreted as being the proportion of a good’s price that is directly attributable to the respective characteristics of that good (see Halvorsen and Palmquist, 1980). Thus, we use in this study semi-logarithmic form for the models. More specifically, natural logarithm of the house price is treated as dependent variable. Model,
u x P
ln =β + (1)
Here, P House prices, β coefficient matrix, x set of independent variables and u, error term. Additionally, ordinary least square method is employed in estimating the hedonic model.
Table 1. Descriptive Statistics
Variables
Full Sample Urban Rural
Mean Std. Dev. Mean Std. Dev. Mean Std. Dev.
Ln House price 23.849 0.766 24.102 0.616 23.327 0.781 Locational characteristic Urban 0.674 0.469 Rural 0.326 0.469 Type of House Detached 0.401 0.490 0.237 0.425 0.742 0.438 Semi-detached 0.087 0.282 0.089 0.285 0.083 0.276 Basement 0.038 0.192 0.052 0.223 0.010 0.098 Apartment 0.442 0.497 0.583 0.493 0.152 0.359 Shanty house 0.021 0.144 0.027 0.162 0.009 0.095
Table 1. Descriptive Statistics (continued)
Age of the Building
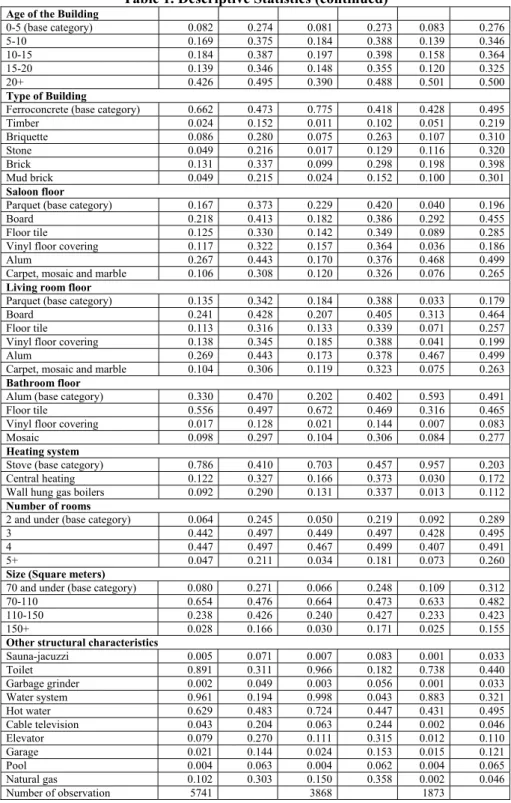
0-5 (base category) 0.082 0.274 0.081 0.273 0.083 0.276 5-10 0.169 0.375 0.184 0.388 0.139 0.346 10-15 0.184 0.387 0.197 0.398 0.158 0.364 15-20 0.139 0.346 0.148 0.355 0.120 0.325 20+ 0.426 0.495 0.390 0.488 0.501 0.500 Type of Building
Ferroconcrete (base category) 0.662 0.473 0.775 0.418 0.428 0.495
Timber 0.024 0.152 0.011 0.102 0.051 0.219 Briquette 0.086 0.280 0.075 0.263 0.107 0.310 Stone 0.049 0.216 0.017 0.129 0.116 0.320 Brick 0.131 0.337 0.099 0.298 0.198 0.398 Mud brick 0.049 0.215 0.024 0.152 0.100 0.301 Saloon floor
Parquet (base category) 0.167 0.373 0.229 0.420 0.040 0.196
Board 0.218 0.413 0.182 0.386 0.292 0.455
Floor tile 0.125 0.330 0.142 0.349 0.089 0.285
Vinyl floor covering 0.117 0.322 0.157 0.364 0.036 0.186
Alum 0.267 0.443 0.170 0.376 0.468 0.499
Carpet, mosaic and marble 0.106 0.308 0.120 0.326 0.076 0.265
Living room floor
Parquet (base category) 0.135 0.342 0.184 0.388 0.033 0.179
Board 0.241 0.428 0.207 0.405 0.313 0.464
Floor tile 0.113 0.316 0.133 0.339 0.071 0.257
Vinyl floor covering 0.138 0.345 0.185 0.388 0.041 0.199
Alum 0.269 0.443 0.173 0.378 0.467 0.499
Carpet, mosaic and marble 0.104 0.306 0.119 0.323 0.075 0.263
Bathroom floor
Alum (base category) 0.330 0.470 0.202 0.402 0.593 0.491
Floor tile 0.556 0.497 0.672 0.469 0.316 0.465
Vinyl floor covering 0.017 0.128 0.021 0.144 0.007 0.083
Mosaic 0.098 0.297 0.104 0.306 0.084 0.277
Heating system
Stove (base category) 0.786 0.410 0.703 0.457 0.957 0.203
Central heating 0.122 0.327 0.166 0.373 0.030 0.172
Wall hung gas boilers 0.092 0.290 0.131 0.337 0.013 0.112
Number of rooms
2 and under (base category) 0.064 0.245 0.050 0.219 0.092 0.289
3 0.442 0.497 0.449 0.497 0.428 0.495
4 0.447 0.497 0.467 0.499 0.407 0.491
5+ 0.047 0.211 0.034 0.181 0.073 0.260
Size (Square meters)
70 and under (base category) 0.080 0.271 0.066 0.248 0.109 0.312
70-110 0.654 0.476 0.664 0.473 0.633 0.482
110-150 0.238 0.426 0.240 0.427 0.233 0.423
150+ 0.028 0.166 0.030 0.171 0.025 0.155
Other structural characteristics
Sauna-jacuzzi 0.005 0.071 0.007 0.083 0.001 0.033 Toilet 0.891 0.311 0.966 0.182 0.738 0.440 Garbage grinder 0.002 0.049 0.003 0.056 0.001 0.033 Water system 0.961 0.194 0.998 0.043 0.883 0.321 Hot water 0.629 0.483 0.724 0.447 0.431 0.495 Cable television 0.043 0.204 0.063 0.244 0.002 0.046 Elevator 0.079 0.270 0.111 0.315 0.012 0.110 Garage 0.021 0.144 0.024 0.153 0.015 0.121 Pool 0.004 0.063 0.004 0.062 0.004 0.065 Natural gas 0.102 0.303 0.150 0.358 0.002 0.046 Number of observation 5741 3868 1873
5. The Results
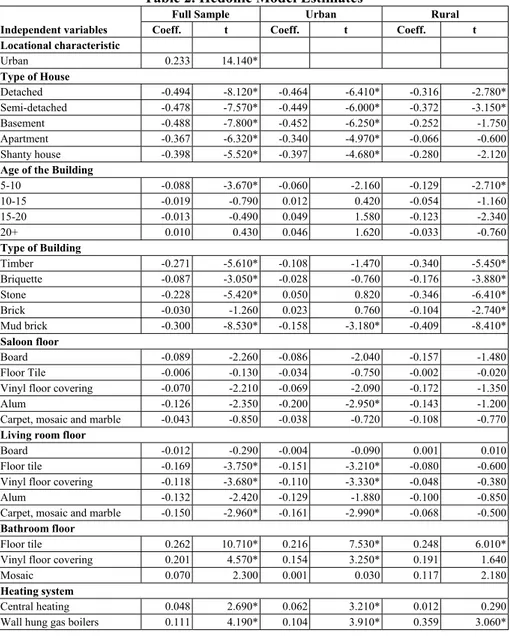
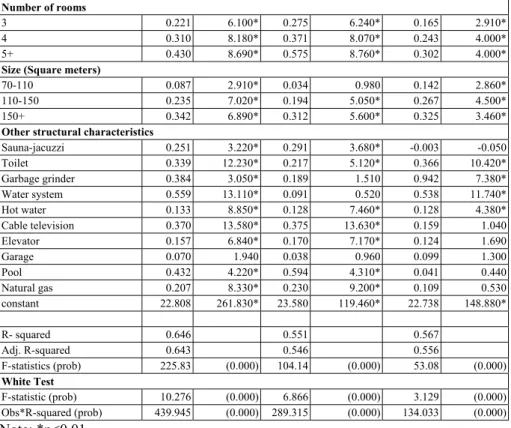
In this section, the results obtained by the hedonic model and ANN are discussed. Table 2 provides hedonic regression model results. As seen from the results, our specifications do not show any multicollinearity among explanatory variables, but heteroscedasticity is present as shown by White test statistics. Heteroscedasticity has long been recognized as a potential problem in hedonic house price equations. We have corrected the standard errors by using the White’s (1980) heteroscedasticity consistent coefficient covariance matrix. The results in Table 2 report that most of the variables are highly significant, and sign of the coefficients are consistent with the expectations.
Table 2. Hedonic Model Estimates
Full Sample Urban Rural
Independent variables Coeff. t Coeff. t Coeff. t
Locational characteristic Urban 0.233 14.140* Type of House Detached -0.494 -8.120* -0.464 -6.410* -0.316 -2.780* Semi-detached -0.478 -7.570* -0.449 -6.000* -0.372 -3.150* Basement -0.488 -7.800* -0.452 -6.250* -0.252 -1.750 Apartment -0.367 -6.320* -0.340 -4.970* -0.066 -0.600 Shanty house -0.398 -5.520* -0.397 -4.680* -0.280 -2.120
Age of the Building
5-10 -0.088 -3.670* -0.060 -2.160 -0.129 -2.710* 10-15 -0.019 -0.790 0.012 0.420 -0.054 -1.160 15-20 -0.013 -0.490 0.049 1.580 -0.123 -2.340 20+ 0.010 0.430 0.046 1.620 -0.033 -0.760 Type of Building Timber -0.271 -5.610* -0.108 -1.470 -0.340 -5.450* Briquette -0.087 -3.050* -0.028 -0.760 -0.176 -3.880* Stone -0.228 -5.420* 0.050 0.820 -0.346 -6.410* Brick -0.030 -1.260 0.023 0.760 -0.104 -2.740* Mud brick -0.300 -8.530* -0.158 -3.180* -0.409 -8.410* Saloon floor Board -0.089 -2.260 -0.086 -2.040 -0.157 -1.480 Floor Tile -0.006 -0.130 -0.034 -0.750 -0.002 -0.020
Vinyl floor covering -0.070 -2.210 -0.069 -2.090 -0.172 -1.350
Alum -0.126 -2.350 -0.200 -2.950* -0.143 -1.200
Carpet, mosaic and marble -0.043 -0.850 -0.038 -0.720 -0.108 -0.770
Living room floor
Board -0.012 -0.290 -0.004 -0.090 0.001 0.010
Floor tile -0.169 -3.750* -0.151 -3.210* -0.080 -0.600
Vinyl floor covering -0.118 -3.680* -0.110 -3.330* -0.048 -0.380
Alum -0.132 -2.420 -0.129 -1.880 -0.100 -0.850
Carpet, mosaic and marble -0.150 -2.960* -0.161 -2.990* -0.068 -0.500
Bathroom floor
Floor tile 0.262 10.710* 0.216 7.530* 0.248 6.010*
Vinyl floor covering 0.201 4.570* 0.154 3.250* 0.191 1.640
Mosaic 0.070 2.300 0.001 0.030 0.117 2.180
Heating system
Central heating 0.048 2.690* 0.062 3.210* 0.012 0.290
Table 2. Hedonic Model Estimates (continued)
Number of rooms
3 0.221 6.100* 0.275 6.240* 0.165 2.910*
4 0.310 8.180* 0.371 8.070* 0.243 4.000*
5+ 0.430 8.690* 0.575 8.760* 0.302 4.000*
Size (Square meters)
70-110 0.087 2.910* 0.034 0.980 0.142 2.860*
110-150 0.235 7.020* 0.194 5.050* 0.267 4.500*
150+ 0.342 6.890* 0.312 5.600* 0.325 3.460*
Other structural characteristics
Sauna-jacuzzi 0.251 3.220* 0.291 3.680* -0.003 -0.050 Toilet 0.339 12.230* 0.217 5.120* 0.366 10.420* Garbage grinder 0.384 3.050* 0.189 1.510 0.942 7.380* Water system 0.559 13.110* 0.091 0.520 0.538 11.740* Hot water 0.133 8.850* 0.128 7.460* 0.128 4.380* Cable television 0.370 13.580* 0.375 13.630* 0.159 1.040 Elevator 0.157 6.840* 0.170 7.170* 0.124 1.690 Garage 0.070 1.940 0.038 0.960 0.099 1.300 Pool 0.432 4.220* 0.594 4.310* 0.041 0.440 Natural gas 0.207 8.330* 0.230 9.200* 0.109 0.530 constant 22.808 261.830* 23.580 119.460* 22.738 148.880* R- squared 0.646 0.551 0.567 Adj. R-squared 0.643 0.546 0.556 F-statistics (prob) 225.83 (0.000) 104.14 (0.000) 53.08 (0.000) White Test F-statistic (prob) 10.276 (0.000) 6.866 (0.000) 3.129 (0.000) Obs*R-squared (prob) 439.945 (0.000) 289.315 (0.000) 134.033 (0.000) Note: *p<0.01
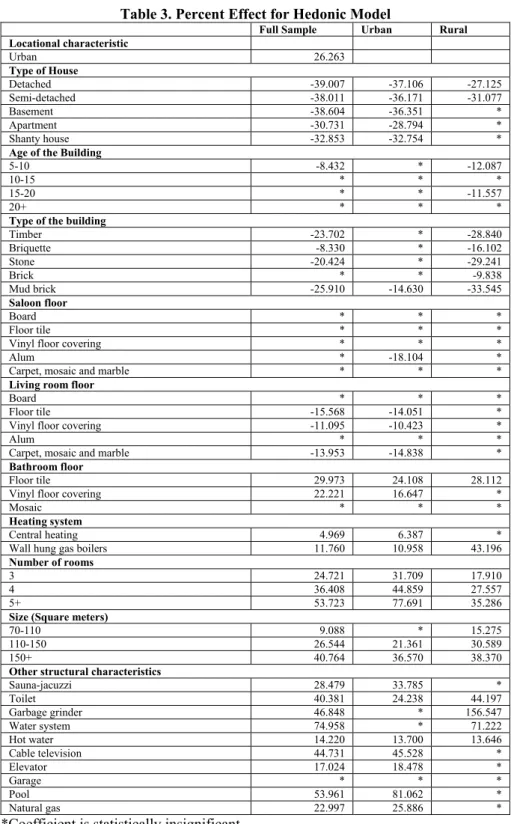
Percent effect for the hedonic model estimates are presented in Table 3. If the results are analyzed, it can be seen that house prices in urban area are higher than rural area by 26.26 %. The results also denote that prices of the other types of house are less in a range of 30% to 39% compared to the base category (duplex) for the urban area and full sample, while the range is 24% to 31% for the rural area. According to the results, the prices of houses that are between 5-10 years of age are less than those that are 0-5 years of age by 8 % and 12% respectively for the full sample and rural areas. Prices of the other types of building are less than those of the base category (ferroconcrete) in a range of 8.33% to 29.24%. Saloon floor and living room floor variables are insignificant in rural area. Saloon floor types of alum negatively affect the house prices compared to the parquet in the urban area. On the other hand, the effect of the living room floor variables on house prices is negative again in the full sample and urban area. Additionally, bathroom floor variables have a positive effect on the prices in contrast to the effect of alum. The prices of the houses with central heating and wall hung gas boilers are higher than those with stove. Herein, the percent effects are 5 % and 11.8%, respectively in the full sample, while they are 6 % and 11% in the urban areas. In rural area, having wall hung gas boilers increases the house prices by 43 %, which is significantly higher than those in the full sample and urban area, compared to the houses with stove. As expected, the higher the number of rooms and house size the higher the house prices. Finally, the results indicate that most of the other structural characteristics have a significant and positive effect on the house prices. The effect changes between 14%-156%.
Table 3. Percent Effect for Hedonic Model
Full Sample Urban Rural
Locational characteristic Urban 26.263 Type of House Detached -39.007 -37.106 -27.125 Semi-detached -38.011 -36.171 -31.077 Basement -38.604 -36.351 * Apartment -30.731 -28.794 * Shanty house -32.853 -32.754 *
Age of the Building
5-10 -8.432 * -12.087
10-15 * * *
15-20 * * -11.557
20+ * * *
Type of the building
Timber -23.702 * -28.840 Briquette -8.330 * -16.102 Stone -20.424 * -29.241 Brick * * -9.838 Mud brick -25.910 -14.630 -33.545 Saloon floor Board * * * Floor tile * * *
Vinyl floor covering * * *
Alum * -18.104 *
Carpet, mosaic and marble * * *
Living room floor
Board * * *
Floor tile -15.568 -14.051 *
Vinyl floor covering -11.095 -10.423 *
Alum * * *
Carpet, mosaic and marble -13.953 -14.838 *
Bathroom floor
Floor tile 29.973 24.108 28.112
Vinyl floor covering 22.221 16.647 *
Mosaic * * *
Heating system
Central heating 4.969 6.387 *
Wall hung gas boilers 11.760 10.958 43.196
Number of rooms
3 24.721 31.709 17.910
4 36.408 44.859 27.557
5+ 53.723 77.691 35.286
Size (Square meters)
70-110 9.088 * 15.275
110-150 26.544 21.361 30.589
150+ 40.764 36.570 38.370
Other structural characteristics
Sauna-jacuzzi 28.479 33.785 * Toilet 40.381 24.238 44.197 Garbage grinder 46.848 * 156.547 Water system 74.958 * 71.222 Hot water 14.220 13.700 13.646 Cable television 44.731 45.528 * Elevator 17.024 18.478 * Garage * * * Pool 53.961 81.062 * Natural gas 22.997 25.886 *
6. Conclusions
Hedonic model examines the effect of characteristics of goods on their prices. The paper analysis the determinants of house prices in Turkey for the whole country, the urban and rural areas. Hedonic regression model is employed in the analysis. Semi-logarithmic form is used in this study. Ordinary least square method is employed in estimating the hedonic model. The results of the hedonic model reveal that water system, pool, type of house, number of rooms, house size, locational characteristic and type of the building are the most significant variables that affect the house prices. Previous research dealing with house market in Turkey using hedonic price model include local house price analysis. However, this study presents an analysis for the whole Turkey, and provides important findings on the determinants of house prices in Turkey.
References
ADAIR, A., MCGREAL, S., SMYTH, A., COOPER, J. & RYLEY, T. (2000). House price and accessibility: The testing of relationships within the Belfast urban area. Housing Studies. Vol. 15, No. 5, pp. 699-716.
BAO, H. X. H. & WAN, A. T. K. (2004). On the use of spline smoothing in estimating hedonic housing price models: empirical evidence using Hong Kong data. Real Estate Economics. vol. 32, issue 3, pp. 487-507.
BIN, O. (2004). A prediction comparison of housing sales prices by parametric versus semi-parametric regressions. Journal of Housing Economics. 13: 68-84.ss.
CAN, A. (1992). Specification and estimation of hedonic housing price models.
Regional Science and Urban Economics, 22, pp. 453–474.
CASE, B.J., CLAPP, R., DUBIN & M., RODRIGUEZ (2004). Modelling spatial and temporal house price patterns: a comparison of four models. Journal of Real
Estate Finance and Economics, vol. 29, issue 2, pp. 167-191.
FAN, G., ONG, Z. S. E. & KOH, H. C. (2006). Determinants of house price: A decision tree approach. Urban Studies. Vol. 43, No. 12, pp. 2301-2315.
FLETCHER, M., GALLIMORE, P. & MANGAN, J. (2000). Heteroscedasticity in hedonic house price models. Journal of Property Research. 17 (2), pp. 93-108. FILHO, C. M. & BIN, O. (2005). Estimation of hedonic price functions via additive
nonparametric regression. Emprical Economics. 30, pp. 93-114.
GOODMAN, A.C. (1998). Andrew Court and the invention of hedonic price analysis. Journal of Urban Economics, Vol. 44, pp. 291-298.
HALVORSEN, R. & PALMQUIST R. (1980). The interpretation of dummy variables in semilogrithmic regressions. American Economic Review. 70, June, pp. 474-5.
HIDANO, N. (2002). The economic valuation of the environment and public policy:
A hedonic approach. New Horizons in Environmental Economics, Series
Editors, Wallace E. Oates and Henk Folmer.
JANSSEN, C. B. & SODERBERG, J. Z. (2001). Robust estimation of hedonic models of prive and income for investment property. Journal of Property
Investment & Finance. Vol. 19, No. 4, pp. 342-360.
KAUKO T., (2003), “On current neural network applications involving spatial modelling of property prices”, Journal of Housing and the Built Environment 18, pp. 159-181.
KESBİÇ, Y., BALDEMİR, E. & İNCİ, M. (2007). Emlak piyasasında hedonik talep parametrelerinin tahminlenmesi: Muğla Örneği. 8. Türkiye Ekonometri ve
İstatistik Kongresi, 24-25 Mayıs, İnönü Üniversitesi, Malatya.
KESTENS, Y., THERIAULT, M. & ROSIER, F.D. (2006). Heterogeneity in hedonic modelling of house prices: looking at buyers’ household profiles. J.
Geograph Syst. 8, pp. 61-96.
KIM, K. & PARK, J. (2005). Segmentation of the housing market and its determinants: Seoul and its neighbouring new towns in Korea. Australian
Geographer. Vol. 36, No.2, pp. 221-232.
LANCASTER, K. J. (1966). A new approach to consumer theory. Journal of
Political Economy. 74, pp. 132–157.
MALPEZZI, S. (2003). Hedonic pricing models: A selective and applied review. in: T.O’Sullivan and K. Gibb (Eds) Housing Economics and Public Policy, 67– 89.ss. Malden, MA: Blackwell Science.
MEESE, R., & N., WALLACE (2003). House price dynamics and market fundamentals: The Parisian housing market. Urban Studies, Vol. 40, Nos.5-6, pp. 1027-1045.
OGWANG T. & B. WANG (2003). The hedonic price function for A Northern BC community. Social Indicator Research, 61, pp. 285-296.
ÖZUS, E. & DÖKMECİ, V. (2006). Dönüşüm yaşanan tarihi alanlarda konut fiyatlarında etkili faktörlerin analizi. İTÜ Dergisi/a Mimarlık, Planlama, Tasarım, Cilt:5, Sayı:2, Kısım:2, 177-186. ss.
PAGOURTZI, E., ASSIMAKOPOULOS, V., HATZICHRISTOS, T. & FRENCH, N. (2003). Real estate appraisal: a review of valuation methods. Journal of
Property Investment & Finance. Vol.21, No.4, pp. 383-401.
ROSEN, S. (1974). Hedonic prices and implicit markets: product differentiation in pure competition. Journal of Political Economy. 82, January/February.
SCHULZ, R. & WERWATZ, A. (2004). A state space model for Berlin house prices: estimation and economic interpretation. Journal of Real Estate Finance
and Economics. 28, pp. 37-57.
SHEPPARD, S. (1999). Hedonic analysis of housing markets. In: P. C. Cheshire and E. S. Mills (Eds) Handbook of Regional and Urban Economics, Vol. 3, ch. 41. Amsterdam: Elsevier.
STEVENSON, S. (2004). New empirical evidence on heteroscedasticity in hedonic housing models. Journal of Housing Economics. 13, pp. 136-153.
TEMURLENK, M. S. & ÖZÇELİK A. (2003). Erzurum’da konut kiralarının hedonic model yaklaşımıyla incelenmesi. VI. Ulusal Ekonometri ve İstatistik
Sempozyumu. Gazi Üniversitesi, Ankara.
TÜİK-Türkiye İstatistik Kurumu (2004). Hanehalkı bütçe anketi araştırması. USTAOĞLU, E. (2003). Hedonic price analysis of office rents: A case study of the
office market in Ankara. Middle East Technical University, Unpublished MSc.
Thesis.
WHITE, H. (1980). Heteroskedasticity-consistent covariance matrix and a direct test for heteroskedasticity”, Econometrica, 48, pp. 817-838.