Evaluation of Hearing Loss in Pilots
Hayriye Atalay, Seda Türkoğlu Babakurban, Erdinç Aydın
Department of Otorhinolaryngology, Başkent University School of Medicine, Ankara, Turkey Original Investigation
Objective: High-intensity noise sources with an in-crease in air traffic and sudden changes in atmospheric pressure can cause hearing loss in pilots. The main goal of this research is to examine hearing loss due to age, the total flight hours and aircraft types and to evaluate the effects of personal conditions that can influence the hearing level.
Methods: We examined the data of 234 Turkish pilots aged between 25 and 54 years who were ex-amined due to the aviation Law for annual con-trol from January 2005 to January 2014 at Başkent University Medical Faculty, Ankara Hospital. The audiometric results of the pilots were used. While 1, 2, 3, 4, 6, and 8 KHz were used for the airway threshold, 1, 2, and 4 KHz were used for the bone conduction threshold.
Results: According to the data of the 234 pilots, there was a significant correlation between high- frequency hearing loss and the total flight hours and pilots’ ages. The average hearing loss was higher, particularly in the left ear, in pilots using helicopters than in those using other aircraft types. There was no statistically significant correlation between hearing loss and diabetes, hyper-cholesterolemia, high blood pressure, anemia, obesity, and smoking.
Conclusion: A significant cor relation was observed be-tween high frequency hearing loss and the total flight hours, pilots’ age, and aircraft types in our study. Keywords: Pilot, aviation, noise, barotrauma, hearing loss
This study was presented at 37th Turkish National Congress of Otorhinolaryngology Head and Neck Surgery, 28 October-1 November, 2015, Antalya, Turkey.
Address for Correspondence:
Seda Türkoğlu Babakurban
E-mail: [email protected] Received Date: 27.10.2015 Accepted Date: 03.01.2016
© Copyright 2015 by Official Journal of the Turkish Society of Otorhinolaryngology and Head and Neck Surgery Available online at www.turkarchotorhinolaryngol.org DOI: 10.5152/tao.2015.1330
Abstract
Introduction
Temporary or permanent health problems may de-velop in pilots over time in relation to flights and flight hours. Hearing loss is one of the important health problems that the pilots encounter. Noise and barotrauma are the two important reasons that may lead to hearing loss in pilots.
The higher intensity of aircraft noise than that of other sound sources leads to the development of noise-induced hearing loss in pilots. The increase in air traffic creates problems such as noise pollu-tion and noise-induced hearing loss (1). The neg-ative impact of noise on the sense of hearing in-creases over time. Hearing loss in flight personnel may lead to dramatic results with increasing age and duration of noise exposure (2).
Barotrauma, which is seen as the second hearing loss factor in pilots, is the most prevalent medical prob-lem experienced in flights and is considered as the most common aviation accident. Its incidence varies
between 8-17% (3). At present, barotraumas occur in spite of developing cabin technologies. Rosenkvist et al. (4) displayed that most pilots had 2–3 upper respi-ratory tract infections annually and 37% of them had experienced at least one barotrauma.
Hearing loss that may develop in pilots has been examined for different aircraft types and popula-tions in literature studies (5-8).
The aim of this study was to determine the lev-el of hearing loss in pilots in Turkey. This study was conducted in association with the age of the pilots, total flight hours, and aircraft type, taking into consideration the diseases affecting hearing, in order to show the impact of noise level in the aviation sector, pilots’ duration of noise exposure, and atmospheric pressure change on hearing loss. Another aim was to increase the consciousness levels of the pilots individually and the awareness of flight surgeons about the reasons of hearing loss in pilots.
Methods
This research was approved with the paper numbered 94603339/18.050.01.08.01-1077 (Project no: KA13/257) by Başkent University Medicine and Health Sciences Research Board on 20/11/2013, and supported by the Başkent Universi-ty Research Fund. The study was conducted using the Başkent University Aviation Medical Unit Archive retrospectively. The files of 1000 pilots who were admitted to Başkent Univer-sity Medical School Ankara Hospital for their periodical eval-uations, in accordance with the Aviation Law, between January 2005 and January 2014 were scanned.
The files of 234 pilots between the ages of 25 and 54 years that matched the criteria of the study were reviewed. Patient appli-cation forms, ear nose throat examination forms, biochemistry analysis results, and audiometry test results that were found in the files were examined. In the audiometry tests, the pure tone airway thresholds having frequencies of 1000 Hz, 2000 Hz, 3000 Hz, 4000 Hz, 6000 Hz, and 8000 Hz and pure tone bone conduction thresholds having the frequencies of 1000 Hz, 2000 Hz, and 4000 Hz were evaluated.
Pure tone audiometry evaluations were made with two types of clinical audiometers (AC-33/AC-40 audiometer; Interacoustics A/S, Middelfart, Denmark). The measurements were performed using TDH-39 standard earphone in a silent cabin. The thresh-olds (according to OSHA 1983, F1 and F2 tables) to be eval-uated as hearing loss were determined for the men and women according to age-corrected values.
Furthermore, intergroup comparison was made by calculating the mean frequency thresholds of the groups.
Inclusion criteria to the study group were determined as follows: 1) Pilots were divided into 3 groups according to their ages; -1.group: between the ages of 25-34 years
-2.group: between the ages of 35-44 years -3.group: between the ages of 45-54 years
2) Pilots were divided into 3 groups according to the flight hours;
-1.group: those who flew between 200-1000 h -2.group: those who flew between 1001-3000 h -3.group: those who flew between 3001-10000 h
3) Pilots were divided into 3 groups according to the aircraft types;
-1.group: helicopter -2.group: jet-aircraft -3.group: propeller aircraft
4) The relationship of the pilots’ body mass index with hearing loss was evaluated in 3 groups;
-1.group: BMI value between 18.5–24.9 (normal weight) -2.group: BMI value between 25.0–29.9 (over weight)
-3.group: BMI value between 30.0–34 (obese-Class 1 Obesity) 5) The relationship of the pilots having low values of hemoglo-bin (Hb) (anemia) with hearing loss was evaluated. An Hb value of 14–18 g/dL was accepted as normal. The results of three pi-lots below the normal level were examined in the study.
6) The relationship of the pilots having high total cholesterol with hearing loss was evaluated. Total cholesterol levels 200 mg/ dL and below were accepted as normal. In our study, the results of 90 pilots having high total cholesterol levels were examined. 7) Pilots with hypertension diagnosis according to information in the patient examination application form were determined, and the relationship between hypertension and hearing loss was examined. The results of three pilots were examined in our study. 8) Pilots with a diabetes mellitus diagnosis according to infor-mation in the patient examination application form were de-termined, and the relationship between diabetes mellitus and hearing loss was examined. The results of 23 pilots were exam-ined in our study.
9) The relationship between smoking in pilots and hearing loss was evaluated. The results of pilots who answered “yes” to that question in the patient examination application form “are you smoking” were examined.
Statistical Analysis
The SPPS 20 (IBM Corp. Released 2011. IBM SPSS Statis-tics for Windows, Version 20.0. Armonk, NY: IBM Corp.) statistical package software was used for the evaluation of data. Variables were presented as mean ± standard deviation, median (maximum–minimum), percentage, and frequency. The accor-dance of the data to the repeated measures analysis of vari-ance was evaluated with Mauchly’s test of sphericity and Box’s M-test for homogeneity of variances. Repeated measures anal-ysis of variance was used for comparing the means. If precon-ditions of parametric tests were not met, degrees of freedom were corrected using the Greenhouse-Geisser (1959) or the Huynh-Feldt (1976) test. Multiple comparisons were made with the Bonferroni Correction Test. The variables were evalu-ated after the preconditions of normality and homogeneity of variances control (Shapiro, Wilk, and Levene Test) were car-ried out. While analyzing data, One-Way Analysis of Variance was used for comparing 3 or more groups. When the Tukey HSD test could not be benefited, the Kruskal, Wallis, and Bonferroni-Dunn test, which is a multiple comparison test, was used. The relationship between two continuous variables
was evaluated through the Pearson correlation coefficient. In the lack of preconditions for a parametric test, the Spearman correlation coefficient was employed. Categorical data were analyzed by using Fisher’s Exact Test and the Chi-Square test. In cases when the expected frequencies were lower than 20%, evaluation was performed by the “Monte Carlo Simulation Method” for including these frequencies in the analysis. The values of p<0.05 and p<0.01 were accepted as statistically sig-nificant.
Results
In the study according to the age groups, 83 pilots (35.5%) in the 1st group (between the ages of 25-34 years), 81 pilots (34.6%) in the 2nd group (between the ages of 35-44 years), and 70 pilots (29.9%) in the 3rd group (between the ages of 45–54 years) were examined.
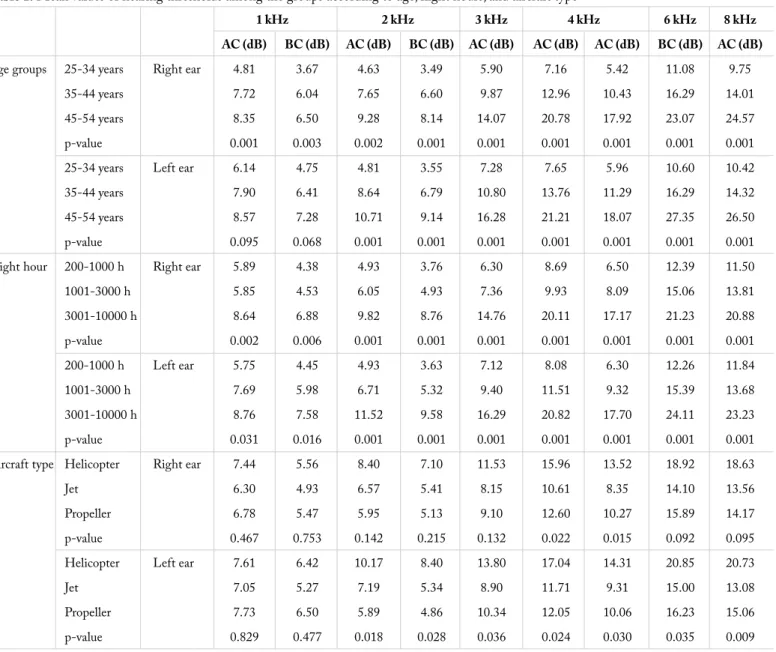
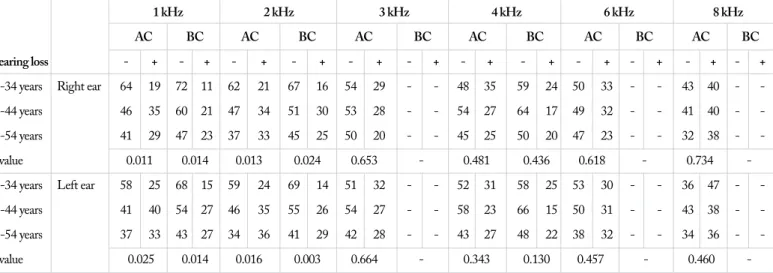
In accordance with the increase in age, a significant correlation was detected among the groups at 1, 2, 3, 4, 6, and 8 KHz fre-quencies of the air conduction hearing of the right ear and at 2, 3, 4, 6, and 8 KHz frequencies of the air conduction hearing of the left ear (Table 1, Figure 1, 2). The number of pilots developing hearing loss depending on age is displayed in Table 2. In the study according to the flight hours the pilots flew, 73 (31.2%) in the 1st group (200–1000 h), 76 (32.5%) in the 2nd group (1001–3000 h),
and 85 (36.3 %) (3001–10000 h) in the 3rd group were examined.
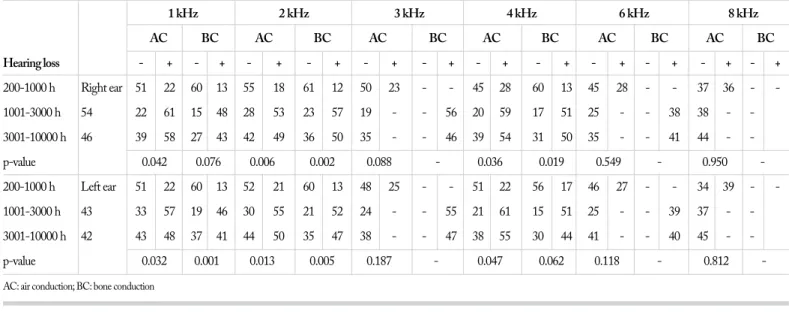
A significant relationship was detected among the groups in the air conduction hearing of the right and left ears at all frequen-cies depending on the increase in flight hours (Table 1, Figure 3, 4). The number of total hearing losses depending on the flying hours and comparison of p-values among the groups are dis-played in Table 3.
Table 1. Mean values of hearing thresholds among the groups according to age, flight hours, and aircraft type
1 kHz 2 kHz 3 kHz 4 kHz 6 kHz 8 kHz AC (dB) BC (dB) AC (dB) BC (dB) AC (dB) AC (dB) AC (dB) BC (dB) AC (dB)
Age groups 25-34 years Right ear 4.81 3.67 4.63 3.49 5.90 7.16 5.42 11.08 9.75 35-44 years 7.72 6.04 7.65 6.60 9.87 12.96 10.43 16.29 14.01 45-54 years 8.35 6.50 9.28 8.14 14.07 20.78 17.92 23.07 24.57 p-value 0.001 0.003 0.002 0.001 0.001 0.001 0.001 0.001 0.001 25-34 years Left ear 6.14 4.75 4.81 3.55 7.28 7.65 5.96 10.60 10.42 35-44 years 7.90 6.41 8.64 6.79 10.80 13.76 11.29 16.29 14.32 45-54 years 8.57 7.28 10.71 9.14 16.28 21.21 18.07 27.35 26.50 p-value 0.095 0.068 0.001 0.001 0.001 0.001 0.001 0.001 0.001 Flight hour 200-1000 h Right ear 5.89 4.38 4.93 3.76 6.30 8.69 6.50 12.39 11.50 1001-3000 h 5.85 4.53 6.05 4.93 7.36 9.93 8.09 15.06 13.81 3001-10000 h 8.64 6.88 9.82 8.76 14.76 20.11 17.17 21.23 20.88 p-value 0.002 0.006 0.001 0.001 0.001 0.001 0.001 0.001 0.001 200-1000 h Left ear 5.75 4.45 4.93 3.63 7.12 8.08 6.30 12.26 11.84 1001-3000 h 7.69 5.98 6.71 5.32 9.40 11.51 9.32 15.39 13.68 3001-10000 h 8.76 7.58 11.52 9.58 16.29 20.82 17.70 24.11 23.23 p-value 0.031 0.016 0.001 0.001 0.001 0.001 0.001 0.001 0.001 Aircraft type Helicopter Right ear 7.44 5.56 8.40 7.10 11.53 15.96 13.52 18.92 18.63 Jet 6.30 4.93 6.57 5.41 8.15 10.61 8.35 14.10 13.56 Propeller 6.78 5.47 5.95 5.13 9.10 12.60 10.27 15.89 14.17 p-value 0.467 0.753 0.142 0.215 0.132 0.022 0.015 0.092 0.095 Helicopter Left ear 7.61 6.42 10.17 8.40 13.80 17.04 14.31 20.85 20.73 Jet 7.05 5.27 7.19 5.34 8.90 11.71 9.31 15.00 13.08 Propeller 7.73 6.50 5.89 4.86 10.34 12.05 10.06 16.23 15.06 p-value 0.829 0.477 0.018 0.028 0.036 0.024 0.030 0.035 0.009 AC:air conduction; BC: bone conduction
In the study according to the aircraft type the pilots flew, 88 of them (37.6%) in the 1st group (flying helicopter), 73 of them (31.2%) in the 2nd group (flying jet), and 73 of them (31.2%)
(flying propeller) in the 3rd group were examined.
A significant difference was detected among the groups only in the air conduction hearing of the right ear on 1 KHz with regard to the number of pilots having hearing loss depending on the aircraft type. 29 pilots (33%) in the 1st group, 16 pilots (21.9%)
in the 2nd group, and 10 pilots (13.7%) in the 3rd group for a total
of 55 pilots had hearing loss. There was a significant relationship between the two variables (p-value: 0.022). There was a signifi-cant relationship among the groups in the measurements in the
air conduction hearing of the right ear at 4 KHz and in the air conduction hearing of the left ear at 2, 3, 4, 6, and 8 KHz fre-quencies with regard to mean threshold values (Table 1, Figure 5, 6). The number of air and bone conduction hearing losses at all frequencies depending on the aircraft type and comparison of p-values among the groups are displayed in Table 4.
There was a significant difference in both frequencies and right and left ears as a result of multivariate analysis with regard to age groups, flight hours, and aircraft types (Table 5).
Of the pilots included in the study, there were 84 pilots (35.9%) in the 1st group (18-24.9), 136 pilots (58.1%) in the 2nd group (25-29.9)
Figure 1. Sound intensity-frequency relationship in the the air conduction hearing of the right ear among the age groups
Frequency (KHz) 0 1 2 3 4 5 6 7 8 9 0 5 10 15 20 25 30 Sound intensit y (dB) 25-34 years (1 st group) 35-44 years (2nd group) 45-54 years (3rd group)
Figure 2. Sound intensity-frequency relationship in the air conduction hearing of the left ear among the age groups
Frequency (KHz) 0 1 2 3 4 5 6 7 8 9 0 5 10 15 20 25 30 Sound intensit y (dB) 25-34 years (1 st group) 35-44 years (2nd group) 45-54 years (3rd group)
Table 2. Comparison of p-values and hearing loss at 1-8 kHz air conducton and bone conduction among the groups according to age
1 kHz 2 kHz 3 kHz 4 kHz 6 kHz 8 kHz AC BC AC BC AC BC AC BC AC BC AC BC Hearing loss - + - + - + - + - + - + - + - + - + - + - + - +
25-34 years Right ear 64 19 72 11 62 21 67 16 54 29 48 35 59 24 50 33 43 40 -35-44 years 46 35 60 21 47 34 51 30 53 28 54 27 64 17 49 32 41 40 -45-54 years 41 29 47 23 37 33 45 25 50 20 45 25 50 20 47 23 32 38 -p-value 0.011 0.014 0.013 0.024 0.653 0.481 0.436 0.618 0.734 -25-34 years Left ear 58 25 68 15 59 24 69 14 51 32 52 31 58 25 53 30 36 47 -35-44 years 41 40 54 27 46 35 55 26 54 27 58 23 66 15 50 31 43 38 -45-54 years 37 33 43 27 34 36 41 29 42 28 43 27 48 22 38 32 34 36 -p-value 0.025 0.014 0.016 0.003 0.664 0.343 0.130 0.457 0.460 -AC: air conduction; BC: bone conduction
Figure 3. Sound intensity-frequency relationship in the air conduction hearing of the right ear according to flight hours
Frequency (KHz) 0 1 2 3 4 5 6 7 8 9 0 5 10 15 20 25 Sound intensit y (dB) 200-1000 h 1001-3000 h 3001-10000 h
Figure 4. Sound intensity-frequency relationship in the air conduction hearing of the left ear according to flight hours
Frequency (KHz) 0 1 2 3 4 5 6 7 8 9 0 5 10 15 20 25 30 Sound intensit y (dB) 200-1000 h 1001-3000 h 3001-10000 h
and 14 pilots (6%) in the 3rd group (30-34.9) according to body mass
index results. No significant difference was detected with respect to hearing loss in both ears depending on body mass index ratios. Hemoglobin results of 231 pilots (98.7%) included in our study were found within normal range and they were below the nor-mal range in 3 pilots (1.3%). Total cholesterol results were found
within the normal range in 144 pilots (61.5%) and above the normal range in 90 pilots (38.5%). Measurements of arterial blood pressure were found within normal range in 231 pilots (98.7%) and above the normal range in 3 pilots (1.3%).
In total, 23 pilots (9.8%) included in the study had a diagnosis of diabetes mellitus and 91 pilots (38.9%) smoked. No significant Table 3. Comparison of p-values and hearing loss at 1-8 kHz air conduction and bone conduction among the groups according to flight hours
1 kHz 2 kHz 3 kHz 4 kHz 6 kHz 8 kHz AC BC AC BC AC BC AC BC AC BC AC BC Hearing loss - + - + - + - + - + - + - + - + - + - + - + - + 200-1000 h Right ear 51 22 60 13 55 18 61 12 50 23 45 28 60 13 45 28 37 36 -1001-3000 h 54 22 61 15 48 28 53 23 57 19 56 20 59 17 51 25 38 38 -3001-10000 h 46 39 58 27 43 42 49 36 50 35 46 39 54 31 50 35 41 44 -p-value 0.042 0.076 0.006 0.002 0.088 0.036 0.019 0.549 0.950 -200-1000 h Left ear 51 22 60 13 52 21 60 13 48 25 51 22 56 17 46 27 34 39 -1001-3000 h 43 33 57 19 46 30 55 21 52 24 55 21 61 15 51 25 39 37 -3001-10000 h 42 43 48 37 41 44 50 35 47 38 47 38 55 30 44 41 40 45 -p-value 0.032 0.001 0.013 0.005 0.187 0.047 0.062 0.118 0.812 -AC: air conduction; BC: bone conduction
Figure 5. Sound intensity-frequency relationship in the air conduction hearing of the right ear according to aircraft type
Frequency (KHz) 0 1 2 3 4 5 6 7 8 9 0 5 10 15 20 Sound intensit y (dB) Helicopter Jet Propeller
Figure 6. Sound intensity-frequency relationship in the the air conduction hearing of the left ear according to aircraft type
Frequency (KHz) 0 1 2 3 4 5 6 7 8 9 0 5 10 15 20 25 Sound intensit y (dB) Helicopter Jet Propeller Table 4. Comparison of p-values and hearing loss at 1-8 kHz air conduction and bone conduction among the groups according to aircraft type
1 kHz 2 kHz 3 kHz 4 kHz 6 kHz 8 kHz AC BC AC BC AC BC AC BC AC BC AC BC Hearing loss - + - + - + - + - + - + - + - + - + - + - + - +
Helicopter Right ear 50 38 60 28 56 32 63 25 62 26 61 27 66 22 60 28 42 46 -Jet 49 24 57 16 46 27 52 21 47 26 44 29 55 18 41 32 36 37 -Propeller 53 20 63 10 45 28 49 24 49 24 43 30 53 20 45 28 40 33 -p-value 0.091 0.022 0.979 0.83 0.707 0.336 0.936 0.283 0.602 -Helicopter Left ear 48 40 57 31 53 35 64 24 55 33 54 34 63 25 54 34 41 47 -Jet 40 33 54 19 44 29 49 24 48 25 47 26 52 21 43 30 36 37 -Propeller 49 24 55 18 43 30 53 20 45 28 52 21 57 16 45 28 37 36 -p-value 0.174 0.254 0.993 0.665 0.883 0.382 0.553 0.912 0.837 -AC: air conduction; BC: bone conduction
difference was detected among the groups between hemoglobin levels, total cholesterol levels, arterial blood pressure measure-ments, diabetes mellitus, smoking, and hearing loss.
Discussion
In our study, it was seen that age, flight hours, and the aircraft type flown correlated with hearing loss in pilots; in particular, a high frequency hearing loss.
Hearing loss has been linked to noise in most studies on avia-tion-related hearing loss (5-9). The most intensive noise prob-lem in aviation is seen in high-performance combat aircrafts, propeller aircrafts, and helicopters. The noise that they create in the environment arises during lift off, landing, low flying, and firing duties.Although it changes with aircraft type and dis-tance, the noise level is reported to be 120-160 dB on average and approximately 70 dB in civil aviation (1). Besides this, audi-tory sensation begins to decrease within the 1000-6000 Hz fre-quency interval over the age of 30 years as a result of aging (2). Lindgren and Wieslander (5) evaluated hearing of pilots in a Swedish commercial airline and revealed that the impact of age on hearing loss was not different from that in the normal pop-ulation without noise exposure. It was seen that noise exposure
levels and duration of noise exposure for the pilots were below Swedish occupational standards. In accordance with this study, Büyükçakir (10) found no significant relationship between age and hearing loss in Turkish pilots.
Nair et al. (8), in the study conducted on 1000 personnel in the Indian Military Forces, obtained significant results at all frequencies when they evaluated the relationship between age and hearing loss. Kuronen et al. (6), in the study among Finn-ish military pilots, found the hearing loss level to be 60 dB. In our study, the hearing levels of the pilots were not compared with the normal population. Although the mean hearing loss for 4 KHz was below 60 dB, a significant difference was detected among the groups at the frequencies between 1–8 KHz with regard to hearing loss among the groups formed according to age. It was also seen in the multivariate analysis results that age was effective on hearing loss at all frequencies and in both ears. Another factor considered to be effective on hearing loss in avi-ation is the aircraft type flown.
Raynal et al. (7), in the study conducted on jet, transport, and helicopter pilots in France, found that even if transport pilots flew longer, the threshold values at 8 KHz frequency were better Table 5. Mean values of hearing thresholds among the groups according to age, flight hours, and aircraft type
1 KHz 2 KHz 3 KHz 4 KHz 6 KHz 8 KHz AC (dB) BC (dB) AC (dB) BC (dB) AC (dB) BC (dB) AC (dB) BC (dB) AC (dB) p
Age 25-34 years Right ear 4.81 3.67 4.63 3.49 5.9 7.16 5.42 11.08 9.75 0.001** groups 35-44 years 7.72 6.04 7.65 6.6 9.87 12.96 10.43 16.29 14.01
45-54 years 8.35 6.5 9.28 8.14 14.07 20.78 17.92 23.07 24.57 25-34 years Left ear 6.14 4.75 4.81 3.55 7.28 7.65 5.96 10.6 10.42 35-44 years 7.9 6.41 8.64 6.79 10.8 13.76 11.29 16.29 14.32 45-54 years 8.57 7.28 10.71 9.14 16.28 21.21 18.07 27.35 26.5
Flight 200-1000 h Right ear 5.89 4.38 4.93 3.76 6.3 8.69 6.5 12.39 11.5 0.04* hour 1001-3000 h 5.85 4.53 6.05 4.93 7.36 9.93 8.09 15.06 13.81
3001-10000 h 8.64 6.88 9.82 8.76 14.76 20.11 17.17 21.23 20.88 200-1000 h Left ear 5.75 4.45 4.93 3.63 7.12 8.08 6.3 12.26 11.84 1001-3000 h 7.69 5.98 6.71 5.32 9.4 11.51 9.32 15.39 13.68 3001-10000 h 8.76 7.58 11.52 9.58 16.29 20.82 17.7 24.11 23.23
Aircraft Helicopter Right ear 7.44 5.56 8.4 7.1 11.53 15.96 13.52 18.92 18.63 0.001** type Jet 6.3 4.93 6.57 5.41 8.15 10.61 8.35 14.1 13.56
Propeller 6.78 5.47 5.95 5.13 9.1 12.6 10.27 15.89 14.17 Helicopter Left ear 7.61 6.42 10.17 8.4 13.8 17.04 14.31 20.85 20.73
Jet 7.05 5.27 7.19 5.34 8.9 11.71 9.31 15 13.08
Propeller 7.73 6.5 5.89 4.86 10.34 12.05 10.06 16.23 15.06 p 0.01* 0.001** 0.04* 0.036* 0.02* 0.001** AC: air conduction; BC: bone conduction
than the other pilots. They also found that in general, left ear thresholds were lower in all groups and that the threshold val-ues at 3 KHz frequency were low in helicopter pilots who had longer flight hours.
In the study of Büyükçakır (10), conducted on Turkish pilots, a significant relationship could not be detected between the air-craft type and hearing loss. Similarly, Fitzpatrick (9) also could not find any significant relationship between aircraft type and hearing loss in American pilots. When the seating plan of the pilots in the aircraft is considered, their left ears are more close to the window. Therefore, the left ear is more affected than the right ear from the noise in the aircraft and airport noise. In accordance with the literature, according to the statistical re-sults in which mean values for all frequencies with regard to aircraft type were compared, while only 4 KHz air and bone conduction results in the right ear was significant, hearing loss results of the air conduction hearing of the left ear at all fre-quencies between 2-8 KHz and left ear bone conduction at 2 KHz and 4 KHz frequencies were found significant. Hearing thresholds of helicopter pilots were lower than other groups. It was also seen in the multivariate analysis results that aircraft type was effective on hearing loss at all frequencies and in both ears.
In the study conducted on Turkish pilots, Büyükçakir (10) de-tected significant differences between hearing loss levels and flight hours. Kuronen et al. (6), in the study among Finnish mil-itary pilots, also found significant differences among the groups formed according to the flight hours (200-10000 hours) at 1, 2, and 4 KHz frequencies. Similarly Nair et al. (8), in the study they conducted on the Indian Military Forces, also obtained sig-nificant results at all frequencies when they evaluated the rela-tionship between flight hours and hearing loss. In our study, in accordance with the literature when flight hours were consid-ered, statistically significant differences among the groups were detected at all frequencies observed between 1-8 KHz.
There are studies on pilots conducted in the literature with re-gard to smoking and hearing loss. Lindgren and Wieslander (5) have found the impact of smoking on hearing loss not different from the normal population not having noise exposure. Nair et al. (8) detected the impact of smoking on hearing loss as signifi-cant. Ren et al. (11) and Shargorodsky et al. (12) in their studies could not detect a significant relationship between smoking and hearing loss. We also did not obtain a significant result about smoking. In line with this information, it may be concluded that smoking is not a primary cause of hearing loss, but rather a fac-tor increasing hearing loss.
With regard to systemic diseases, Vicente et al. (13) found a significant relationship between blood glucose levels of workers and high frequency hearing loss. Ren et al. (11) found statisti-cal difference in hearing loss at 4 KHz and 8 KHz frequencies
in middle-aged smoking patients with type 2 diabetes mellitus. Boomsma and Stolk (14) have shown in their studies that dia-betes affects hearing loss. In our study, 23 pilots had a diagnosis of diabetes mellitus. 65% of the pilots had hearing loss at 4 KHz in the right ear and 52% of them had hearing loss in the left ear; however, the impact of diabetes on hearing loss was not significant. We are of the opinion that pilots should be regularly examined taking into consideration that keeping blood glucose levels under control may increase hearing loss.
In the study of Yousefi Rizi and Hassanzadeh (15), they inves-tigated the effect of hypertension on the formation of noise in-duced hearing loss in 80 workers from different jobs. A signifi-cant relationship was found between hypertension and hearing loss. Saad et al. (16) also found a significant relationship in workers between hearing loss, hypertension, and body mass in-dex. Boomsma and Stolk (14) also indicated that hypertension and anemia were risk factors for hearing loss; however, there was no significant relationship between them. While Shar-gorodsky et al. (12) did not detect a significant relationship between hypertension, diabetes mellitus, smoking, obesity, and hearing loss, they indicated a low risk, but significant relation-ship, between hypercholesterolemia and hearing loss. We also did not detect a significant relationship in our study between hypertension, hypercholesterolemia, anemia, body mass index, and hearing loss. We can link this to the necessity of pilots to watch their weights since they are not allowed to fly in case of obesity.
Another reason for hearing loss occurrence in pilots is seen to be the barotrauma effect (17-19). One of the limitations of our study was that we could not obtain information about the baro-trauma histories of pilots due to the fact that we could not in-terview the pilots individually or by way of questionnaire since the study was retrospective. Another limitation of the study was that the hearing losses of the pilots were not compared with a control group or normal population.
Conclusion
In conclusion, it can be considered that an increase in the age of pilots and duration of exposure to noise causes hearing loss at particularly high frequencies. This makes us think that when hearing losses at frequencies involving speech frequency prog-ress, speech tests would be affected. It was observed that pilots, particularly helicopter pilots, were under a high risk depending on the aircraft type and that, in particular, left ear hearing loss was higher. Although we could not obtain information about the use of hearing protection, it may be concluded that it is nec-essary to use hearing protection since hearing loss, particularly at high frequencies, was found to be significant. In line with this information, it must be indicated that the pilots should protect themselves from the potential noise sources in their social lives in addition to occupational noise as generally, the primary cause of hearing loss and the sense of responsibility should be devel-oped for preventing cochlear damage that may occur.
Ethics Committee Approval: Ethics committee approval was received for this study from the ethics committee of Başkent University Insti-tutional Review Board and Ethics Committee (Project no: KA13/257) and supported by Başkent University Research Fund.
Informed Consent: Written informed consent was not obtained from patients who participated in this retrospective study.
Peer-review: Externally peer-reviewed.
Author Contributions: Concept - H.A., E.A., S.T.B.; Design - H.A., E.A.; Supervision - H.A., E.A., S.T.B.; Resources - H.A., E.A., S.T.B.; Materials - H.A., E.A., S.T.B.; Data Collection and/or Processing - H.A.; Analysis and/or Interpretation - H.A., E.A., S.T.B.; Literature Search - H.A., S.T.B.; Writing Manuscript - H.A., E.A., S.T.B.; Crit-ical Review - H.A., E.A., S.T.B.
Acknowledgements: The authors would like to thank Mustafa Agah Tekindal for his support for performing statistical analysis of this study. Conflict of Interest: No conflict of interest was declared by the au-thors.
Financial Disclosure: The authors declared that this study has re-ceived no financial support.
References
1. Toprak R, Aktürk N. Gürültünün insan sağlığı üzerindeki olum-suz etkileri. Türk Hij Den Biyol Derg 2004; 61: 49-58.
2. Şenkal ÖA, Aydın E. Havacılıkta işitme ve gürültüye bağlı işitme kayıpları. KBB ve BBC Dergisi 2013; 21:47-54.
3. Stangerup E, Klokker M, Vesterhauge S, Jayaraj S, Rea P, Harcourt J. Point prevalence of barotitis and its prevention and treatment with nasal balloon inflation: a prospective, controlled study. Otol Neurotol 2004; 25: 89-94. [CrossRef]
4. Rosenkvist L, Klokker M, Katholm M. Upper respiratory infec-tions and barotraumas in commercial pilots: a retrospective survey. Aviat Space Environ Med 2008; 79: 960-3. [CrossRef]
5. Lindgren T, Wieslander G. Hearing status among commercial pi-lots in a Swedish airline company. Int J Audiol 2008; 47: 515-9.
[CrossRef]
6. Kuronen P, Toppila E, Starck J. Modelling the risk of noise-in-duced hearing loss among military pilots. Int J Audiol 2004; 43: 79-84. [CrossRef]
7. Raynal M, Kossowski M, Job A. Hearing in military pilots: one-time audiometry in pilots of fighters, transports, and helicopters. Aviat Space Environ Med 2006; 77: 57-61.
8. Nair LC, Mshl AV, Kashyap RC. Prevalence of noise induced hearing loss in Indian Air Force Personnel. MJAFI 2009; 65:
247-51. [CrossRef]
9. Fitzpatrick DT. An analysis of noise-induced hearing loss us army helicopter pilots. Aviat Space Environ Med 1988; 59: 937-41. 10. Büyükçakir C. Hearing loss in Turkish aviators. Mil Med 2005;
170: 572-6. [CrossRef]
11. Ren J, Zhao P, Chen L, Xu A, Brown SN, Xiao X. Hearing loss in middle-aged subjects with type 2 Diabetes Mellitus. Arch Med Res 2009; 40: 18-23. [CrossRef]
12. Shargorodsky J, Curhan SG, Eaver R, Curhan GC. A Prospective study of cardiovascular risk factors and incident hearing loss in men. Laryngoscope 2010; 120: 1887-91. [CrossRef]
13. Vicente-Herrero MT, Lladosa Marco S, Ramírez-Iñiguez de La Torre MV, Terradillos-García MJ, López-González ÁA. Evalua-tion of hearing loss parameters in workers and its relaEvalua-tionship with fasting blood glucose levels. Endocrinol Nutr 2014; 61: 255-63.
[CrossRef]
14. Boomsma LJ, Stolk RP. The frequency of hearing impairment in patients with diabetes mellitus type 2. Ned Tijdschr Geneeskd 1998; 142: 1823-5.
15. Yousefi Rizi HA, Hassanzadeh A. Noise exposure as a risk factor of cardiovascular diseases in workers. J Educ Health Promot 2013; 31: 14. [CrossRef]
16. Saad MM, Hussein MS, Hammam HM. Study of noise, hearing impairment and hypertension in Egypt. Ann Saudi Med 1994; 14: 307-11.
17. Senkvist LR, Klokker M, Atholm KM. Upper respiratory infec-tions and barotraumas in commercial pilots: a retrospective survey. Aviat Space Environ Med 2008; 79: 960-3. [CrossRef]
18. Henry JL. When the Envelope Pushes Back: A combat aviator experiences barotrauma after descending with an ear block. Mil Med 2008; 173: 403-5. [CrossRef]
19. Klokker M, Vesterhauge S, Jansen EC. Pressure-equalizing ear-plugs do not prevent barotrauma on descent from 8000 ft cabin altitude. Aviat Space Environ Med 2005; 76: 1079-82.