REPUBLIC OF TURKEY DİCLE UNIVERSITY
GRADUATE SCHOOL OF NATURAL AND APPLIED SCIENCES
DEVELOPMENT OF SENSITIVE ANALYTICAL METHODS FOR
BISMUTH DETERMINATION BY ATOMIC SPECTROMETRIC
TECHNIQUES
Ersin KILINÇ
IN PARTIAL FULFILLMENT OF THE REQUIREMENTS FOR
THE DEGREE OF DOCTOR OF PHILOSOPHY IN
CHEMISTRY
DİYARBAKIR JUNE 2012
REPUBLIC OF TURKEY DİCLE UNIVERSITY
GRADUATE SCHOOL OF NATURAL AND APPLIED SCIENCES DİYARBAKIR
DEVELOPMENT OF SENSITIVE ANALYTICAL METHODS FOR BISMUTH DETERMINATION BY ATOMIC
SPECTROMETRIC TECHNIQUES
submitted by Ersin KILINÇ in a partial fulfillment of the requirements for the degree of Doctor of Philosophy in Chemistry Department, Dicle University by examining committee.
Examining Committee Members
Prof. Dr. Recep ZİYADANOĞULLARI (Chairman) ………..
Prof. Dr. Alaaddin ÇUKUROVALI ………..
Prof. Dr. Berrin ZİYADANOĞULLARI ………..
Assoc. Prof. Dr. Fırat AYDIN (Supervisor) ………..
Assoc. Prof. Dr. Ali SATAR ………..
Approval of the Graduate School of Natural and Applied Sciences
25/06/2012
Prof. Dr. Hamdi TEMEL Director of Instutue
DEVELOPMENT OF SENSITIVE ANALYTICAL METHODS FOR BISMUTH DETERMINATION BY ATOMIC
SPECTROMETRIC TECHNIQUES
I certify that this thesis satisfies all the requirements as a thesis for the degree of Doctor of Philosophy.
………..
Prof. Dr. Berrin ZİYADANOĞULLARI Head of Department
This is to certify that we have read this thesis and that in our opinion it is fully adequate, in scope and quality, as a thesis for the degree of Doctor of Philosophy.
……….. ………..
Assoc. Prof. Dr. Fırat AYDIN Prof. Dr. O. Yavuz ATAMAN
Supervisor Co-advisor
I hereby declare that all information in this document has been obtained and presented in accordance with academic rules and ethical conduct. I also declare that, as required by these rules and conduct, I have fully cited and referenced all materials and results that are not original to this work.
……….. Ersin KILINÇ
I
ACKNOWLEDGEMENT
I am deeply grateful to Prof. Dr. O Yavuz ATAMAN and Assoc. Prof. Dr. Fırat AYDIN for their excellent supervision, help, guidance and encouragement they provided throughout my thesis. They always supported me by giving valuable suggestions throughout all stages of this thesis.
I owe my most sincere gratitude to Prof. Dr. Berrin ZİYADANOĞULLARI, Head of the Department of Chemistry, who gave me important guidance and helping during my thesis. Her kind support has been of great value in this thesis.
I warmly thank to Prof. Dr. Recep ZİYADANOĞULLARI, Rector of Siirt University, for his important support. In many ways he has always encouraged me. I am deeply grateful for his invaluable guidance throughout all stages of this thesis.
I wish to special thanks to Assoc. Prof. Dr. Sezgin BAKIRDERE for his expert advice and constructive comments in all possible ways and contribution in each part of this study.
My sincere thanks are due to the supervisory committee members, Prof. Dr. Recep ZİYADANOĞULLARI, Prof. Dr. Alaaddin ÇUKUROVALI, Prof. Dr. Berrin ZİYADANOĞULLARI, Assoc. Prof. Dr. Fırat AYDIN, Assoc. Prof. Dr. Ali SATAR, Assoc. Prof. Dr. Işıl AYDIN and Assoc. Prof. Dr. Sezgin BAKIRDERE for their detailed review, constructive and excellent advice during the preparation of thesis.
I am deeply grateful to AtaMAn Research group members, Assist. Prof. Dr. Yasin ARSLAN, Emrah YILDIRIM, Pınar AKAY, Selin BORA, Şefika EROĞLU and Feriye ŞENOL for their help, support and friendship.
I also would like to thank to Assist. Prof. Dr. M. Zahir DÜZ and Assoc. Prof. Dr. Osman AKBA for their support during the thesis, and researchers at Laboratory of Chemical Analysis in Chemistry Department-Dicle University.
Special thanks to my friend and roommate Dr. Murat YAVUZ from Dicle University, Department of Chemistry both his support and motivation to me during thesis and his friendship from we met.
The financially supportes of the Dicle University Research Fund through grant DÜBAP 10-FF-31 and Technological Research Council of Turkey (TUBITAK-BİDEP) through scholarship during thesis are gratefully acknowledgement.
Last but not the least; I would like to thank my wife, Mutlu, for her unwavering support during the many long days which went into this endeavor. She provided continuous understanding, patience and love.
III
V CONTENTS Page ACKNOWLEDGEMENT I CONTENTS V ABSTRACT XI ÖZET XV
LIST of TABLES XIX
LIST of FIGURES XXIII
LIST of ABBREVIATIONS XXXIII
1. INTRODUCTION 1
1.1. Bismuth 2
1.1.1. Bismuth and Health 3
1.2. Atomic Absorption Spectrometry 3
1.2.1. Long Path Absorption Tube (LPAT) 5
1.2.2. Delves’s Microsampling Cup 6
1.2.3. Slotted Quartz Tube 6
1.2.4. In situ Atom Trapping 9
1.2.5. Chemical Vapour Generation 14
1.2.6. Atom Trapping Hyphenated with Hydride Generation 16 1.3. Inductively Coupled Plasma - Optical Emission Spectrometry 18 1.3.1. Hydride Generation Hyphenated with Inductively Coupled Plasma
Optical Emission Spectrometry
20
2. LITERATURE SURVEY 23
2.1. Bismuth Determination 23
3. MATERIAL and METHODS 31
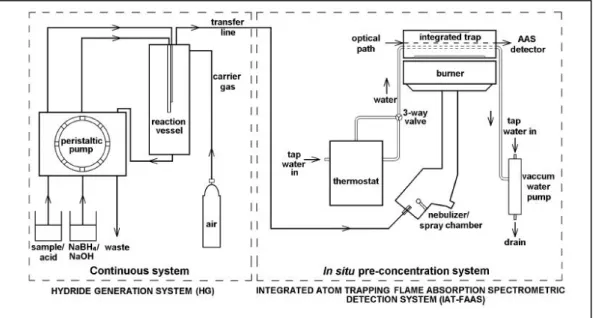
3.1. Instrumentation 31
3.2. Chemical and Regents 32
3.3. Sampling 33
3.4. Coating Procedure for SQT 33
4. RESULTS and DISCUSSIONS 35
4.1. Optimization of FAAS Conditions for Determination of Bi 36 4.1.1. Investigation of Fuel Flow Rate for FAAS Determination of Bi 36 4.1.2. Investigation of Suction Rate of Sample Solution for FAAS
Determination of Bi
36
VII
4.2. Optimization of SQT-FAAS Conditions for Determination of Bi 38 4.2.1. Investigation of Fuel Flow Rate for SQT-FAAS Determination of Bi 38 4.2.2. Investigation of Suction Rate of Sample Solution for SQT-FAAS
Determination of Bi
39 4.2.3. Investigation of Height of SQT from Burner Head for SQT-FAAS
Determination of Bi
39
4.2.4. Calibration Plot for Bi in SQT-FAAS Method 40
4.3. Optimization of SQT-AT-FAAS Conditions for Determination of Bi 42 4.3.1. Effect of Organic Solvent for SQT-AT-FAAS Determination of Bi 42 4.3.2. Investigation of Volume of Organic Solvent for SQT-AT-FAAS
Determination of Bi
43 4.3.3. Investigation of Sample Suction Rate for SQT-AT-FAAS
Determination of Bi
44 4.3.4. Investigation of Fuel Flow Rate for SQT-AT-FAAS Determination of
Bi
45 4.3.5. Optimization of Height of SQT from Burner Head for SQT-AT-FAAS
Determination of Bi
46 4.3.6. Investigation of Trapping Period for SQT-AT-FAAS Determination of
Bi
47
4.3.7. Calibration Plot for Bi in SQT-AT-FAAS Method 47
4.3.8. Accuracy Check for SQT-AT-AAS Method and Application to Real Samples
50
4.3.9. Interference Studies for SQT-AT-AAS Method 51
4.4. Optimization of Metal Coated SQT-FAAS Conditions for Determination of Bi
54 4.4.1. Investigation of Coating Metal for Metal Coated SQT-AAS
Determination of Bi
54 4.4.2. Investigation of Fuel Flow Rate for W Coated SQT-FAAS
Determination of Bi
55 4.4.3. Investigation of Sample Suction Rate for W Coated SQT-FAAS
Determination of Bi
56 4.4.4. Investigation of Height of SQT from Burner Head for W Coated
SQT-FAAS Determination of Bi
56 4.4.5. Calibration Plot for Bi by W Coated SQT-FAAS Method 57 4.5. Optimization of of Metal Coated SQT-AT-FAAS Conditions for
Determination of Bi
59 4.5.1. Investigation of Coating Material on Metal Coated SQT-AT-FAAS 59 4.5.2. Effect of Organic Solvent for W Coated SQT-AT-FAAS Determination
of Bi
IX
4.5.3. Investigation of Volume of Organic Solvent for W coated SQT-AT-FAAS Determination of Bi
60 4.5.4. Investigation of Sample Suction Rate for W coated SQT-AT-FAAS
Determination of Bi
60 4.5.5. Investigation of Fuel Flow Rate for W coated SQT-AT-FAAS
Determination of Bi
61 4.5.6. Investigation of Height of SQT from Burner Head for W coated
SQT-AT-FAAS Determination of Bi
62 4.5.7. Investigation of Trapping Period for W coated SQT-AT-FAAS
Determination of Bi
63 4.5.8. Calibration Plot for W Coated SQT-AT-AAS Method 63 4.5.9. Accuracy Check for W Coated SQT-AT-AAS Method and Application
to Real Samples
66 4.6. Interference Studies for W Coated SQT-AT-AAS Method 66
4.7. Evaluation of System Perfomance 70
4.8. Size Optimization for SQT 72
4.9. Optimization of Continuous Flow Hydride Generation Inductively Coupled Plasma - Optical Emission Spectrometry for Determination of Bi
74
4.9.1. Effect of Variables in Hydride Generation Efficiency 74
4.9.2. Optimization of Instrumental Parameters 75
4.9.3. Interference Studies on CF-HG-ICP-OES 78
4.9.4. Analytical Figures of Merit 80
4.9.5. Application of CF-HG-ICP-OES for Determination of Bi in Milk 82
5. CONCLUSION 83
6. REFERENCES 87
XI
ABSTRACT
DEVELOPMENT OF SENSITIVE ANALYTICAL METHODS FOR BISMUTH DETERMINATION BY ATOMIC SPECTROMETRIC TECHNIQUES
Ersin Kılınç Ph.D. Thesis DİCLE UNIVERSITY
GRADUATE SCHOOL OF NATURAL AND APPLIED SCIENCES DEPARTMENT OF CHEMISTRY
2012
Development of sensitive and economical analytical methods for determination of bismuth (Bi) by using flame atomic absorption spectrometry (FAAS) and improvement the sensitivity of inductively coupled plasma optical emission spectrometry (ICP-OES) for Bi were the main purposes of the thesis.
An uncoated slotted quartz tube (SQT) device with two slots with an angle of 180° with respect to each other was used for sensitivity improvement in the initial stages of research. Uncoated SQT was also used for atom trapping (SQT-AT) studies. Then, several coating materials were used to modify the surface of SQT. These coatings materials were selected among the metals or metal oxides with relatively high melting and boiling points to assure their persistence on the surface of SQT during analytical procedures. Experimental variables such as acetylene flow rate, sample suction rate, height of SQT from burner, type and volume of organic solvent for revolatilization of Bi from SQT and trapping time of Bi solution in were optimized. By using double slotted SQT, sensitivity of FAAS was improved as 2.9 times.
Further improvement in sensitivity was achieved using SQT as atom trapping device. It was decided to use of 50.0 µL of methyl ethyl ketone for the revolatilization of Bi from SQT surface. Using the optimum parameters, linear calibration range was determined as 7.5-100.0 ng mL-1 for Bi. Enhancement, E, with respect to FAAS was found as 256 by SQT-AT-FAAS. By considering the 6.0 min collection of Bi solution at 6.0 mL min-1 sample flow rate Et and Ev values were calculated as 43 min-1 and 7.1 mL-1, respectively.
Non-volatile elements, Mo, Zr, W and Ta were tried as coating metal for SQT. It was observed that W coated SQT gave the highest absorption signal for Bi. LOD and LOQ were calculated as 0.14 and 0.46 µg mL-1, respectively. Enhancement factor was calculated as 4.0
XIII
W coated SQT was also used as trapping device for Bi in FAAS. Trapping of Bi for 5.0 min at sample flow rate of 5.5 mL min-1, LOD and LOQ were calculated as 0.51 ng mL-1 and 1.7 ng mL-1, respectively. Characteristic concentration was calculated as 1.4 ng mL-1. Enhancement, E, with respect to FAAS was 613.
The possible interference effects of the various cations and anions were investigated for SQT-AT-FAAS and W coated SQT-AT-FAAS. The accuracy of the techniques was checked by analyzing a standard reference material of simulated fresh water (NIST 1643e).
In addition, SQT devices with different inner and outer diameters were tested in order to investigate the possible effect on Bi singal depending on the wall thickness of the tube. Variation in Bi signal depending on length of upper slit was also investigated.
Experimental and instrumental variables in CF-HG-ICP-OES were optimized for Bi determination. LOD and LOQ were found as 0.16 ng mL-1 and 0.53 ng mL-1, respectively. 12 times improvement with respect to conventional ICP-OES from slope ratio of linear calibration plots was achieved by optimizing of CF-HG-ICP-OES. Possible interferences effects of Cd, Co, Cu Fe, Ni, As, Hg, Sn and Sb ions in the determination of Bi by CF-HG-ICP-OES were investigated.
Keywords: Flame Atomic Absorption Spectrometry, Bi, Slotted Quartz Tube, Atom Trapping,
Sensitivity Improvement, Continuous Flow Hydride Generation, Inductively Coupled Plasma Optical Emission Spectrometry
XV
ÖZET
ATOMİK SPEKTROMETRİK TEKNİKLER İLE
BİZMUT TAYİNİ İÇİN DUYARLI ANALİTİK YÖNTEMLERİN GELİŞTİRİLMESİ
Ersin Kılınç Ph.D. Thesis DİCLE ÜNİVERSİTESİ FEN BİLİMLERİ ENSTİTÜSÜ
KİMYA ANABİLİM DALI 2012
Alevli atomik absorpsiyon spektrometri (AAAS) ile Bizmut (Bi) tayini için duyarlı analitik ve ekonomik metotların geliştirilmesi ve (indüktif eşleşmiş plazma optik emisyon spektrometresi) İEP-OES`de Bi`un duyarlılığını arttırmak tezin asıl amacını oluşturmaktadır.
Çalışmanın ilk aşamalarında, üzerinde karşılıklı olarak 180º’lik bir açı ile iki ayrı yarık bulunan ve yüzeyi kaplanmamış yarıklı kuvars tüp (YKT) duyarlılığı artırmak amacıyla denenmiştir. Kaplı olmayan bu YKT’ler atom tuzak (AT-YKT) çalışmalarında da kullanılmıştır. Daha sonra, YKT’ün yüzeyini modifiye etmek için farklı kaplama materyalleri kullanılmıştır. Bu kaplama materyalleri analitik prosedürler esnasinda YKT yuzeyinde Bi’un tuzaklanmasının saglanmasi için ergime ve kaynama noktaları yüksek olan metal veya metal oksitler arasından seçilmiştir. Asetilen akış hızı, örnek çekiş hızı, YKT`ün alev başlığından uzaklığı, YKT yüzeyinden Bi`un yeniden uçucu hale getirilmesi için kullanılacak organik çözucünün tipi ve hacmi ve Bi çözeltisinin tuzaklama suresi gibi deneysel değişkenler optimize edilmiştir. Çift yarıklı YKT kullanılarak AAAS`nin duyarlılığında 2.9 kat iyileştirme sağlanmıştır.
YKT atom tuzaklayıcı bir aparat olarak kullanıldığında ise duyarlılıkta daha fazla artışlar sağlanmıştır. 50.0 µL metil etil ketonun YKT yüzeyinden Bi`un tekrar uçucu hale getirilmesi için kullanılmıştır. Optimum parametreleri kullanarak, Bi için lineer kalibrasyon aralığı 7.5-100.0 ng mL-1 olarak belirlenmiştir. YKT-AT-AAAS kullanarak AAAS`ye göre 256 kat duyarlılık artışı elde edilmiştir. 6.0 mL min-1 örnek akış hızında Bi`un 6.0 min boyunca toplanması ile Et ve Ev değerleri sırasıyla 43 min-1 ve 7.1 mL-1 olarak hesaplanmıştır.
Uçucu olmayan Mo, Zr, W ve Ta gibi elementler YKT için kaplama materyali olarak denenmiştir. W kapli YKT`ün Bi için en yüksek absorpsiyon sinyali verdiği belirlenmiştir. Gözlenebilme ve tayin limitleri sırasıyla 0.14 ve 0.46 µg mL-1 olarak hesaplanmıştır. AAAS`ye göre duyarlılık artışı 4.0 olarak hesaplanmıştır.
W kaplı YKT, AAAS`de Bi için atom tuzaklayıcı aparat olarak da kullanılmıştır. 5.5 mL dak-1 akış hızında 5.0 min süre ile Bi`un tuzaklanması ile gözlenebilme sınırı ve tayin sınırı
XVII
sırasıyla 0.51 ng mL-1 ve 1.7 ng mL-1 olarak hesaplanmıştır. Karakteristik konsantrasyon değeri 1.4 ng mL-1 olarak bulunmuştur. AAAS` ye göre 613 katlık bir duyarlılık artışı sağlanmıştır.
Değişik katyon ve anyonların olası girişim etkileri AT-AAAS ve W kaplı YKT-AT-AAAS için incelenmiştir. Tekniklerin doğruluğu standart referans su örneğine (NIST 1643e) uygulanması ile kontrol edilmiştir.
YKT tüp duvarının kalınlığına bağlı olarak Bi sinyalindeki olası farklılıkları araştırmak için farklı iç ve dış çaplara sahip YKT`ler denenmiştir. Üst yarık uzunluğuna bağlı olarak Bi sinyalindeki değişiklikler de araştırılmıştır.
Bi tayini icin sürekli akış-hidrür oluşturmalı indüktif eşleşmiş plazma optik emisyon spektrometrisinde (SA-HO-İEP-OES) deneysel ve instrumental değişkenler optimize edilmiştir. Gözlenebilme ve tayin sınırları sırası ile 0.16 ng mL-1 and 0.53 ng mL-1 olarak bulunmuştur. SA-HO-İEP-OES ile ilgili parametreleri optimize ederek lineer kalibrasyon eşitliklerindeki eğim oranları uzerinden duyarlılıkta İEP-OES’e karşı 12 kat artış sağlanmıştır. SA-HO-İEP-OES ile Bi tayininde Cd, Co, Cu, Fe, Ni, As, Hg, Sn and Sb iyonlarının olası girişim etkileri araştırılmıştır.
Anahtar Kelimeler: Alevli Atomik Absorpsiyon Spektrometri, Bi, Yarıklı Kuvars Tüp, Atom
Tuzaklama, Duyarlılık Artışı, Sürekli Akışlı Hidrür Oluşturma, İndüktif Eşleşmiş Plazma Optik Emisyon Spektrometri
XIX
LIST of TABLES
Table No Page
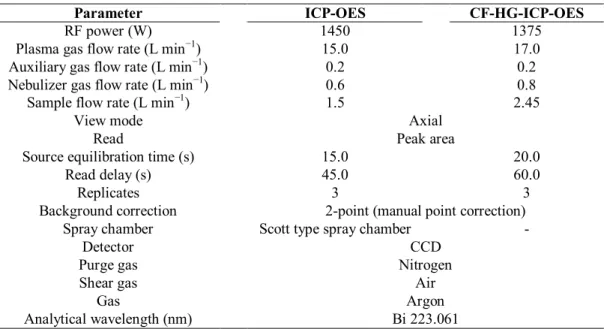
Table 1.1. Physical and chemical proporties of Bi (NAS-NS 1977, Sun 2011) 2 Table 3.1. Operating parameters of Bi hollow cathode lamp for FAAS 31 Table 3.2. Operating conditions of ICP-OES and CF-HG-ICP-OES for Bi determination 32
Table 4.1. Analytical characteristics of FAAS for Bi 38
Table 4.2. Conditions of SQT-FAAS method for Bi 40
Table 4.3. Analytical performance of SQT-FAAS for Bi 41
Table 4.4. Effect of organic solvents on 100.0 ng mL -1
Bi signal for SQT-AT-FAAS
method 42
Table 4.5. Conditions for SQT-AT-FAAS method for Bi 47
Table 4.6. Analytical performance of SQT-AT-FAAS for Bi (36.00 mL trapping, 6.0 min
collection) 49
Table 4.7. Results of the accuracy test for SQT-AT-FAAS method 50 Table 4.8. Concentration of Bi in water samples by SQT-AT-FAAS 50 Table 4.9. Effect of interfering ions on 75.0 ng mL–1 of Bi by SQT-AT-FAAS 54 Table 4.10. Effect of coating material on 10.0 µg mL
-1
Bi signal for metal coated
SQT-FAAS method. 55
Table 4.11. Conditions for W coated SQT-FAAS method for Bi 57 Table 4.12. Analytical performance of W coated SQT-FAAS for Bi 59 Table 4.13. Effect of organic solvents on 20.0 ng mL
-1
Bi signal for W coated
SQT-AT-FAAS method 59
Table 4.14. Conditions for W coated SQT-AT-FAAS method for Bi 63 Table 4.15. Analytical performance of W coated SQT-AT-FAAS for Bi 65 Table 4.16. Results of the accuracy test for Bi by W coated SQT-AT-FAAS method (n=3) 66 Table 4.17. Effect of interfering ions on 20.0 ng mL
–1
of Bi in W coated SQT-AT-FAAS
method 70
Table 4.18. Analytical features of optimized methods 72
Table 4.19. Effect of size of SQT on 10.0 µg mL -1
of Bi signal (length of SQT was 14.0
cm in all cases) 73
Table 4.20. Effect of interferent concentrations on 10.0 ng mL -1
of Bi by
CF-HG-ICP-OES 79
XXI
Table 4.22. Analytical characteristics of ICP-OES and CF-HG-ICP-OES methods for Bi
determination. 80
Table 4.23. Comparison of analytical features of optimized method versus literature 81 Table 4.24. Determination of Bi in milk samples by CF-HG-ICP-OES 82
XXIII
LIST of FIGURES
Figure No Page
Figure 1.1. Long-tube absorption cell a) open ended, b) T-shaped (Matusiewicz 1997)
5 Figure 1.2. Delves’ microsampling cup system (Lajunen 1992) 6 Figure 1.3. Schematic representation of SQT (Watling 1977) 7 Figure 1.4. Schematic representation of flame AAS-gas screen-slotted quartz tube
(Gholami et al. 2011)
8 Figure 1.5. Schematic presentation of water-cooled atom trap system (Ataman
2008)
9 Figure 1.6. Design of water cooled atom traps (a) single tube, (b) double tube and
(c) end view of triple tube (Brown et al 1987)
10 Figure 1.7. Schematic presentation of slotted-tube water-cooled atom-trap
(STWCAT) system (Matusiewicz and Kopras 1997)
11 Figure 1.8. Optimization of SQT slot positions with respect to each other for In
(Arslan et al. 2011)
13 Figure 1.9. Hydride generation with in situ preconcentration in a palladium coated
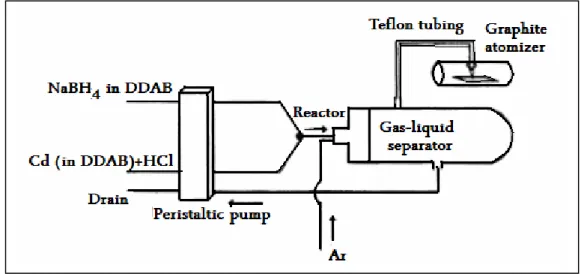
graphite atomizer for Cd determination,
DDAB:didodecyldimethylammonium bromide (Infante et al. 2006)
16
Figure 1.10. Schematic presentation of slotted quartz tube-atom trap-hydride generation atomic absorption spectrometric determination of lead (Ertaş et al. 2008)
17
Figure 1.11. Schematic presentation of quartz T-tube and W-coil trap (Kula et al. 2008)
18 Figure 1.12. Emission process of individual metal in plasma (Boss and Fredeen
2004)
18 Figure 1.13. Schematic presentation of ICP-OES instrument (Boss and Fredeen
2004)
19 Figure 2.1. Schematic presentation of hydride generation-integrated atom
trap-atomic absorpion spectrometric determination of Bi (Matusiewicz and Krawczyk 2007b)
25
Figure 2.2. Schematic presentation of W coil HG-AAS (a) general configuration (b) W-trap placed in silica T-tube (Cankur et al. 2002)
26 Figure 2.3. Schematic diagrams of gas-liquid separators for bismuth hydride (Chen
et al. 2002).
28 Figure 3.1. Schematic presentation of hydride generation manifold 32 Figure 4.1. Investigation of acetylene flow rate for FAAS determination of Bi; 20.0
µg mL-1 Bi; flow rate of air: 4.0 L min-1, sample suction rate: 5.5 mL min-1
XXV
Figure 4.2. Investigation of suction flow rate for FAAS determination of Bi; 20.0 µg mL-1 Bi, flow rate of air: 4.0 L min-1, flow rate of acetylene: 1.5 L min-1
37
Figure 4.3. Linear calibration plot for Bi in FAAS; flow rate of air: 4.0 L min-1, flow rate of acetylene: 1.5 L min-1,sample suction rate: 8.5 mL min-1
37 Figure 4.4. Investigation of acetylene flow rate for SQT-FAAS determination of
Bi; 15.0 µg mL-1 Bi; flow rate of air: 4.0 L min-1, sample suction rate: 5.5 mL min-1,2.0 mm height of SQT from burner
38
Figure 4.5. Investigation of suction rate of sample for SQT-FAAS determination of Bi; 15.0 µg mL-1 Bi, flow rate of air: 4.0 L min-1, flow rate of acetylene: 1.5 L min-1,2.0 mm height of SQT from burner
39
Figure 4.6. Investigation of height of SQT from burner for SQT-FAAS determination of Bi; 15.0 µg mL-1 Bi; flow rate of air: 4.0 L min-1, flow rate of acetylene: 1.5 L min-1,sample suction rate: 8.5 mL min-1
40
Figure 4.7. Linear calibration plot for Bi in SQT-FAAS; flow rate of air: 4.0 L min -1
, flow rate of acetylene: 1.5 L min-1,sample suction rate: 8.5 mL min-1, 2.0 mm height of SQT from burner
41
Figure 4.8. Investigation of volume of organic solvent for SQT-AT-FAAS determination of Bi; 100.0 ng mL-1 Bi; 2.0 mm height of SQT from burner, flow rate of air: 4.0 L min-1, flow rate of acetylene: 0.6 L min-1, sample suction rate: 5.5 mL min-1, 2.0min of trapping time
43
Figure 4.9. Investigation of sample suction rate for SQT-AT-FAAS determination of Bi; 100.0 ng mL-1 Bi; 2.0 mm height of SQT from burner, flow rate of air: 4.0 L min-1, flow rate of acetylene: 0.6 L min-1,2.0 min of trapping time, 50.0 µL of MEK
44
Figure 4.10. Investigation of acetylene suction rate for SQT-AT-FAAS determination of Bi; 100.0 ng mL-1 Bi; 2.0 mm height of SQT from burner, flow rate of air: 4.0 L min-1, sample suction rate: 6.0 mL min-1, 2.0min of trapping time, 50.0 µL of MEK
45
Figure 4.11. Investigation of height of SQT from burner for SQT-AT-FAAS determination of Bi; 100.0 ng mL-1 Bi; flow rate of air: 4.0 L min-1, flow rate of acetylene: 0.5 L min-1,sample suction rate: 6.0 mL min-1, 2.0min of trapping time, 50.0 µL of MEK
46
Figure 4.12. Investigation of trapping time for SQT-AT-FAAS determination of Bi; 100.0 ng mL-1 Bi; 2.0 mm height of SQT from burner, flow rate of air: 4.0 L min-1, flow rate of acetylene: 0.5 L min-1,sample suction rate: 6.0 mL min-1, 50.0 µL of MEK.
47
Figure 4.13. Analytical signals for 75.0 ng mL-1 Bi, total signal (a), corrected signal (b), D2 background signal (c) by SQT-AT-FAAS using the conditions in Table 4.5.
48
Figure 4.14. Calibration plot for Bi in SQT-AT-FAAS using the parameters in Table 4.5.
48 Figure 4.15. Linear calibration plot for Bi in SQT-AT-FAAS using the parameters in
Table 4.5.
XXVII
Figure 4.16. Interference effects of Na, Ca and Mg on 75.0 ng mL-1 of Bi signal in SQT-AT-FAAS
51 Figure 4.17. Interference effects of Mn, Cr, Fe, Zn and Al on 75.0 ng mL-1 of Bi
signal in SQT-AT-FAAS
52 Figure 4.18. Interference effects of Co, Cu, Ni and Mo on 75.0 ng mL-1 of Bi signal
in SQT-AT-FAAS
52 Figure 4.19. Interference effects of Sn, Sb and Se on 75.0 ng mL-1 of Bi signal in
SQT-AT-FAAS
53 Figure 4.20. Interference effects of SO4
2-, NO2 -and Cl- on 75.0 ng mL-1 of Bi signal in SQT-AT-FAAS 53 Figure 4.21. Investigation of acetylene flow rate for W coated SQT-FAAS
determination of Bi; 10.0 µg mL-1 Bi; flow rate of air: 4.0 L min-1, sample suction rate: 4.5 mL min-1,2.0 mm height of SQT from burner
55
Figure 4.22. Investigation of suction rate of sample for W coated SQT-FAAS determination of Bi; 10.0 µg mL-1 Bi; flow rate of air: 4.0 L min-1, flow rate of acetylene: 0.6 L min-1,2.0 mm height of SQT from burner
56
Figure 4.23. Investigation of height of SQT from burner for W coated SQT-FAAS determination of Bi, 10.0 µg mL-1 Bi; flow rate of air: 4.0 L min-1, flow rate of acetylene: 0.6 L min-1,sample suction rate: 5.6 mL min-1
57
Figure 4.24. Calibration plot for Bi by W coated SQT-FAAS method, 2.0 mm height of SQT from burner, flow rate of air: 4.0 L min-1, flow rate of acetylene: 0.6 L min-1,sample suction rate: 5.6 mL min-1
58
Figure 4.25. Linear calibration plot for Bi in W coated SQT-FAAS method, 2.0 mm height of SQT from burner, flow rate of air: 4.0 L min-1, flow rate of acetylene: 0.6 L min-1,sample suction rate: 5.6 mL min-1
58
Figure 4.26. Investigation of volume of MIBK for W coated SQT-AT-FAAS determination of Bi; 20.0 ng mL-1 Bi; 2.0 mm height of SQT from burner, flow rate of air: 4.0 L min-1, flow rate of acetylene: 0.6 L min-1, sample suction rate: 4.5 mL min-1, 2.0min of trapping time
60
Figure 4.27. Investigation of suction rate of sample for W coated SQT-AT-FAAS determination of Bi; 20.0 ng mL-1 Bi; 2.0 mm height of SQT from burner, flow rate of air: 4.0 L min-1, flow rate of acetylene: 0.6 L min-1, 2.0min of trapping time, 50.0 µL of MIBK
61
Figure 4.28. Investigation of flow rate of acetylene for W coated SQT-AT-FAAS determination of Bi; 20.0 ng mL-1 Bi; 2.0 mm height of SQT from burner, flow rate of air: 4.0 L min-1, sample suction rate: 5.5 mL min-1, 2.0min of trapping time, 50.0 µL of MIBK
62
Figure 4.29. Investigation of height of W coated SQT for W coated SQT-AT-FAAS determination of Bi; 20.0 ng mL-1 Bi; flow rate of air: 4.0 L min-1, flow rate of acetylene 0.6 L min-1,sample suction rate: 5.5 mL min-1, 2.0min of trapping time, 50.0 µL of MIBK
XXIX
Figure 4.30. Investigation of trapping period for W coated SQT-AT-FAAS determination of Bi; 20.0 ng mL-1 Bi; flow rate of air: 4.0 L min-1, flow rate of acetylene 0.6 L min-1, 2.0 mm height of SQT from burner, sample suction rate: 5.5 mL min-1, 50.0 µL of MIBK
63
Figure 4.31. Analytical signals for 20.0 ng mL-1 Bi, corrected signal (a), total signal (b), D2 background signal (c) by W coated SQT-AT-FAAS using the conditions in Table 4.14.
64
Figure 4.32. Calibration plot for Bi by W coated SQT-AT-FAAS using the conditions in Table 4.14.
64 Figure 4.33. Linear calibration plot for Bi by W coated SQT-AT-FAAS using the
conditions in Table 4.14.
65 Figure 4.34. Interference effects of Na, Ca and Mg on 20.0 ng mL-1 of Bi signal in
W coated SQT-AT-FAAS
67 Figure 4.35. Interference effects of Mn, Cr, Fe, Zn and Al on 20.0 ng mL-1 of Bi
signal in W coated SQT-AT-FAAS
67 Figure 4.36. Interference effects of Co, Cu, Ni and Mo on 20.0 ng mL-1 of Bi signal
in W coated SQT-AT-FAAS
68 Figure 4.37. Interference effects of Sn, Sb and Se on 20.0 ng mL-1 of Bi signal in W
coated SQT-AT-FAAS
69 Figure 4.38. Interference effects of SO4
and NO2
-and Cl- on 20.0 ng mL-1 of Bi signal in W coated SQT-AT-FAAS
69 Figure 4.39. Investigation of concentration of HCl; experimental conditions; 10.0 ng
mL-1 of Bi, argon flow rate: 17.0 L min-1, carrier argon flow rate 0.6 L min-1, Rf power: 1450 Watt, flow rate of standard solution, NaBH4 and waste: 1.5 mL min-1, 0.25% NaBH4 in 1.0% NaOH, reaction coil 11.0 cm, stripping coil 35.0 cm
74
Figure 4.40. Investigation of concentration of NaBH4 in 1.0 % NaOH; experimental conditions; 10.0 ng mL-1 of Bi in 5.0 mol L-1 HCl, argon flow rate: 17.0 L min-1, carrier argon flow 0.6 L min-1, Rf power: 1450 Watt, flow rate of standard solution, NaBH4 and waste: 1.5 mL min-1, reaction coil 11.0 cm, stripping coil 35.0 cm
75
Figure 4.41. Investigation of flow rate of carrier argon; experimental conditions; 10.0 ng mL-1 of Bi in 5.0 mol L-1 HCl, reductant 1.0% NaBH4 in 0.25% NaOH, argon flow rate: 17.0 L min-1, Rf power: 1450 Watt, flow rate of standard solution, NaBH4 and waste: 1.5 mL min
-1
, reaction coil 11.0 cm, stripping coil 35.0 cm
76
Figure 4.42. Investigation of RF power; experimental conditions; 10.0 ng mL-1 of Bi in 5.0 mol L-1 HCl, reductant 1.0% NaBH4 in 0.25% NaOH, argon flow rate: 17.0 L min-1, 0.5 mL min−1 of flow rate of carrier, flow rate of standard solution, NaBH4 and waste: 1.5 mL min-1, reaction coil 11.0 cm, stripping coil 35.0 cm
XXXI
Figure 4.43. Investigation of flow rates of sample solution and reductant; experimental conditions; 10.0 ng mL-1 of Bi in 5.0 mol L-1 HCl, reductant 1.0% NaBH4 in 0.25% NaOH, argon flow rate: 17.0 L min
-1 , Rf power: 1375 Watt, flow rate of waste 1.5 mL min-1, reaction coil 11.0 cm, stripping coil 35.0 cm
77
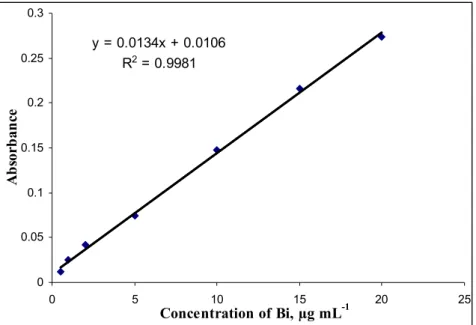
Figure 4.44. Linear calibration graph for Bi by CF-HG-ICP-OES (experimental conditions were given in Table 4.21.)
XXXIII
LIST of ABBREVIATIONS
AES Atomic Emission Spectrometry AFS Atomic Fluorescence Spectrometry
CCD Charge Coupled Device
CF-HG-ICP-OES Continuous Flow – Hydride Generation – Inductively Coupled Plasma- Optical Emission Spectrometry
CRM Certified Reference Material CVG Chemical Vapour Generation
CVAAS Cold Vapour Atomic Absorption Spectrometry DBD Dielectric Barrier Discharge
DDAB Didodecyldimethylammonium bromide DLLME Dispersive Liquid Liquid Micro Extraction EcHG Electrochemical Hydride Generation
Ec-HG-AFS Electrochemical Hydride Generation Atomic Fluorescence Spectrometry
FAAS Flame Atomic Absorption Spectrometry FDA Food and Drug Administration
FI-AAS Flow Injection - Atomic Absorption Spectrometry
GC-ICP-MS Gas Chromatography - Inductively Coupled Plasma - Mass Spectrometry
GF-AAS Graphite Furnace - Atomic Absorption Spectrometry
HG Hydride Generation
HG-AAS Hydride Generation - Atomic Absorption Spectrometry HG-AFS Hydride Generation - Atomic Fluorescence Spectrometry
HG-DBD-AFS Hydride Generation Dielectric Barrier Discharge Atomic Fluorescence Spectrometry
HG-ETV-MIP-OES Hydride Generation - Electrothermal Vaporization - Microwave Induced Plasma - Optical Emission Spectrometry
HG-ICP-OES Hydride Generation - Inductively Coupled Plasma - Optical Emission Spectrometry
XXXV
HG-N2-MIP-AES Hydride Generation-Nitrogen-Microwave Induced Plasma - Optical Emission Spectrometry
IAT Integrated Atom Trap
i.d Inner Diameter
ICP-OES Inductively Coupled Plasma - Optical Emission Spectrometry ICP-MS Inductively Coupled Plasma - Mass Spectrometry
LPAT Long-Path Absorption Tube LOD Limit of Detection
LOQ Limit of Quantification
MEK Methyl Ethyl Ketone
MIBK Methyl Isobutyl Ketone
NIST National Institue of Standard and Technology
o.d. Outer Diameter
RSD Relative Standard Deviation SEM Scanning Electron Microscopy
SQT Slotted Quartz Tube
SQT-FAAS Slotted Quartz Tube – Flame Atomic Absorption Spectrometry SQT-AT-FAAS Slotted Quartz Tube – Atom Trapping - Flame Atomic Absorption
Spectrometry
SRM Standard Reference Material
TMB Trimethyl Bismuth
TCM Traditional Chinese Medicine
THF Tetrahyrofurane
VGAAS Vapour Generation - Atomic Absorption Spectrometry WC-IAT Water Cooled - Integrated Atom Trap
ERSİN KILINÇ
1
1. INTRODUCTION
It is well known that metals either essential or not have an important role in living organism. Some of them are dangerous to health or to the environment (e.g. mercury, cadmium, lead, chromium), some may cause corrosion (e.g. zinc, lead), some are harmful in other ways (e.g. arsenic may pollute catalysts). Classification of metals depends on their concentrations in related matrixes. Some of these are actually necessary for humans at trace levels (selenium, copper, chromium, manganese) while others are carcinogenic or toxic, affecting, the central nervous system (manganese, mercury, lead, arsenic), the kidneys or liver (mercury, lead, cadmium, copper) or skin, bones, or teeth (nickel, cadmium, copper, chromium). Nowadays, a growing trend by the researchers has been focused on the speciation of certain metals such as selenium (II and IV), chromium (III and VI) and arsenic (III and V). In particular, alkylated metals and metalloids are become a matter of primary. Furthermore, elemental composition has a critical importance for alloys in view of their physical and chemical properties such as melting point, conductivity, corrosion resistance, analysis of impurities in high-purity metals etc. Thus, the concentration of metals should be defined for different matrixes such as foods, waters, plants and also anthropogenic wastes. Consequently a chemical analysis for individual species is needed.
Flame atomic absorption spectrometry (FAAS), graphite furnace atomic absorption spectrometry (GF-AAS), inductively coupled plasma optical emission spectrometry (ICP-OES), inductively coupled plasma mass spectrometry (ICP-MS) and rarely atomic fluorescence spectrometry (AFS) have been employed for the determination of metals at trace, minor and major levels. The selection of the technique is dependent on their concentrations in final solution and availability of the instrument. While AAS and ICP-OES can be used for the determination at µg mL-1 level, GF-AAS and ICP-MS can be applied for ultra trace determination of metals at the level of ng mL-1. To decide the method, total cost per analysis should be also considered by users. As a general approach, the prices of instruments which should be considered can be listed from highest to lowest one as ICP-MS, ICP-OES, ET-AAS, AAS, respectively. The most important issue which is paid sufficient attention is the detection limits of the techniques. Nowadays, ICP-MS is employed as a powerful analytical technique at the concentration level of ng mL-1 level around 8 orders of magnitude of concentration units as dynamic range from lithium to uranium. This technique is also widely used the field of radiometric dating, in which it is used to analyze relative abundance of different isotopes over the others.
On the other hand, ICP-MS or GF-AAS instruments are not often available in any laboratory, especially in developing countries. To overcome these problems, many preconcentration methods are presented in literatures. Less of these are found ways to application area, because, these are based on the use of time consuming and expensive chemical procedures. The techniques based on in situ trapping such as the use of long path absorption tubes, slotted quartz tube and vapour generation have been attempted to overcome this problem by the analytical chemists. Among them, slotted quartz tube and vapour generation by hydride formation were commercialized by manufacturers.
1. INTRODUCTION __________________________________________________
2
Up to now, there is no unique method to overcome these problems. Thus, many of the researchers have focused on solving this problem for individual elements. Among them, Bi has been received special attention by analytical chemists.
The reason of it is insufficient sensitivity of AAS for Bi. The aim of this study as a Ph.D is to development of sensitive analytical methods for Bi by flame AAS. For this purpose, an uncoated slotted quartz tube (SQT) device with two slots with an angle of 180° with respect to each other will be used for sensitivity improvement in the initial stages of research. Uncoated SQT was also used for atom trapping (SQT-AT) studies. Then, several coating materials will be used to modify the surface of SQT and sensitivity comparisons will be made. These coatings will mainly include the metals or metal oxides with relatively high melting and boiling points to assure their persistence on the surface of SQT during analytical procedures. In addition, SQT devices with different inner and outer diameters will be tested in order to investigate the possible differences in analytical behavior depending on the wall thickness of the tube. All the parameters for uncoated and coated SQT’s will also be optimized for atom trapping studies. The possible interference effects of the cations and anions will be evaluated for above mentioned techniques. The accuracy of the techniques will be checked by analyzing the standard reference samples which contains Bi.
1.1 Bismuth
Bi (New Latin bisemutum from German Wismuth, perhaps from weiße Masse, "white mass") was confused in early times with tin and lead because of its resemblance to those elements. It has been known since ancient times, so no person is credited with its discovery (Wikipedia 2012). Bi, a white, crystalline, brittle metal with a pinkish tinge, is a member of periodic table in Group V with nitrogen, phosphorus, arsenic and antimony. Bismuth has two valencies of 3+ and 5+. In the Earth's crust, bismuth, 0.00002%, is about twice as abundant as gold. Bi naturally occurs in the ore as bismite (Bi2O3), bismuthinite (Bi2S3) and bismuthtite ((BiO)2CO3) (NAS-NS 1977, Sun 2011).
Physical and chemical properties of Bi are summarized in Table 1.1.
Table 1.1. Physical and chemical proporties of Bi (NAS-NS 1977, Sun 2011)
Parameter Value Atomic number 83 Atomic weight 208.980 Density 9.8 g mL-1 Melting point 271 ºC Boiling point 1560 ºC
Electronegativity xP (Pauling scale) 2.02
Atomic radius 1.55 Å
Ionization energies, kJ mol-1 M → M+ M+ → M2+ M2+→ M3+ M3+→ M4+ M4+→ M5+ 703.2 1610 2466 4372 5400
ERSİN KILINÇ
3
Bi has attracted attention as semiconductors, medicine for treatment of syphilis, peptic ulcers and dermatological disorders, alloys, catalyst, metallurgical additives, fuel carrier, and coolant for nuclear reactor and as neutron windows in medical reactors (NAS-NS 1977, Das et al. 2006). Interestingly, Bi found an application area in cosmetic products such as pigments in eye shadow, lipsticks and hair dyes (Das et al. 2006). Bismuth salicylate is used to perserve the wine from bacteria and other harmful entities (Chineseop 2012).
China is market leader as producer of Bi with 40% market share (Wikipedia 2012a). According to the data on 2009, mine production of bismuth was 7,300 tonnes, with the major contributions from China (4,500 tonnes), Mexico (1,200 tonnes) and Peru (960 tonnes) (USGS 2010). This price of Bi mine was $28.97 per kg in 1Q 2009, $27.33 per kg in 2Q 2009, $23.77 per kg in 3Q 2009, and $27.83 in 4Q 2009 (Basicmines 2010) over the world.
1.1.1. Bismuth and Health
Dut to low absorption of Bi, it was considered as one of the least toxic heavy metals (Cadore et al. 1998; Das et al. 2006). Bismuth compounds have been used in medicine for more than 200 years in a variety of gastrointestinal disorders, because of their demulcent properties (Afkhami et al. 2006). Bi was used to treatment for syphilis, 70 years ago (Burguera et al. 1999). It has been used in medicines for the treatment of helicobactor pyloric-induced gastritis (Madrakian et al.2003). Metabolism of Bi and its compounds in humans is as yet unknown. Some of the microorganism which methylates the Bi is known components of the human intestinal microflora (Boertz et al. 2009). Due to the rather low toxicity of Bi compounds, some bismuth thiol biocides have been tested for use as disinfectors in drinking water instead of other more toxic counterparts such as copper and silver species (Codony et al. 2003).
Recently, U.S. Food and Drug Administration (FDA) announced that bismacine/chromacine, contains high amounts of bismuth, used as a purported treatment for Lyme disease can cause serious health problem such as bismuth poisoning include cardio-vascular collapse and kidney failure (FDA 2006, Wikipedia 2012b). It is highlighted that bimacine is not approved in any form for use by injection, and recommended not use its because two deaths are recorded following the use of intravenous bismacine to treat Lyme disease (Wikipedia 2012b).
1.2. Atomic Absorption Spectrometry
‘Why couldn’t atomic absorption spectra be used for elemental analysis’ was the Walsh’s question. Last six decade showed that it was an ending point.
Flame atomic absorption spectrometry (FAAS) is a well known analytical technique using for elemental analysis over the world. It is used for a number of applications such as research-development, food quality, environmental analysis, pollution control process, etc. Independently, Walsh from Australia and Alkemade and Milatz from
1. INTRODUCTION __________________________________________________
4
Netherlands published their papers about AAS in 1955 (Alkemade et al; 1955; Walsh 1955). It was accepted as a milestone for atomic spectoscopy in the further development in AAS.
An AAS instrument contains a radiation source such as hollow cathode lamp (HCL) or electrodeless discharge lamp (EDL), which emits the spectrum of the analyte element; an atomizer such as flame or graphite furnace, in which the analyte atoms in samples are atomized; a monochromator for the spectral dispersion of the radiation with an exit slit for an selection of the resonance line; a detector to measurement the intensity of radiation; an amplifier and displayer (Ewing 1960; Mester and Sturgeon 2003).
HCL is used for one element, but multi-element lamps are also commercially available. Main drawback of multi elements lamps is that often compromising operating conditions must be used, which may have an unfavorable effect on the signal-to-noise ratio and linear range for some of the analytes. EDL`s are more expensive than HCL but give higher light intensity than HCL. Higher sensitivity and enhanced detection limit were obtained for As using EDL (Mester and Sturgeon 2003).
There are two major factors which limit the sensitivity of the AAS. The first one is about the low efficiency of the conventional nebulization process. Only a small portion of sample, 1-10%, can be transported to atomizer as aerosol. The remaining part of the sample which contains analyte atoms is sent to waste. When the sample aerosol enters the atom cell, it is desolvated by flame and then it dissociates the salts present into their constituent atoms. The individual atoms of the analyte will then absorb the light emitted from the light source and the amount of light absorbed can be related to the concentration of the analyte in the sample. A mixture of air and acetylene is the common flame type. Three type of flame are employed as following: fuel rich (here a yellow flame that has reducing properties is produced), fuel lean (a blue flame that is chemically oxidizing) or stoichiometric (an intermediate flame that is blue but also has yellow “feathers” at its base). It should be optimized for each of elements. According to the type of flame, temperature changes in the range of 1700 and 2200 K. However, some refracter elements reguire higher temperature. In this case nitrous oxide– acetylene (2500–2700 K) may be employed. Another optimization is the amounts of acetylene and nitrous oxide (Mester and Sturgeon 2003; Skoog et al. 1998).
Intensity of monochromatic radiation from light source decreases when it is absorbed by detected atom. Photomultiplier tube (PMT) or solid-state electronic devices (such as a charge coupled device -CCD- or charge injection device -CID- or diode array) are employed to detect the radiation. Decreasing in intensity is given as absorbance. The absorbance is defined as the logarithm of ratio of intensity of incident power to transmitted monochromathic radiation power. Since absorption is a ratio, it has no units (Mester and Sturgeon 2003; Skoog et al. 1998).
Therefore, only a small portion of analytes can reach to burner and absorb the monochromatic radiation from light source. As a result lower analytical signal is recorded during partial nebulization. The second drawback of AAS is about the short residence time of analyte in the measurement zone. It means that less interactions of atoms with monochromatic light and therefore loss in signal. Short residence time of
ERSİN KILINÇ
5
analytes on optical path is accepted as limitation (Yaman and Akdeniz 2006; Ataman 2007; Ataman 2008). Researches have been focused to solve this problem is the cause of birth of the sensitivity enhancement methods such as atom trapping, chemical vapour generation (CVG) and also electrothermal atomizer for AAS. L’vov mentioned about this that in his paper as ‘I accidentally came across Walsh’s paper at the end of 1955’ (L’vov 2005). In 1957, graphite furnace contained a few crystals of sodium chloride used by L’vov in his first experiments (Welz 1999).
However, the sensitivity of FAAS does not meet the demands of trace and ultra-trace analysis for some samples. Attempts about sensitivity enhancement are summarized in following subsections.
1.2.1. Long-Path Absorption Tube (LPAT)
Long-path absorption tubes (LPAT) as long as a meter was suggested to enhance the sensitivity of AAS by increasing the popularity and life time of analyte atoms on optical path. LPAT are either open ended (Figure 1.1.a.) or T shaped (Figure 1.1.b.). Ten times sensitivity increasing was obtained for Pt by using T-shaped flame adaptor. Cu, Ag, Au and Cd were determined with 5.0-13.0 times sensitivity improvements by using similar one. It should be noted that the sensitivity is not proportional to the length of tube (Matusiewicz 1997; Ataman 2008). Different materials such as silica, vycor, alundum, ceramic and alumina, were used as material for LPAT. LPAT-FAAS was employed in a variety of analysis such as Cd determination in urine and blood serum, Sn in hydrogen peroxide solution, Zn in biological liquids and alloy, Se in aminoacid and protein etc (Matusiewicz 1997).
Figure 1.1. Long-tube absorption cell a) open ended, b) T-shaped (Matusiewicz 1997)
Main drawbacks of LPAT were physical limitations and strong background absorption by molecular species in the flame gases and scattering in tube. Although, favorable results were obtained and published by using LPAT, it was not commercialized (Matusiewicz 1997). In addition, memory effect was observed during the experiments (West 1988).
1. INTRODUCTION __________________________________________________
6 1.2.2. Delves’ Microsampling Cup
Delves’ cup microsampling technique was shown schematically in Figure 1.2 was developed for determination lead in biological samples. The main idea was present an alternative sample introduction over the conventional nebulization via aspiration of solution and increase the residence time of free analyte atoms in the long cylindrical tube of multislot burner positioned about 2 cm below. It required a micro amount of sample added to nickel crucible. Micro amount of sample is placed in cup and dried by holding it in flame or heated plate. Then, it is transferred to hottest region of flame to vaporize the sample. Atomic vapour from flame enters a horizontal quartz tube. It provides longer residence time of analyte atoms in optical path (Ewing 1960). It was applied to determination of some Ag, As, Bi, Cd, Se, Te, Tl and Zn (Lajunen 1992). In case of acidic materials, nickel cups must be neutralized before use or different cup made of tantalum or other inert materials should be used (Ewing 1960).
Figure 1.2. Delves’ microsampling cup system (Lajunen 1992)
Better sensitivity and longer lifetime of tube were investigated by trying stainless-steel, carbon and ceramic instead of nickel as a cup material. The use of Ir cup was recommended especially for Ag, Cu and Mn. Applications of Delves’ cup microsampling technique were extended by using nitrous oxide-acetylene flame instead of air-acetylene flame through the analysis of relatively non-volatile elements.
Although this technique was commercialized by Perkin-Elmer, it did not found a routine application in long term (Matusiewicz 1977).
1.2.3. Slotted Quartz Tube
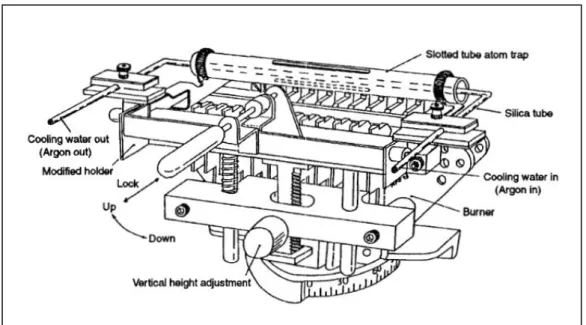
Anyone could say that SQT technique developed by Watling had obvious advantages over the LPAT and Delves’ techniques.
In 1977, Watling recommended the use of SQT for the analysis of trace metals in fresh water. Fourteen elements include Bi were investigated and sensitivity enhancements were obtained for all except for iron (Watling 1977). It was positioned above the 5 mm
ERSİN KILINÇ
7
to burner head and contained two slots (Figure 1.3.). The internal slot, near to burner, was longer from the external one which flame quit the tube from here. La solution of 1% (m/v) was used to prevent the SQT from devitrification and to increase the reusability of the tube. By using SQT, 2-5 times sensitivity enhancements were obtained (Watling 1977) for volatile elements. The increased residence time of analyte on optical path due to a slower flame speed and more interaction with together were causes the sensitivity enhancement. Although SQT studies were performed by using inexpensive quartz material, stainless steel, silicon nitride and graphite tubes were also tried for same purpose. An improvement up to 9 was obtained from these experiments. SQT was also presented as an accessory of AAS by Philiphs, Carl Zeiss Jena, Varian, GBC, Unicam and Perkin Elmer.
Figure 1.3. Schematic representation of SQT (Watling 1977)
Applications of SQT to enhance the sensitivity of AAS for the determination of Pb, Cd, and Cu in river and drinking water, whole blood and urine, Pb and Cd in paint, soil and leaves, Bi, Cd, Cu, Mn, Pb, Zn in soil, fertilizers, waste water, air, Ag, As, Bi, Cd, Hg, Pb, Se, Te, Tl, Zn in aqueous solutions were given in review by Matusiewicz (1997). Improvement sensitivities were obtained for lead and cadmium by changing the diameters of tube and lengths of slits. LOQs were calculated as 35.0 and 4.0 ng mL-1 respectively for Pb and Cd by Yaman (2005). In another work, Pb, Cd and Cu were determined in plant leaves sampled around industrial region by STAT-FAAS (Kaya and Yaman 2008). Cu concentrations in cancerous and non-cancerous human thyroid tissues were determined by using STAT-FAAS. Effect of inner and outer diameter and
1. INTRODUCTION __________________________________________________
8
length of tube was also investigated. 3.5 times sensitivity improvement was achieved for Cu (Yaman and Akdeniz 2004).
SQT was also used combination with flow-injection flame atomic absorption spectrometry (FI-AAS) with advantages over the conventional use of SQT. Cu, Pb, Cd and Au were determined in urine with improved sensitivity. In addition, the life of tube was improved by a factor of 5.0-6.0 (Xu et al. 1992).
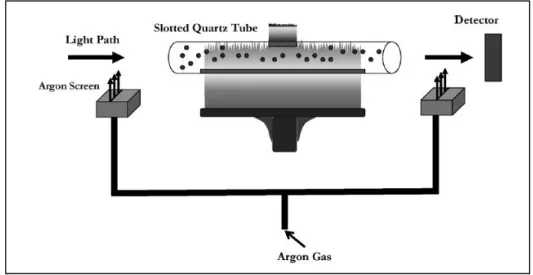
A gas screen (GS) was adapted to SQT to obtain additional increase in sensitivity. GS-SQT was used for Cd, Co, Cu, Mn, Ni, Pn, Se and Zn for sensitivity enhancement by Gholami et al. (2011). Schematic presentation of FAAS-GS-SQT was given in Figure 1.4.
Figure 1.4. Schematic representation of flame AAS-gas screen-slotted quartz tube (Gholami et al. 2011)
Two aluminium blocks as gas screen were placed in both sides of SQT. Air, argon and nitrogen were tried to cut the flame from both sides of SQT and Ar was selected. Increasing in residence time of analyte atoms in optical path was the main advantage of method. Thus, sensitivies were improved. In addition, damage in quartz windows was avoided using GS-SQT in FAAS.
A two slot quartz tube was commerciallized by Agilent Technology, Pye Unicam, Varian, Thermo, Perkin Elmer.
In SQT by Agilent, slots were positioned at 120º to each other. Sensitivity of FAAS for Ag, Au, Bi, Cd, Cu, Fe, Hg, Mn, Pb, Pt, Sb, Se, Te and Tl was improved by 2.7, 2.7, 2.9, 2.3, 2.4, 1.5, 2.8, 2.1, 2.9, 1.0, 3.1, 3.3, 2.7 and 2.6 times with respect to conventional FAAS (Moffett App. Note).
ERSİN KILINÇ
9 1.2.4. In situ Atom Trapping
Atom trapping can be considered as an effective method to increase AAS. It is based on the collection of analyte atoms on surfaces which cooled with water or nitrogen flow or resistively heated metal surface like iridium and tungsten, this step can be called as collection, and releasing the free atoms on surface by stopping the flow of cooler or increase the applied voltage, this step can be called as revolatilization. As a result of this process, a transient signal can be obtained (Matusiewicz 1977; West 1988; Ataman 2008). The concept of atom trapping was firstly applied to determination of lead by U-Tube atom trap by Lau et al., sensitivity was improved by 38 times (Lau et al. 1976). U tube trap tube, Figure 1.5., is positioned above the burner (air-acetylene flame) so that the beam from light source passes above the tube. Due to high melting point and a low thermal expansion coefficient, quartz was selected for atom trap device. The analyte was condensed onto the cold silica surface via continuous nebulization into the spray chamber-burner system for a optimized time interval. Afterwards the blown out of water flow, quartz tube rapidly heated and vaporizing analyte atoms into the light path. Studies showed that Ag, Au, Cd, Co, Cu, Fe, Ni, Pb, Se, and Zn were trapped on the cooled surface in the free form whereas K, Li, Na, Cr, Mg and Mn were trapped on it as their oxides or silicates.
Figure 1.5. Schematic presentation of water-cooled atom trap system (Ataman 2008)
After preconcentration of the analyte atoms on the surface of the water-cooled U-shaped silica tube, the trapped species were released owing to the changing flame conditions using the flame alteration or organic solvent aspiration techniques, while the water circulated continuously (Ertaş et al. 2002).
Various configuration of the silica tube including single, double and triple tube were evaluated and the best results were obtained when dual silica tube was used (Figure 1.6.). In addition, precoating of the tube with Al, V and La provided notably enhancement for Cd and Pb. LODs were 0.8 and 0.1 ng mL-1 for Pb and Cd, respectively, using 2.0 min collection time (Brown et al 1987).
1. INTRODUCTION __________________________________________________
10
Figure 1.6. Design of water cooled atom traps (a) single tube, (b) double tube and (c) end view of triple tube (Brown et al 1987)
It was applied to determination of Cd in calcium chloride, frequently used as extractant in soil analysis. 0.0016 µg mL-1 of Cd as LOD was achieved. The accuracy of the method was checked by standard addition method (Fraser et al.1986).
Important parameters for the automated dual silica tube water cooled atom trap were determined by appling the Plackett-Burman and Birnbaum plots. The results showed that coating of the U-tube increased the sensitivity of Pb, Cd, As and Ag (Roberts and Kahokola 1989).
New design of water cooled dual tube was suggested and experimental details were investigated. The shape of the tubes was altered from the flat type to a bent tube. It was found that the use of new bent model through the analysis of Pb and Cd, higher sensitivities were obtained over the flat model. The characteristic concentrations were improved by 2.46 and 1.18 times, respectively for Cd and Pb (Turner et al. 1995). As, Sb, Cu and Mn were also determined by using this technique (Ellis and Roberts 1996). Fuel flow rate, percentage obscuration of the light beam, and the height of the tubes above the burner were optimized. It was found that high fuel flow, high percentage obscuration and low tube height were critical in obtaining high sensitivity. The sensitivities for As, Sb, Cu and Mn, using this technique were 8.6, 8.0, 0.93 and 0.38 ng mL-1, respectively.
Instead of quartz as atom trapping material, steinless-steel was used for the direct determination of Pb in alcholic drinks. The characteristic concentrations of Pb for the method were 0.044 and 0.0055 µg mL-1 when collection for 1.0 and 5.0 min, respectively. The interference effects of some elements were investigated and it was decided to use Na2EDTA to eliminate the effect of Fe (III), Al (III) and Si (IV)
ERSİN KILINÇ
11
Another use of the water cooled system was a combination of U-shaped cooling system integrated with slotted quartz tube (Figure 1.7.). It was called as integrated atom trap (IAT) system by Matusiewicz and Kopras (Matusiewicz and Kopras 1997) and called as slotted tube water cooled atom trap (STWCAT) by Turner and Roberts (Turner and Roberts 1996). The primary advantages of this procedure lie in the inherent simplicity of the analytical technique and speed of analysis. The characteristic concentrations were obtained as 0.112 and 1.042 ng mL-1 respectively for Cd and Pb (Turner and Roberts 1996). Condensation of water droplets on cold silica surface dropping off onto the STAT was a disadvantage of the method in view of high noise (Turner and Roberts 1996). It was found that there were not significantly differences between single silica tubes and double one (Turner and Roberts 1996, Matusiewicz and Kopras 1997). In addition, it was observed that the sensitivity of Cd, Cu, Pb, Tl and Zn was dependent on flame conditions, whereas Fe, In and Mn were not. The best sensitivity was obtained when a lean flame with 50 L h-1 of acetylene was used for trapping these elements and a fuel-rich flame with 80 L h-1 of acetylene was used for releasing (atomization). By appling the flame alteration technique, sharp signal was obtained rapidly (Turner and Roberts 1996).
Figure 1.7. Schematic presentation of slotted-tube water-cooled atom-trap (STWCAT) system (Matusiewicz and Kopras 1997)
Ertaş et al. suggested the use of water cooled U-tube trap and combination of its with slotted quartz tube (Ertaş et al. 2002) with new approaches for the determination of Pb and Cd. Flame alteration and organic solvent aspiration techniques were applied by using water cooled U-shaped silica trap combined with slotted silica tube and slotted silica tube trap. In the condition of flame alteration, total acetylene flow was divided into two streams. Thus, one of the flow meter was allowed to flow during collection, and both of two were activated during atomization. Organic solvent aspiration is based on the collection of analyte on quartz surface in lean acetylene flame and atomization by adding organic solvent to increase to temperature of the flame (Ertaş et al. 2002).
1. INTRODUCTION __________________________________________________
12
Several organic solvents include methyl isobutyl ketone (MIBK), methyl ethyl ketone (MEK), acetonitrile, iso-octane, acetone and hexane were tried during revolatilization step and it was decided to use IBMK at the volumes of 20.0 and 10.0 µL, respectively for Pb and Cd, that it was not only caused complete atomization but also provided the largest linear range in calibration plots. The results were good agreed with certified reference material. Characteristic concentrations were obtained as 2.2 and 0.35 ng mL-1 respectively for Pb and Cd in the case of flame alteration, 2.4 and 0.25 ng mL-1 respectively for Pb and Cd in the case of organic solvent aspiration (Ertaş et al. 2002). Korkmaz et al., investigated the nature of re-volatilization from atom trap surface (Korkmaz et al. 2002). According to their experiment results;
-the removal process is not a simple reduction -direct contact with flame products is required
-heating is not necessarily associated with the removal of surface species -a critical C/O value and thus an optimized flame
were required during revolatilization and atomization process (Korkmaz et al. 2002). In another work, possible interference effects of KCl, NH4H2PO4, (NH4)2CO3, MgCl2,
NH4NO3, NaNO3, (NH4)2SO4, MgSO4.7H2O, CaCl2, Ca(NO3)2 and NaCl on Bi, Cd, In,
Pb and Sb were investigated using the atom trapping technique with a double slotted silica tube. As a serious problem, devitirification which affect the lifetime of a slotted silica tube could occur at high content of alkali chlorides, especially NaCl (Korkmaz et al. 2003).
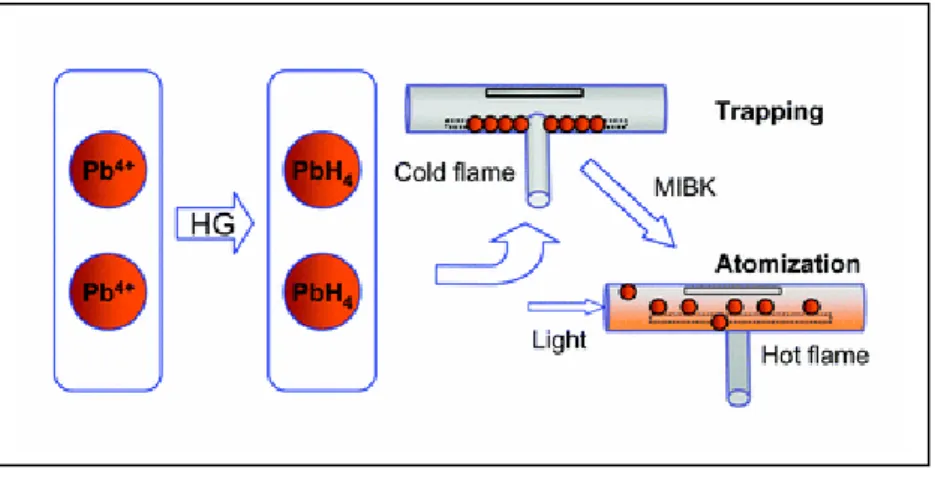
When analyte atoms were trapped on slotted quartz surface and revolatilized by addition of organic solvent, the method was called as slotted quartz tube – atom trap (SQT-AT). To improve the sensitivity in SQT-AT, flow rate of acetylene, suction flow rate of sample, collection time, type and volume of organic solvent and height of SQT from burner should be optimized. The advantages of SQT-AT to former trapping techniques were highlighted in a review by Ataman as increased sensitivity, decreasing the possible interferences, increased sample throughput, low cost and it is simple to use. Applicability of the SQT-AT was limited only volatile elements which were easily decomposed thermally in the primary reaction zone of air-acetylene flame (Ataman 2008).
Kumser studied the determination of Bi, Au and Mn by using uncoated SQT-AT-FAAS. Sensitivity improvements for Bi, Au and Mn as compared to FAAS were 94, 180 and 6.6 folds respectively (Arı 2009). Arı investigated Tl determination by Os coated SQT-AT and 3.5 fold enhancements in sensitivity was achieved as compared to uncoated SQT-AT (Arı 2009). Demirtaş developed a SQT-AT-FAAS method for the determination of Pb by using SQT which contained two slot positioned on 120º and 180 º. Characteristic concentration was 0.11 ng mL-1 and characteristic mass is 4.50 ng and 1200 fold sensitivity enhancement was obtained with respect to FAAS at 8.1 mL min-1 suction flow rate of sample and 120º of SQT. Characteristic concentration was estimated as 0.1 ng mL-1 and characteristic mass is 3.70 ng and 1320 fold sensitivity enhancements was achieved with respect to FAAS at 7.4 mL min-1 suction flow rate of sample and 180º of SQT (Demirtaş 2009).
ERSİN KILINÇ
13
Effect of variations on inner (id) and outer diameters (od) of SQT was also studied by Demirtaş. Highest signal was obtained by using 10 mm of id, 13 mm of od in SQT. The effect of wall thickness of SQT on analytical signal was also investigated. It was found that highest signal to noise ratio was obtained by using a SQT with 0.5 mm of wall thickness (Demirtaş 2009).
Sensitivity of FAAS for indium (In) was improved using SQT. Enhancement factor (E) from slope ratio of calibration plot of FAAS to SQT-FAAS was found as 1.43. Further improvement was achieved using SQT for trapping of In in inner wall of SQT. E was found as 400 with respect to conventional FAAS and 279 with respect to SQT-FAAS. Characteristic concentration (c0) and limit of detection values were found to be 3.63 ng
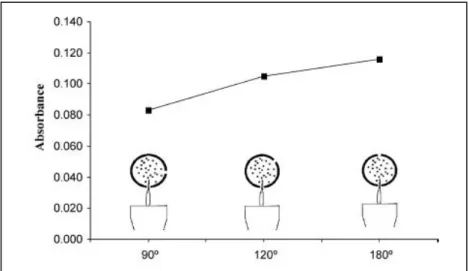
mL-1 and 2.60 ng mL-1, respectively, using a sample flow rate of 7.0 mL min-1 and a collection period of 5.0 min. In this study, positions of upper and lower slots were also examined. Three different SQT devices were produced where two slots were positioned at 90 º, 120 º and 180º with respect to each other (Figure 1.8.). It was found that higher In signal was obtained when two slots were positioned at 180º (Arslan et al. 2011).
Figure 1.8. Optimization of SQT slot positions with respect to each other for In (Arslan et al. 2011)
SQT was coated with La solution to prevent the tube from devitrification by Watling (Watling 1977). This approach was investigated and developed to improve the sensitivity of FAAS. For this purpose, non-volatile elements were selected as coating material of SQT. W, Pd, Mo, Au, Ta, Zr, Ir, Ti, Os were selected in view of their higher melting and boiling points. It should be noted that melting point of the coating material must be higher than the analyte element (Arı 2009; Demirtaş 2009).
Ta coated SQT was used for Pb determination by SQT-AT-FAAS. LOD and LOQ were calculated as 0.15 ng mL-1 and 0.49 ng mL-1 respectively by using 19.5 mL of sample volume. 1653 fold sensitivity enhancement was obtained with respect to FAAS (Arı 2009).