/i. PART FAMILY FORMATION ALGOIilTHl·/! I>-i GT
ENVIRONMENT USING A MUL'n-OBJEClXVE
CLUSTER AH/O.YSIS
A THESIS
IT T L O T O T H E D E P A R T M E N T O F IH D U S T E IA L B N G IN S E IG il^ A M D T H B IM 3T IT U T B O F E U G I N E B U N G AM D S C IS H 0E 3
r 'O "■•O T ^ "T< i'-'T T T "· .1 T 'V.» '! ‘ "O'
aiP L O * · L 1 1 - · li 4 L * V teaD tU n Ma
A-a—/ L L* L.>TT»TT T ^ /T *??i *> 7 .’7^ r· ;‘'T» r'-'-TT'r? T> \ v aaik L Uidf L .» J\» * i L ^ <1 J ^ A ' «ti· »i *· J O *.· -a/ <i-.a>^ T 7' O * . >,< —· - .· V»· L · ^ « >] »«. a OM T T F O E THE D E G E 2 3 OF M A ST E R OF SCIBi-ICE C ‘ «®i «i! .«# I ■ R i j: o ,i a * 7 £, * ■:> a L o*
A PART FAMILY FORMATION ALGORITHM IN GT
ENVIRONMENT USING A MULTI-OBJECTIVE
CLUSTER ANALYSIS
A THESIS
SUBMITTED TO THE DEPARTMENT OF INDUSTRIAL ENGINEERING
AND THE INSTITUTE OF ENGINEERING AND SCIENCES OF BILKENT UNTVERSITY
IN PARTIAL FULFILLMENT OF THE REQUIREMENTS FOR THE DEGREE OF
MASTER OF SCIENCE
By
Hfikan Okan Balkose
September, 1993
I m
I certify that I have read this thesis and that in my opinion it is fully adequate,
in scope and in quality, a thesis for the degree of Master of Science.
^ MJL
Asst. Prof. Selim Aktûrk (Advisor)
I certify that I have read this thesis and that in my opinion it is full.y adequate, in scope and in quality, as a thesis for the degree of Master of Science.
Prof. M. Akif Eyler
1 certify that I have read this thesis and that in my opinion it is fully adequate, in scope and in quality, as a thesis for the degree of Master of Science.
A/·
Asst. Prof. Evin (Özdemirel) Boz.şahin
Approved for the Institute of Engineering and Sciences:
A PART FAMILY FORMATION A L G O R IT H M IN GT
ENVIRONM ENT USING A M ULTI-OBJECTIVE CLUSTER
ANALYSIS
Hakan Okan Balköse
M.S. in Industrial Engineering
Supervisor: Asst. Prof. Selim Aktiirk
September, 1993
In the existing literature, the part-family formation problem is nandled ei ther by coding systems or the cluster analysis. In this study, we propose a new method that will consider both design attributes and operation sequences simultaneously in conjunction with the related performance measures such as the machine investment, within and between cell workload variabilities, and the number of skippings. Finally the proposed method is compared with the similarity coefficent method under different experimental settings and its ro bustness is chocked against the varying system parameters.
Key ioords: Cluster Analysis, Cellular Manufacturing, Multiple Criteria Decision Making.
ÖZET
G T ORTAMINDA ÇOK AM AÇLI SINIFLANDIRMA
ANALİZİ İLE BİR PARÇA AİLESİ OLU ŞTURM A
ALGORİTM ASI
Hakan Okan Balköse
Endüstri Mühendisliği, Yüksek Lisans Yüksek Lisans
Tez Yöneticisi: Yrd. Doç. Dr. Selim Aktürk
Eylül 1993
Mevcut literatiiıde, parça-ailesi oluşturulması, kodlama sistemleri ya da sınıflandırma analizi yöntemlerinden birinin kullanımı ile yapılmaktadır. Bu çalışmada, hem tasarım özelliklerini, hem de işlem sıralarını göz önüne alan, öte yandan makina yatırımı, hücre içi ve arası iş yükü değişkenlikleri ve atlama sayısı gibi ilgili performans ölçütleri ile bağlantılı yeni bir yöntem önerilmektedir. Önerilen yöntem, ayrıca benzerlik katsayı yöntemi ile farklı deney düzenlerinde karşılaştırılmakta ve dayanıklılığı değişken sistem parametrelerine karşı kontrol edilmektedir.
Anahtar sözcükler. Sınıflandırma Analizi, Hücresel imalat. Çok Kriterli Karar Verme.
ACKNOWLEDGEMENT
I would like to thank my advisor Asst. Prof. Selim Aktiirk who has provided
a pleasant research environment and motivating support during this study. I would also like to thank Prof. Akif Eyler and Evin Boz§ahin for read ing the thesis, and the rest of the Faculty of the Department of Industrial Engineering for the academic environment they have created.
Finally, I would like to thank my family, my friends, and everybody who has in some way contributed to this study by lending moral support.
1 Introduction X
2 An Overview of the Existing Techniques 3
2 . 1
In trodu ction...3
2.2 Models and Algorithms developed for G T ... 4
2
.2 . 1
Methods Using Design A ttrib u te s...5
2
.2 . 2
Models Considering Machining Requirements7
2.3 Models Haiidlin!^ Operation S e q u e n c e s ... 152.4 Use of Coding Systems in a S C M ... 18
2.5 Cluster Analysis P ro g ra m s ... 19
2.6 C onclusion... 23
3 Problem Statement 25 3.1 Introduction . . 25
3.2 Dissimilarities Based on Design A ttr ib u te s ... 26
3.3 Dissimilarities Based on Operation Sequences 27
3.4 Objectives and A ssu m p tion s...
31
3.5 The Mathematical M o d e l...
33
3.6 C onclusion...
3 7
4 The Proposed Model 39
4.1 In trodu ction ...
39
4.2 The Proposed Method
3 9
4.3 Implementation of the Heuristic M e t h o d ...
44
4.4 C onclu sion...
4 7
5 Experimental Analysis 48
5.1 In trodu ction ... ... 48
5.2 Experimental P l a n ... 48
5.3 Computational Comparison 51
5.4 ANOVA for the Proposed M e th o d ...
5 3
5.5 Conclusion and Recommendations... 56
6 Conclusion 58
A Design attributes, routing, cost, and demand data for the ex
ample problem 61
B Statistical analysis of the factors in the experimental design 71
C Analytical Hierarchy Process 80
List of Tables
2 . 1
The incidence matrix showing the machine requirements8
2 . 2
Rearranged rows and c o lu m n s ...8
2..3 Decimal equivalents of the r o w s ...
10
3.1 Part Routing Information 29 3.2 Dissimilarities based on SCM .30 3.3 Dissimilarities based on Revised distance m e a su re... 30
3.4 Dissimilarities based on original Levensthein d is t a n c e ...31
3.5 Part families based on different dissimilarity m easures... 31
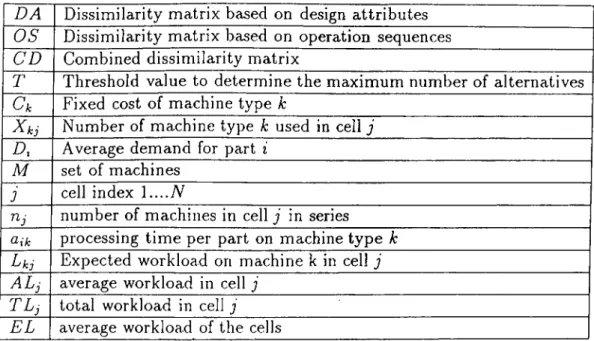
4.1 The notation of the m o d e l ... 40
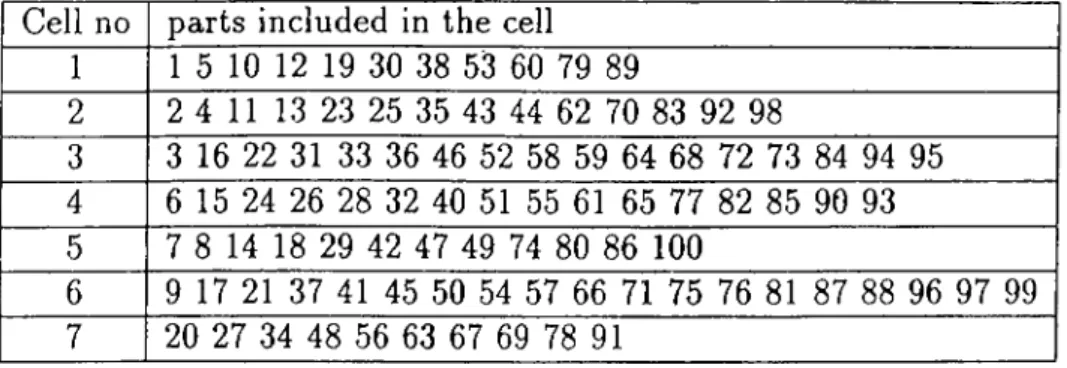
4.2 Output of PAM: Initial part families
45
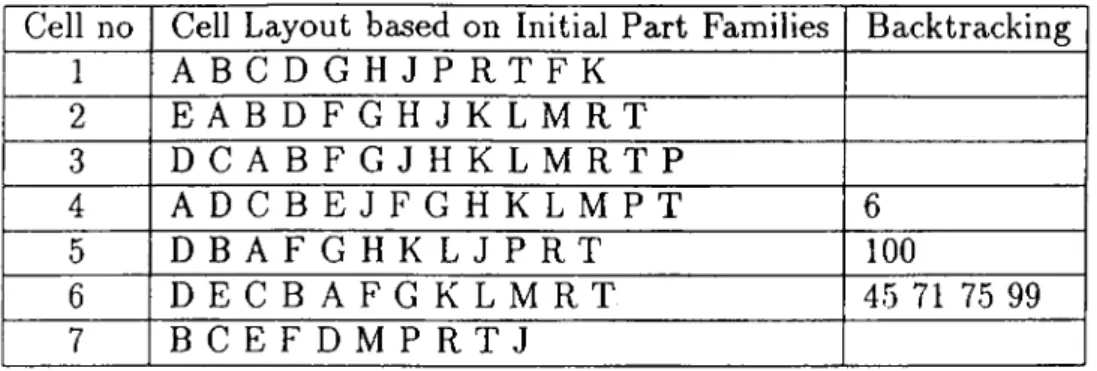
4.3 Initial la}'outs based on precedence constraints... 464.4 Alternatives and O b je c t iv e s ...
4 7
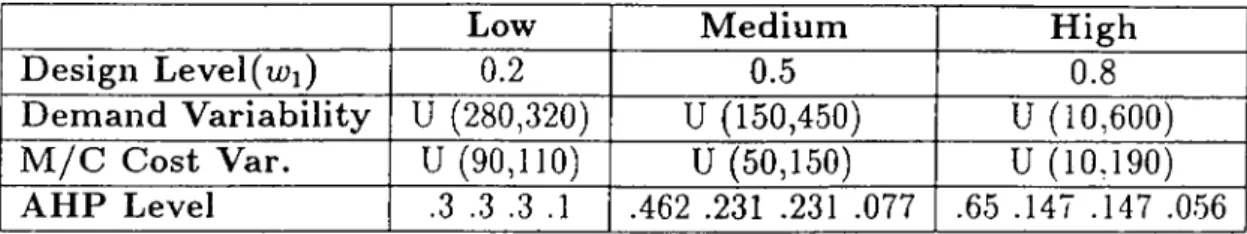
5.1 Combination weights at three le v e ls ... 495 . 2
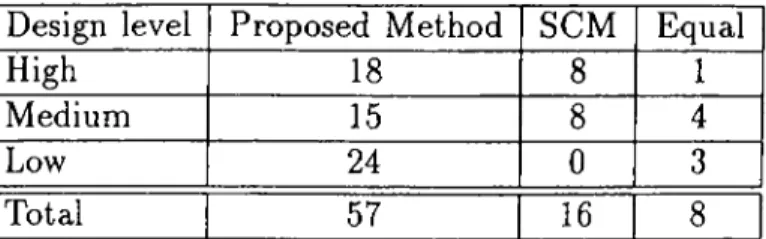
Summary of the factors in the experimental analysis... 515.3 Comparison of the methods according to best r e s u l t s ... 52
5.4 Ranges and averages for two m e th o d s... 53
5.5 Summary of ANOVA Tables for the Proposed Method 54 A.l Demands for each part at three levels of demand variability . . . 61
A.2 Cost for each machine at three levels of machine cost variability 65 A.3 Part routings, design attributes and processing times 66 .Λ.4 Abbreviations of the objectives for the tables A .5., A .
6
. and A .7. 70 A.5 АИР weights for high variability... 70.Л
.6
AHP weights for low v a ria b ility ... 70.Л.7 AHP weights for medium variability... 70
B.l Comparing our method with SCM : W\ =
0 . 2
... 73B.2 Comparing our method with SCM : W\ = 0 . 5 ... 74
B.3 Comparing our method with SCM : Wi = 0 . 8 ... 75
B.4 ANOVA for machine cost 76 B.5 ANOVA for within cell deviation 77 B
.6
ANOVA for between cell va ria b ility ... 78B.7 ANOVA for s k ip p in g ... 79
Chapter 1
Introduction
Traditionally, manufacturing systems are separated into two groups according
to their layout arrangement. These are process la
5
'out, and the product layout.As the names imply, the former groups the similar processes together, whereas the latter arranges the machines so that a part will be processed through all machines in a line. A third category is the cellular manufacturing, which is a derivative of group technology (G T) idea. Cellular manufacturing systems form machine cells, and assign a group of parts, which we call part families, into those cells. If a part family is assigned to a cell, then all the operations required by the parts in that family should be available in that cell. Hence, the most important problem in cellular manufacturing is the determination of part families and machine cells.
In the literature, there are a number of methods developed for this prob lem. These methods can be separated into two groups which are coding systems and cluster analysis. The latter includes tw'o wide groups, which are matrix formulation and mathematical formulation techniques. Coding sj'stems use de sign based information such as shape, length to diameter ratio, raw material, etc., and cluster analysis techniques usually use the information of machining requirements for each part. However, determination of part families is a dif ficult process, since the parts should be similar in both design attributes and machining requirements in order to take an advantage of their similarities as re quired by the G T concept. Therefore, in this study, design and manufacturing
attributes will be combined to solve this problem.
Furthermore, a new distance measure will be proposed, which aims to con sider not only the machining requirements, but also the sequence of the opera tions. The sequence of the operations of the parts in a cell is important, since each cell is designed to be a modified flow line, which means parts move in the same direction within the cell. In addition, a set of performance measures will be defined to evaluate the performance of a cell, which includes machine in vestment cost, within cell variability, between cell variability of the workloads, and the total number of skippings, which is the additional material handling required to skip some machines in a flow shop. Then, a new model will be proposed to consider both design attributes and the machining requirements using the new distance measure, and the defined objectives to select the best alternative according to the performance measures.
Finally, certain factors which may affect our performance measures such as demand rate variability, machine investment cost variability, etc, will be elabo rated, and the significance of these factors on the performance of the proposed approach will be discussed under the different experimental settings. Then, the proposed model will be tested against the similarity coefficient method, and the robustness of the model will be investigated.
In the next chapter, a literature review of the existing techniques will be pre sented, and the comparison and evaluation of those will be given. In Chapter .3, a problem definition is given, the assumptions are exhibited, and a mathemat ical programming formulation of the model will be illustrated. In Chapter 4, the proposed heuristic method is introduced and it is illustrated on an example problem. The definition of factors which may affect the model’s performance are discussed in Chapter .5, and the computational comparison and analysis of variance conclude the chapter. Finally, the concluding remarks are presented
An Overview of the Existing
Techniques
Chapter 2
2.1
Introduction
In the near past, manufacturing systems have been classified into two cate gories based on their physical layout. The firs«: one is the product layout or line layout, where the machines are arranged to produce a single part or only a group of parts. The second category is the process or functional layout, where machines are organized according to their processing capabilities.
Increasing cost and demand figures led the industry to produce items in a fast and inexpensive manner. This started the growth of a third category which is called cellular manufacturing (CM). As the name implies, this man ufacturing philosophy arranges machines into separate cells so that each cell has the responsibility to produce a specific part family. Cellular manufacturing is a subset and derivative of group technology. Mitrofanov [1.5] defines group technology as the bringing together and organizing of common concepts, prin ciples, problems, and tasks to improve productivity.
In the literature, many advantages of CM were reported depending on the survey results in US firms. These are:
i) reduction in setup times
ii) reduction in work-in-process inventories iii) reduced flow times
iv i increase in throughput
v) increased management control
vi j reduced material handling [
7
]There are also some disadvantages stated in the literature. These are reduced machine utilization and reduced flexibility. Due to independent cells, each processing a different part family, the number of machines increase when com pared with the job shop case. The demand stays at the same level, but since the available capacity increases, the machines are less utilized. .Since the part families are assigned to cells, it becomes less flexible against the changes in demand patterns.
The important starting point of cellular manufacturing is the definition of part families and machine cells. The degree to which one can catch the benefits of cellular manufacturing is directly related to the model by which the part
families and machine cells are determined. In Section
2
.2
, the models and algorithms referring to this problem will be compared and evaluated. Section 2.3 ensures the importance of operation sequences in part family and machine cell formation problem, and presents some models to handle this problem. Section 2.4 describes the use of a coding scheme in a similarity coefficient method. Fi lially, a computer package, which is used in cluster analysis, will be presented with its programs in Section 2.5.
2.2
Models and Algorithms developed for G T
Generally, the studies focusing on part family formation problem consider two types of attributes, namely geometric shape and design characteristics, and the
machining requirements, which will be discussed in the following subsections in detail.
2.2.1
Methods Using Design Attributes
These methods are used to group parts into part families based on their design and geometric similarities. Two methods are used:
• visual method • coding method
Visual method is not a systematic procedure as parts are grouped according to their similarity of geometric shape. This method depends on personal pref erence so it is applicable in case where there is a limited number of parts.
On the other hand, a ceding method classifies parts on the basis of follow ing features;
i) geometric shape and complexity ii) dimensions
iii) length to diameter ratio iv) auxiliary and external holes
v) type of material
vi) shape of raw material, and
vii) required accuracy of the finished part.
CHAPTER 2. AN OVERVIEW OF THE EXISTING TECHNIQUES 5
Using a coding system, each part is assigned a numerical or an alphanumerical code. Coding schemes vary according to the way the symbols assigned to code fields as follows:
a) m onocode b) polycode c) hybrid code
Monocodes, or hierarchical codes are structured in such a way that each sym bol amplifies the information provided in the previous digit. Thus, digits in a monocode cannot be interpreted alone, and they are dependent for their mean ing on the information contained in the preceding symbols. The difficulty with the m onocode is that it is difficult to construct because of dependency. The advantage is to capture a great deal of information with a short code.
Polycodes have code symbols which are independent o f each other. The value of each symbol in a code field is interpreted in the same way irrespective of the symbols in the preceding fields. Therefore, this coding scheme is easier to construct, but being quite long is the primary drawback.
Hybrid codes, or the mixed mode codes, as the name implies, represent the mixture of mono and polycodes. This type of codes captures the advantages of both schemes. The features that are accessed often and have small number of options are kept in polycodes, where as features with high variety and un common characteristics are kept ip the monocode part.
There are many coding systems developed for use in industry. Majority of them are designed to code component parts, but some o f them may code other items, such as tools, machines, and fixtures. Widely ti>ed coding systems and their characteristics are as follows:
i) Brisch Birn is a coding system which was developed in the UK. Coding scheme is a hybrid code. It is not restricted to code parts ¿is all items can be coded. The user can define and design extra fields according to his or her specific needs.
ii) Miclass/Multicleiss, a scheme developed in the US, is using both monocodes and polycodes. For each type of material, a different coding system is used. It is specific to user and has an extensive computer support. iii) Opitz was one of the first coding schemes that was developed in Ger
many. The code is also a hybrid code. It can be applied to machined, nonmachined, and purchased parts, but it has no software support.
A more detailed discussion on the existing coding systems can be found in Hyer and Wemrnerlov [23].
2.2.2
Models Considering Machining Requirements
Cluster analysis allows grouping objects according to their object features. This grouping results in part families (PF) and machine cells (M C) in a group technology environment.
To model the GT problem, generally the following two formulations are used:
• matrix formulation
• mathematical programming formulation
2.2.2.1 M a tr ix F orm u la tion
In the matrix formulation, usual approach is to u.se machine-part incidence
matrix which has the entry of 0 or I, where 1 indicates the machine i is used to
process part j , and zero otherwise. Typically, in the initial structure, the cells
and families are not visible. An example of a machine-part incidence matrix is given in Table 2.1.
CHAPTER 2. AN OVERVIEW OF THE EXISTING TECHNIQUES 7
me. part no no.
1 2
3 4 51
0 1 0 1 1
2
1 0 1 0 0
30 1 0 1 0
41 0 1 0 0
Table 2.1. The incidence matrix showing the machine requirements
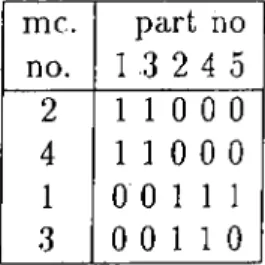
until the initial matrix is transformed into a more structured form. The inci dence matrix, shown in Table 2.2, is obtained by rearranging rows and columns
of the matrix in Table
2
.1
. To solve the matrix formulation of the GT problem.me. part no no. 1 .3 2 4 5
2
1 1 0
0
0
41 1 0
0
0
1
0
0
1 1 1
30
0
1 1 0
Table
2
.2
. Rearranged rows and columnsthe following approaches have been developed:
• production flow analysis
• similarity coefficient methods (SCM) • sorting-based algorithms
• bond energy algorithms • cost-based method
• cluster identification algorithm
Production Flow Analysis (PFA), which is introduced by Burbidge, is one of the first methods to solve the GT problem. The procedure is simply to rear range rows and columns until visible clusters are formed.
CHAPTER 2. AN OVERVIEW OF THE EXISTING TECHNIQUES 9
The construction of machine cells and part families by the Single Linkage Clus tering Algorithm (SLCA), was first introduced by Me Auley [13]. He defined the similarity coefficient between two machines as the number of components visiting both machines divided by the number o f components visiting either of the machines in the following form:
ELi
(^Haik.ajk)
E L i Ojk)
S { j — (2.1)
where
^ik —
1
, if machine ¿is used to process part A:0
, otherwiseSij = similarity coefficient between machines i and j
^ x/: i ^jk ) —
1
, if^xA: — eijk —1
0
, otherwise0
, if a,fc = ajA-=0
1
, otherwiseSimilarity coefficient between all pairs of machines are calculated, and accord ing to a preset threshold value the machines are grouped into cells. The major drawback.of this method is that it does not consider the duplication of bot tleneck machines and also there is not yet defined a particular way to set a threshold value.
The second SCM is introduced by Seifoddini and Wolfe [19] to overcome the chaining problem of bottleneck machines in SLCA. This method is called the Average Linkage Clustering Algorithm (ALC) and the similarity coefficient
between two clusters is defined as the average of the similarity coefficients be tween all members of the two clusters. The duplication process in this model is based on the number of intercellular moves. Later, Seifoddini proposed that re-examination of bottleneck machines may prevent the improper machine as
signment problem by reducing intercellular moves [
2 0
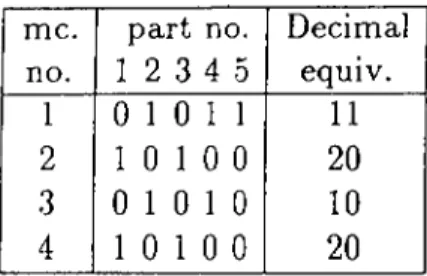
].Sorting-Based Algorithms are clustering algorithms that sort rows and columns of the machine-part incidence matrix according to some rules. King developed the Rank Ordering Clustering (R O C ) algorithm [9]. His algorithm simply as signs a binary weight to each row and sorts them in decreasing order according to corresponding decimal weights, and does the same steps for columns. The algorithm continues until no further changes in the order of rows and columns.
For the initial matrix in Table
2
.1
, the decimal equivalent values of the binaryvalues of the rows are given in Table 2.3. Another sorting-based algorithm,
Di-me. part no. Decimal
no.
1 2
3 4 5 equiv.1
0 1 0 1 1
1 1
2
1 0 1 0 0
20
3
0 1 0 1 0
1 0
4
1 0 1 0 0
20
Table 2.3. Decimal equivalents of the rows
rect Cluster Algorithm (D C A ) was developed by Chan and Milner [4]. Rather
than giving binary weights, they count the number of ”
1
” s in each row asweights and sort them according to an increasing order, then the same step is followed for columns, but now in a decreasing order. The algorithm stops when no further changes occur.
The major drawback of sorting-based algorithms is that they do not consider any figure other than the machine-part incidence matrix. Furthermore, they do not deal with the number of intercellular movements and sequence of operations within the cells. However, in SCM ’s, production volume and transportation between machines might be considered.
CHAPTER 2. AN OVERVIEW OF THE EXISTING TECHNIQUES 11
Another array based algorithm is Bond Energy Algorithm, which is devel oped b}' Me Cormick et al. [14]. The BEA seeks to maximize a measure of
effectiveness, M E , calculated as
m n
~ ^ + o ,j_ i + a,+ij] (
2
.2
)t = l i=i
With the original form, it did not handle the operations sequence. Later, an extension was made to consider the operations sequence by replacing binary values with the inverse of the operation’s position in a part’s operation se quence. However, this approach was not able to incur the material movements information into part family formation problem, but only produced it as a side information.
Askin and Subramanian [
2
] developed a three stage cluster analysis considering some manufacturing costs. The first stage involves development and application of a coding and classification scheme for parts. The next step is the attempt to develop a feasible grouping between parts based on fixed and variable production cost, setup cost, production cycle inventory cost, work- in-process inventory cost, and material handling cost. The third stage is the actual layout. This stage involves positioning groups relative to one another and arranging machines within groups.
Askin and .Subramanian made following simplifying assumptions as their pur pose was not to present the ultimate cost model but to show how a comjjre- hensive method can be applied:
i) each part has a predetermined operations sequence ii) planning horizon is infinite and mean demand is constant iii) shortages are not allowed
iv) lot splitting is not allowed
vi) intra-family setups are more costly than inter-family setups.
Kusiak and Chow [
1 2
] developed the Cluster Identification (C l) algorithm. Infact, this algorithm is a trade off analysis between including a part in a part family or to subcontract it. Part flow rate can substitute subcontracting cost in a wa)' that if the flow rate value of a part between two machines is high, then the utilization of material handling system is high. Then it is better to subcontract this part. The only extension provided by this algorithm is that in Ccise of partially separable clusters, cost analysis is executed to have mutually separable clusters.
Several methods have been discussed above to clarify the matrix formulation ai)proach. The only input is machine-part incidence matrix for PFA, sort ing based algorithms and BEA. For SCM, the starting matrix is again the machine-part incidence matrix, but there is no procedure to rearrange rows and columns as in the former methods. The similarity coefficients between all pciirs of machines are computed and that measure is the basis for grouping ma chines. So none of those algorithms considers the operation sequences except the extension of BE.A. However, this extension uses the operation sequences as a side information, and it does not consider the material flow within cells. On the other hand, cost l)a.sed algorithms are not able to exhibit the ultimate cost function, but only capture some manufacturing costs with very simplify ing assumptions. Their difference from the other algorithms that they have the initial part groupings based on a coding scheme. Cl algorithm is again a limited extension of the previous algorithms that it handles the bottleneck parts by checking their subcontracting costs.
How do we know whether a machine-part incidence matrix will be in a block di agonal form through the use of the algorithms that u.se machine-part incidence as input matrix? There are a lot of this kind of matrices that cannot become a block diagonal structure independent of the method used. So we should know to what degree a binary matrix is groupable. An analysis of these binary data matrices was studied by Chandrasekharan and Rajagopalan [5]. They defined
a Jaccard similarity coefficient between two vectors. By using this coefficient, tliey tried to answer the characteristics of data that make it amenable to block diagonalization and predict the success or failure of the block diagonalization. This is a valuable study in terms of reporting the grouping efficiency when starting a GT problem.
Another problem is the selection of the threshold value in SCM’s. In the literature, there is no specific procedure to determine the threshold values, and it is usually left to the user’s preference.
The most troublesome point common to all above methods is that the number of clusters and cluster sizes are outputs, not inputs. So, using these methods, we have no alternatives for the number of cells. But, there may be cases that the user need to see different alternatives which mean different number of cells and part families.
Briefly, all the methods described above, use the machine requirements in formation for each part without considering operation sequences and design attributes. Another common lacking point is that the number of machine cells and part families is uncontrollable. With the matrix formulation techniques, it is not possible to compare different alternatives according to any criteria.
2.2.2.2 Mathematical Programming Formulation
CHAPTER 2. AN OVERVIEW OF THE EXISTING TECHNIQUES 13
As mentioned before, the number of part families is determined a posteriori in matrix formulation based techniques. The mathematical programming ap proach differs in the manner that the number of part familio's is determined a
j)riori. Kusiak [
1 2
] indicates the p-median problem as the corresponding LPformulation to the part similarity matrix. The formulation is given below with the following parameters:
subject to : n p t=l j=l P ( 2 ..3 ) X{j = 1 Vi i = i P ( 2 . 4 ) Y = P J = l ( 2 . 5 ) ( 2 . 6 ) p = 0 , 1 V iJ ( 2 . 7 ) where, n : number of parts
p : number of part families
dij : dissimilarity between parts i and j
1
, if part i belongs to family j0
, otherwiseAs seen above, the contribution of MP approach is the consideration of the number of part families as an input parameter. In this formulation, constraint (2.4) ensures that each part belongs to exactly one famil}', constraint (2.5) spec
ifies the required number of families, and constraint (
2
.0
) ensures that part ibelongs to family j only when this family is formed. This formulation tries to
minimize the sum of dissimilarities within p part families by considering only
one process plan for each part. Kusiak [
1 1
] modified the p-median problem tohandle alternative process plans and corresponding production costs in Gen eralized p-median model. The cost of the selected process plan appears in the objective function and an additional constraint which will ensure that only one process plan is selected for each part, which makes this formulation General
CHAPTER 2. AN OVERVIEW OF THE EXISTING TECHNIQUES 15
p-median model.
There are many other mathematical programming approaches developed for
GT problem. Kusiak [
1 2
], and Shafer and Rogers [2 1
] give a brief summaryof mathematical programming approaches in the literature. Each approach addresses different costs, and lower and upper bounds for the number of parts in a part family. Some models evaluate adding new equipment and others use
only the existing equipment [
2 1
].The common deficiency for all the MP models is that they consider parts’ machine requirements without dealing with parts’ routings and design char acteristics. In fact, it is not even possible to incur design attributes into MP models, as design attributes are kept in strings of numerical characters and we are not able to use them in MP models. Comparing with the matrix formula tion models, MP models are superior, since the number of part families is an input, and this provides flexibility to examine different alternatives.
2.3
Models Handling Operation Sequences
None of the matrix formulations described above consider the operations se quence of the parts in a part family. In fact, the advantages of CM could be lost if the parts’ flow direction exist in each direction in a cell. The concept of Modified Flow Shop becomes important while assigning a part family to a cell. This means that backtracking should not occur in a cell. This idea simpli fies cell scheduling and control problem. The material handling activities take place easily. Parts go into a specific machine in the same direction as they leave that machine. This is applicable for U-shape and line layouts. If this fact is neglected, the backtrackings can turn the cell into a job shop. There are a few numb'er of researches in the literature that deal with operation sequences. One is an extension of BEA, which was described to be unsatisfactory in Subsec
tion
2
.2
.2
.2
, and second is a similarity coefficient method based on operationTam [22] proposed a way of representing any part routing as a string of char
acters. Using a Levenshtein’s distance measure, dissimilarities between two
routings based on both similarities of machine requirements and operations sequences, are found. According to this measure the distances between two strings is the minimum number of transformations required to derive one string from the other. Three types of transformations are used, which are:
i) Substitution transformation, i.e., ABC —^s A E C
ii) Insertion transformation, i.e., AC —>/ A B C
iii) Deletion transformation, i.e., AEC — AC
Considering only the number of transformations might be misleading so he used another coefficient to handle commonality of operations of two parts. Combin
ing these into one function for each pair, we have
where.
/(<·'. ['iy|,c('.il) = + “ c(i - 4 '-j|)
lOn + tt’c = 1
(
2.
8)
(2.9)
d „ [i,y ]: minimum number of transformations divided by maximum number of transformations.
c[i^ j] : total number of common operations divided by number of distinct operations.
In the above definitions, the maximum number of transformations is computed by the subtraction of the number of common operations from the total num ber of operations in the two strings. This distance measure is very useful to find dissimilarities between two strings of characters if these strings carry all sequential information. With this structure, the current function does not deal with backtrackings. In the next chapter, we revise this distance measure and
use it in a different manner to handle commonality of operations and back trackings by utilizing the modified flow shop idea.
A detailed study for the design of a cellular manufacturing system is given by Vakharia and Wemmerlov [23]. They start with demand and available pro ductive time data, and in the second stage they separate the parts with single or dual operations and of the remaining parts. They further split the parts with the backtracks in operation sequences. So, this is the only work referring
to importance of both avoiding backtracks and many advantages of flow lines
over job shop cells. There is a restriction in this study on the definition of
backtracking as it refers to having same operation in the .sequence at least one more time. In fact, any backward movement in a flow line should be considered as a backtrack. At the third stage, part groups are formed, and at the fourth stage, these part groups are merged according to their similarity in operation secjuences to form part families. Finally, machines are allocated to cells, but how thé layout can be formed within cells, is not addressed in the study. Com mon to all previous modéls, importance of design attributes is discarded and part families are formed independent of design similarities.
CHAPTER 2. AN OVERVIEW OF THE EXISTING TECHNIQUES 17
Although, these studies consider one more attribute than the other methods, one should consider more attributes such as design attributes, workload levels, and the material handling within cells to obtain part families to reach as much benefit as possible from the CM view. Design attributes are very important in all phases of implementation of cellular manufacturing systems. The way to handle these design attributes is to use coding systems, flyer and Wemmerlov indicates that in purchasing activities and new part design orders, benefits of coding systems are significant. 80 percent of the new part design orders exist in the previous designs or a very slight modification was required. Also in the production pha.se, the design attributes such as length to diameter ratio, rota tional or nonrotational parts lead to differences in the manufacturing resource requirements. Therefore, in some manner, the design and manufacturing at tributes should be combined or simultaneously activated to group parts. More information we carry in our code, more reliable groupings we will have.
2.4
Use of Coding Systems in a SC M
A different approach for the part family formation problem is proposed by Offodile [17], who suggests the use of coding systems rather than the machine requirements in determining part families. The defense behind this claim is the increasing number of coding system users. He assumes that the code carries the information for length to diameter ratio, auxiliary holes, external holes, plane machining and surface machining, and all these attributes are represented by
an ordinal type variables. Therefore, the similarity between parts i and j , Sij,
is the sum of all similarities for each attribute as follows:
q _ Y^k=\
Lk=l Sijk =1
— ^ikft
^jk(
2.
10)
(2.11) where. Wijk =1
, if partsi and j can be compared for attribute k
0
, otherwiseSijk'. score between part i and j on attribute k
Xik- weight assigned to part i for attribute k
Rk'· range of attribute k taken over the population space
Using the OPITZ system and applying the above similarity coefficient which is very similar to former similarity coefficient calculations, the groups are formed by combining the nearest parts each time. But OPITZ is a mixed code so it is not possible to consider each attribute independently. Another problem is the modification of similarity coefficients when new groups are formed. The new similarity coefficient is the smallest one between the candidate part and each element of the group. So a part, which is similar to one part, might be dissimilar to another part.
In the next section, a group of computer programs, which can perform most of the above methods, will be presented. These programs will be referred
frequently in the next chapter where the proposed model for an efficient part- family machine-cell formation technique is being discussed.
CHAPTER 2. AN OVERVIEW OF THE EXISTING TECHNIQUES 19
2.5 Cluster Analysis Programs
Cluster analysis is the art of finding groups in data. As the computers become available to handle large data, the algorithms to find groups in data could easily be implemented. Nowadays clustering methods are applied in many do mains, including marketing, political science, pattern recognition, economics and, many more. Since the group technology problem is actually a problem of finding groups of parts, we can apply clustering methods in dealing with
this problem. Rousseeuw and Kaufmann [
8
] wrote the book "Finding Groupsin Data” which describes the clustering techniques including the theoretical background for each technique. All the techniques are computerized and the user can take the help of these programs to find clusters.
The main idea of all these programs is to find clusters according to the pairwise dissimilarities between items. These dissimilarities could be input by the user or computed by the software. The di.ssimilarity between two items depends on the types of variables included in items’ codes. A code for an item might include a number of variables, which might be all the same type or a combina tion of various types. The following types of variables can be used for coding purposes:
i) Symmetric Binary ii) Asymmetric Binary iii) Nominal
iv) Ordinal v) Interval vi) Ratio
Symmetric binary values are used when there are two possible outcomes and each outcome has the same value with the other. Asymmetric binary variables are used in the case where there are again two outcomes, but only one is taken into account to compare with another item. To show the difference between symmetric and asymmetric binary variables, consider the case where value ” 1” shows that a part is processed on a particular machine and ” 0” shows it is not. In the symmetric case, both 0-0 and 1-1 matches will be counted as similarities, however for asymmetric case, only 1-1 matches will be counted.
Nominal and ordinal variables might take more than two values, and the dif ference is in the nominal case, if two values are not the same, the dissimilarity between these two values is same whatever those values are, where as in the ordinal case, the dissimilarity depends on the order of the values. The values closer in the order are less dissimilar. To give an idea about the applica tion arecus, consider the raw material and length to diameter ratio attributes. Nomina] values are appropriate to represent the raw materials since two items dissimilar if their materials are not the same and this dissimilarit}' will not change according to types of material. But in the length to diameter ratio case, ordinal values are more appropriate, since there is a predetermined or der for the ratios and the dissimilarity between two items depend on this order.
Interval scaled values play role when the intervals are equal in linear case, e.g. the interval .between 18 and 28 is equally important as the interval 41 and 51. But in the ratio scaled variables, the distinction between 2 and 20 has the same meaning with the distinction between 20 and 200.
After explaining the types of varial)les, we describe the programs used for clus tering purposes. The initial step is to find dissimilarities between the items, d'he program DAI.SY (Dissimilarity Coefficients Computation) computes di.s- similarities between the objects. The contribution of each variable to the di.s-
CHAPTER 2. AN OVERVIEW OF THE EXISTING TECHNIQUES 21
The dissimilarity d(i,j) is defined as
_
e;,, 4/Ч-*
r .u 4 "
(
2.
12)
where the indicator is set equal to 1 when both measurements and xj/
for the ft h variable are nonmissing, that is there are values for the fth attribute
for both items i and j , and it is set equal to 0 otherwise. Moreover, S^P can
also be set equal to 0 when variable / is an asymmetric binary attribute, and
objects i and j constitute a 0-0 match. d\P is the contribution of the / th
variable to the dissimilarity between objects ¡ .and j. If the variable / is either
S3'mmetric binary or nominal, the contribution is defined as
(/) _ J 1, if ^if Ф Xjf
d>C =
0, otherwise
If the variable is asymmetric binarv. then
d}C = 0, if J.7 = Xjf
1, otherwise
= 1
If the variable is either interval scaled or ordinal, then the contribution is simply the ratio of the difference between the values to the range of values for that attribute.
After computing the dissimilarities, to obtain k clusters, program PAM (Parti
tioning Around Medoids) selects к representative objects in the data set. The
idea is that the average distance (dissimilarity) of the repre.sentative object to other objects in the same cluster is going to be minimized. The input to the program is the dissimilarity matrix obtained bj' D.AISY. The output is the
clustering from ki to А’г clusters based on the user’s request.
FANNY (Fuzzy Analysis) can be applied to same data .sets as PAM, with the same input dissimilarity matrix which is an output of program DAISY. But it differs in its operational structure. It avoids to make hard decisions.
instead, it says tliat an object i belongs to clusters 1, 2, 3, ... with a cer
tain probability, which is also called a membership coefficient. One advantage
of this program is that it allows the flexibility to assign objects to other clusters.
Hierarchical algorithms do not construct a single partition with k clusters,
but they deal with all values of k in the same run. Two types of hierarchical
methods are Agglomerative Nesting and Divisive Analysis. The input structure
is the same as former methods, but number of clusters is not demanded from the user. In the Agglomerative Nesting, at the beginning, there are n clusters, and at each step the number of clusters decreases by one and at the end there is only one cluster including all objects. The only difference in Divisive Analysis
is that it works in the opposite direction, that is from one cluster to n clusters.
In all of the above clustering algorithms, which are described in detail in the book ’’ Finding Groups in Data" [8], the output consists of clusters, their ele
ments and some efficiency measures related with clusters. Diameter oi cluster
C is defined as
and separation is defined as
Optional graphical output that shows which objects lie well in the cluster and
which have intermediate positions, is called silhouettes. Each cluster is repre
sented by one silho-uette. To define silhouette coefficient, we need the following definitions:
Let’s consider a cluster A and an object i in that cluster.
n{i) =average dissimilarity of i to all other objects of A,
now consider other cluster C,
d{i, C) =average dissimilarity of i to all objects of C
max d{i^j) (2.13)
min d(l,h)
leCMC (2.14)
.After computing d{i, C) for all clusters C ^ A, we select the smallest of those:
CHAPTER 2. AN OVERVIEW OF THE EXISTING TECHNIQUES 23
Tlie cluster B for which this minimum is attciined is called the neighbor of
object i. This is like the second-best choice for object i. Combining a(i) and
b(i) into one formula, we can define the silhouette coefficient, s(f), as follows:
s(f)
_ b(i) — a(i)m ax(a(f), b{i)) (2.16)
For each object i,
- l < s ( i ) < l . (2.17) The silhoutte coefficient for a cluster gives an idea about the efficiency of that cluster. After execution of each program to find clusters, the output informs the user about the silhoutte coefficient for each cluster. Averaging these silhouettes gives us a measure for the entire data set and if this average silhouette coefficient is close to 1, then the clustering is well structured. Hence, the silhoutte coefficients for each cluster and the average silhoutte coefficient are the important measures to evaluate how efficient the data set is clustered. An example of use of these measures will be illustrated in .Section 4.2.
2.6
Conclusion
In this chapter, the part-family and machine-cell formation problem is dis cussed with examples of models in the literature. The main deficiency of these models is discarding the use of design attributes and machining requirements simultaneously. Coding systems use the design information, whereas the ma trix and mathematical programming formulation use the machine requirement information. Two formulations differ in a way that matrix formulation has no input parameter on the number of part families and the MP formulation assumes the number of families as an input parameter. This is the superi ority of mathematical programming methods as it allows trying for different
In the next chapters, dissimilarities baised on both design attributes and op eration sequences will be presented. The assumptions and definitions for a new model will be stated. This model will have the flexibility to see many alternatives that is different number of part families, and these alternatives will be evaluated under some objectives such as machine investment, machine utilization and material handling.
Chapter 3
Problem Statement
3.1
Introduction
In the previous chapter, the models handling part-family machine-formation problem were discussed in detail. We concluded that both matrix and mathe matical programming formulations failed to consider design attributes and did not deal with operation sequences, only exceptions were the studies done by Vakharia and Wemmerlow [23], and Tam [22]. However, these two studies are restricted to determine part-families only, since they do not propose a way to determine how the machines will be arranged in each cell. Therefore, form ing part-families regardless of machine cells may cause some problems related with the material handling, since in a modified flow line, all materials move in the same direction so that production planning, scheduling, and material handling will be easier to control. Therefore, determination of part families and machine cells should be done simultaneously and there should be a control mechanism that carries feedback between these two problems. In section 3.2, we list and discuss the design attributes and we will focus on the necessity to include them in a part-family formation process. Section 3.3 proposes a way of computing dissimilarities based on operation sequences and gives a compari- ■son between the dissimilarities obtaintxl by SCM [4] and a revised Levensthein distance measure. The objectives and a.ssumptions for our problem will be stated in Section 3.4, and the mathematical programming model will be given
in Section 3.5.
3.2
Dissimilarities Based on Design Attributes
Design attributes for a part may include the information about the geometric sliape, raw material, existence of internal or external holes, length to diameter ratio, etc. In the coding systems, the information kept for design attributes are mostly similar. In OPITZ, first digit is for component class, i.e. rotational or nonrotational part, second digit is for overall shape, such as rectangular or round, third digit is for rotational machining, fourth digit is for plane machin ing, fifth is for auxiliary holes and the succeeding digits carry information for raw material t}'pe, accuracy and tolerances. The first two digits constitute a m onocode and the others are polycode. In Section 2.2.1 coding systems and types of codes were described in detail. These codes are important and useful in many applications such as design, manufacturing, and purchasing.
In the design phase, the codes prevent the creation of unnecessary new parts by providing a convenient design retrieval mechanism. Any proposed new part is first sketched and coded. Next, the designer searches the data base for coded parts with the code. This is done with the expectation to find an existing or similar code. If there is one, then there is no need to redesign that new part to eliminate waste of time. It is a fact that the firms have thousands of parts and the designers would not keep each part’s shape or characteristics in mind.
In the manufacturing phase, the application of code.' for design attributes can yield significant benefits. The process planning, which is defined as the deter mination of the routing and the sequence of manufacturing operations required to produce a given item, is related to parts’ similarities. Theoretically, a set of parts with similar geometry and made of same raw material would probably require approximately the same proce.ss plan. Unfortunately, this is not the case in many manufacturing firms. The parts with similar design characteris tics may have mutually separate process plans. This is due to different process
CHAPTER 3. PROBLEM STATEMENT 27
planners planning at different times. A common GT database can inform the process planner about the process plans for similar items when determining a new process plan for a proposed item. Some of the design attributes, such as surface machining or dimensions are also directly related to manufacturing activities. So this standardization will prevent duplication and provide consis tent process plans.
We used a coding system similar to those described in Section 2.2.1 with five digits to differentiate parts by considering their shape and design attributes. The code fields carry information for rotational or nonrotational, overall shape, rotational and plane machining, auxiliary holes and raw material, respectively. The first four digits are of ordinal type and the last digit for raw material is of nominal type. After coding all parts with the above structure, we can get pairwise dissimilarities for all the parts by running the program DAISY, which was illustrated in Section 2.5. The output is a dissimilarity matrix based on
design attributes, DA, which will be referred in the following discussions.
3.3
Dissimilarities Based on Operation Sequences
We consider operation sequences to obtain part-families that include parts sim ilar in both processing requirements and flow direction in a flow line cell. There should be no backtrackings within the cell to ease the material handling. Also, production planning and scheduling functions will be easier to control. The dif ficulty to find a dissimilarity measure between parts arises from the interesting structure of the parts routing data. We cannot compare two part routings in a digit to digit manner, since each symbol in a routing represents a sequence, and this sequence is directly dependent upon the precc'ding and succeeding symbols. Treating the symbols in routings as independent symbols is the same as using SCM (Similarity Coefficient Methods) with binary values. So we can
not handle routings information neither with the ordinal nor nominal values, so
the operations sequences. Another method might be using the Levensthein dis tance, which is defined as the minimum number of substitution, insertion, and deletion transformations required to transform one string to another. Tam [22] used this measure to compute pairwise dissimilarities between the routings, then formed the part families based on those dissimilarities. However, in its original form, it is not really eligible for determining similar or dissimilar parts, since it does not deal with whether the parts have backtracks or not. Also, the substitution is a quick way of deletion and insertion, which decreases the distance level between two disjoint sequences. Therefore, a new dissimilarity that considers backtrackings, common sequences and di.sjoint sequences will be proposed.
The revised dissimilarity between two sequences, which allows only insertion and deletion transformations, is defined in the following way:
d{j —
M M N O T i j
COMii
if two strings carry opposite sequences if COMij > 0
(k).MNOTij if COMij = 0
where,
dij : dissimilarity between strings i and j
MNOTij : minimum number of insertions and deletions required to
transform string i to j
COMij : number of common operations in strings i and j
M : a big number which states that two strings are entirely dissimilar
k : a constant for penalizing disjoint sequences
A big constant number M is used to prevent two parts with backtracking se
quences to be assigned to the same cell by assigning a big dissimilarity. If two parts have common operations in their routings, we divide the minimum number of insertion and deletions by the number of common operations. The
CHAPTER 3. PROBLEM STATEMENT 29
reason might be explained in the following manner; more common operations result in less dissimilarity whereas fewer common operations cause high dis similarity. It is intuitive that parts with more common operations are more likely to be in the same cell. If two parts have no common operations, then
we find a dissimilarity using a penalizing factor k. By a similar logic, we can
say that to process these parts in the same cell, we should place two different sets of machines in the same cell which means a high machine investment cost.
In our study, different combinations of k and M are tested using the cluster
analysis programs discussed in Section 2.5. Very big values of k and M make
the cluster analysis programs work worse, since these big values penalize the dissimilarities, but at the same time reduce the impact of actual similarities.
If we use a very big k value, we find that we penalize disjoint operations more
than backtrackings. On the other hand, very small k and M values do not
yield a great variation from other dissimilarities, and this may produce cells consisting of parts with uncommon operations and backtrackings. So, the.se values should be selected after investigating the entire data set. In addition, the parts with backtrackings should be penalized more than parts with disjoint operations. In an example, we can test the efficiency of the revised dissimilarity
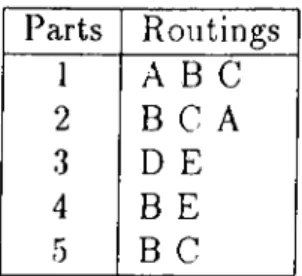
for the following parts according to given routings in Table 3.1. We used M as
twice as the biggest value among all the dissimilarities and k was set equal to
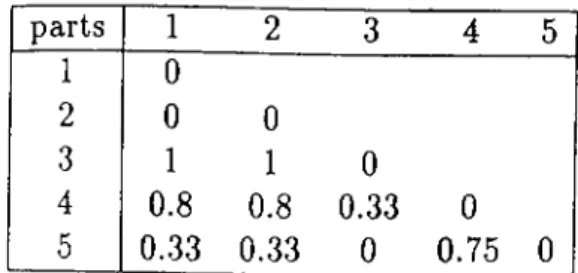
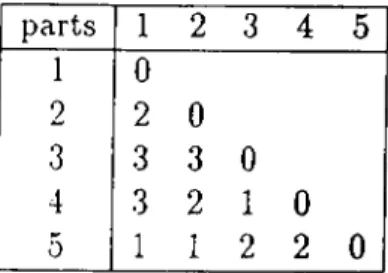
2. We see that parts 1 and 2 have reverse sequences so they should not be in the same cell. We will compare the resulting part families obtained by SCM, the proposed revised distance measure and the original Levensthein distance. The dissimilarity matrices are given in Table 3.2., 3.3 and 3.4, respectively.
Parts Routings 1 A B C 2 B C A 3 D E 4 B E 5 B C
Table 3.1. Part Routing Information
parts 1 2 3 4 5 1 0 2 0 0 3 1 1 0 4 0.8 0.8 0.33 0 5 0..33 0.33 0 0.75 0
Table 3.2. Dissimilarities based on SCM
parts 1 2 3 4 5 1 0 2 100 0 3 10 10 0 4 4 4 0.5 0 5 0.5 0.5 8 3 0
Table 3.3. Dissimilarities based on Revised distance measure
for SCM and two for the others. The number of clusters for each dissimilarity measure was found by the PAM and FANNY programs, which were described in the previous chapter. The number of families is found when the silhouette coefficient is maximum for each dissimilarity measure for each alternative. The silhouette coefficient is a measure that helps to understand which alternative is the best selection based on the given dissimilarities where the alternatives were defined as the number of clusters. In Table 3.5, the parts in each family are shown. It is undesirable to assign parts 1 and 2 into the same cell, since there is a backtrack between those parts, and it conflicts with the modified flow line purposes. The propo>cd dissimilarity measure considers this idea, and assigns them into separate families. Furthermore, the families formed by the revised measure consist of parts that have at least one common operation with the other parts assigned to that cell.
CHAPTER 3. PROBLEM STATEMENT 31 parts 1 2 3 4 5 1 0 2 2 0 3 3 3 0 4 3 2 1 0 5 1 1 2 2 0
Table 3.4. Dissimilarities based on original Levensthein distance
SCM Revised distance Levensthein 12 1 3 4 1 2 .5 3 5 2 5 3 4
Table 3.5. Part families based on different dissimilarity measures
3.4
Objectives and Assumptions
In the previous two sections, we focus on the importance of design attributes and operation sequences to form part families and machine cells. However, we need some measures to evaluate the performance of the resulting part families and machine cells. So, we exhibit some objectives and discuss the necessity of them in a GT problem.
M a ch in e In vestm en t: The investment for the machines plays an important role in establishing the cells. The methods in the literature do not deal with the cost of the machines, as a matter of fact, they discard the machine cell formation task. If there is no limitation on the amount of machine investment, then it is certain that forming machine cells in such a way that neither back trackings nor intercellular movements will take place. In this case, we have no bottleneck machines, that is no machine is shared by two or more cells. On the other extreme, if the investment capacity is too limited, backtrackings and intercellular movements would be unavoidable.
a decrease in the utilization of the machines. In a shop floor, the management policy might require minimum and maximum utilizations for each machine type. Investing on more machines reduces utilizations of the machines in the cells. Similarly, investing on fewer will increase the utilization. Therefore, we should examine such utilization levels even though they are not hard con straints. In other words, if possible, using the feedback produced by utilization levels, the machines violating the given maximum and minimum utilization levels will be omitted and the parts having those machines on their routings will be shifted to other machines.
N u m b e r o f S kippin gs: The existing models often deal with part families and they do not make any effort on machines’ arrangement in cells. However, the success in forming part families having very similar parts may turn to a failure when the cell loading problem is considered. The layout of the cell may have a significant impact on the cell loading problem. Line type layout is more appropriate to take advantage of cellular manufacturing benefits which were
described in previous chapters. The line layout supports the m odified flow shop
idea, and it is preferred since scheduling and visual control of cells become much less cumbersome. Another advantage is the applicability of .Japanese Kanban system, as it is possible to integrate .Just-In-Time .system into cellular manu facturing system.
A cost measure is required to evaluate the layout in terms of material han dling activities. Each skipping is an increase in the material handling cost, hence our second ob jectiw' is to minimize the number of skippings.
B alan ced W o rk lo a d s w ith in cells: The case where the workloads of the machines deviate so much will not be appropriate for the Kanban system. The reason is simply the delays in front of the highly utilized machines and this cause high level of work in process inventories. High level of inventories is detri mental to the success of .JIT systems. In our model, the variability within each cell is a measure to provide balanced workloads, which is required to establish a Kanban system.