JHEP03(2020)051
Published for SISSA by SpringerReceived: November 12, 2019 Accepted: February 20, 2020 Published: March 10, 2020
Search for physics beyond the standard model in
multilepton final states in proton-proton collisions at
√
s = 13 TeV
The CMS collaboration
E-mail: [email protected]
Abstract: A search for physics beyond the standard model in events with at least three charged leptons (electrons or muons) is presented. The data sample corresponds to an
inte-grated luminosity of 137 fb−1 of proton-proton collisions at√s = 13 TeV, collected with the
CMS detector at the LHC in 2016–2018. The two targeted signal processes are pair pro-duction of type-III seesaw heavy fermions and propro-duction of a light scalar or pseudoscalar boson in association with a pair of top quarks. The heavy fermions may be manifested as an excess of events with large values of leptonic transverse momenta or missing trans-verse momentum. The light scalars or pseudoscalars may create a localized excess in the dilepton mass spectra. The results exclude heavy fermions of the type-III seesaw model for masses below 880 GeV at 95% confidence level in the scenario of equal branching fractions to each lepton flavor. This is the most restrictive limit on the flavor-democratic scenario of the type-III seesaw model to date. Assuming a Yukawa coupling of unit strength to top quarks, branching fractions of new scalar (pseudoscalar) bosons to dielectrons or dimuons above 0.004 (0.03) and 0.04 (0.03) are excluded at 95% confidence level for masses in the range 15–75 and 108–340 GeV, respectively. These are the first limits in these channels on an extension of the standard model with scalar or pseudoscalar particles.
Keywords: Beyond Standard Model, Hadron-Hadron scattering (experiments)
JHEP03(2020)051
Contents
1 Introduction 1
2 The CMS detector 3
3 Data samples and event simulation 3
4 Event reconstruction 4
5 Event selection 6
6 Background estimation and systematic uncertainties 8
7 Results 11
8 Summary 22
The CMS collaboration 30
1 Introduction
A search for new phenomena in final states with at least three charged leptons (electrons
or muons) is presented, using 137 fb−1of proton-proton (pp) collision data at√s = 13 TeV
collected by the CMS experiment at the CERN LHC from 2016 to 2018. The results are interpreted in the context of two beyond the standard model (SM) theories, namely the type-III seesaw and light scalar or pseudoscalar sector extensions to the SM. The event selection and signal region definitions are chosen in a way that allows other models to be tested. Phenomenologically, these models show complementary signatures of resonant and nonresonant multilepton final states, as described below.
The seesaw mechanism introduces new heavy particles coupled to leptons and to the
Higgs boson, in order to explain the light masses of the neutrinos [1–9]. Within the
type-III seesaw model, the neutrino is assumed to be a Majorana particle whose mass arises via the mediation of new massive fermions. These massive fermions are an SU(2) triplet
of heavy Dirac charged leptons (Σ±) and a heavy Majorana neutral lepton (Σ0). In pp
collisions, these massive fermions may be pair-produced through electroweak interactions in both charged-charged and charged-neutral pairs. Multilepton final states arise from the
decays of each of the Σ+Σ−, Σ+Σ0, and Σ−Σ0 pairs to the nine different pairs of W, Z, and
Higgs bosons with SM leptons and the subsequent leptonic decays of the SM bosons. A
complete decay chain example would be Σ±Σ0 → (W±ν)(W±`∓) → (`±νν)(`±ν`∓), where
JHEP03(2020)051
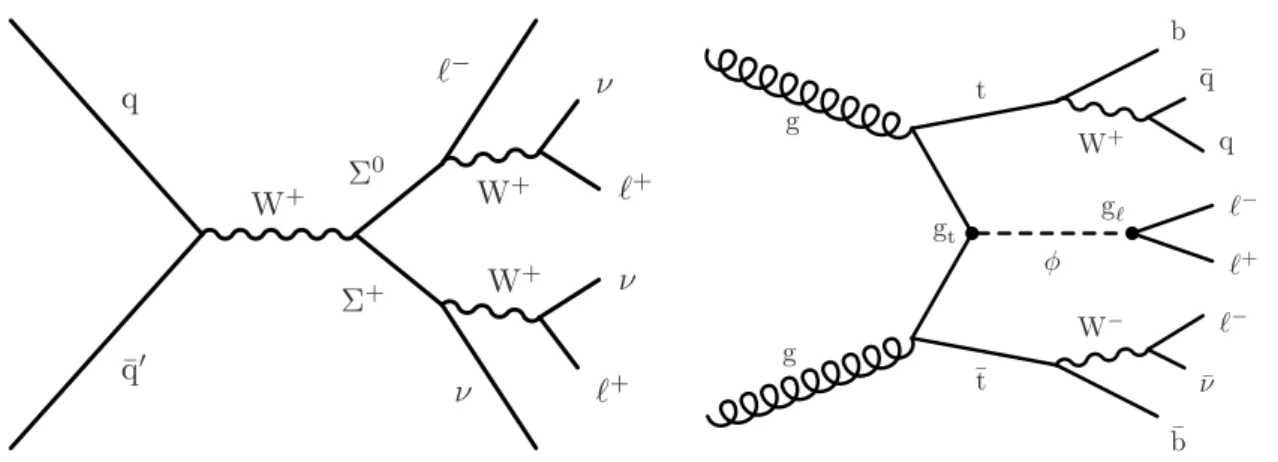
¯ q0 q ⌫ ` W+ Σ+ Σ0 W+ W+ `+ ⌫ `+ ⌫ <latexit sha1_base64="Fxzh4+OeeLEAQ//sSYCT3HY3i4g=">AAAGWXichVRdb9MwFE1HV0b42ph44iVimxg0VEm6brxUmuCFxyHYh7R0k5M6rTXHDo4bVqzwI/g1vMK/QPwZbrJ+JO3aWark3nvO9bnHzvUiSmJpWX8rK/eqq7X7aw/0h48eP3m6vvHsJOYD4eNjn1MuzjwUY0oYPpZEUnwWCYxCj+JT7+pDlj9NsIgJZ1/kMMKdEPUYCYiPJIQuN6p118M9wlQQBgGhOFUBHrKeQFE/1acpv4/Em3TXsSzTblqvdd0wDBfiFAdSEdskTjoOCdLrS8Vtkzsmb5p8z+Qtk+9P8iqiiDDzG+nKfttuNFNFHDOBEvYU4vGYM5Mir73tilCdpheqnm6bErOskbbTaBX5QE6c2fpjrF1EgqqkCWAz2csl7RhjUoBFCPAJzZrQDlpwwog0q7AoAiCtJU2CGwn40FxWYs9MlvnEszy4meuewvqISR6O3PKQUK7E15JxESKqvqbpq6lxVppdVlJwuswuEcs0ZzHtB6zbrsnK0o2YfMft7J1Agy2wf2GRO0rk7wpq7Jfuoaz/M+mF6EJZZe2Zr84dlPoMxVms1MWUXqi3ZQJfJosNyli7WBwgmKocBKnWXDw/DeRl97+ANF+sQILO52RNPo6GU3zcO7rhYtadfvD6+G8+GvTL9S2rYeXLmN/Yo82WNlpHlxuV526X+4MQM+lTFMfnthXJjkJCEj+r6A5iHCH/CvXwOWwZCnHcUflYS40diHSNgAv4MWnk0SJDoTCOh6EHyBDJfjyby4K35c4HMnjXUYRFAzDCvzkoGFBDciObkUaXCOxLOoQN8gUBrUbmB/IlTNLSKfmgJP51qRMlBWJxhAR0XU5kszWMciPtWdvmNydOw242nE/O1uH7kaVr2gvtpbar2dqBdqh91I60Y82v/qz+qv6u/ln9V6vU1mr6DXSlMuJsaqVV2/wPucsSoA==</latexit> g g W+ W− ¯t t ¯ b ¯ ⌫ `− `+ `− q ¯ q b gt g` <latexit sha1_base64="1cFrdOJhO0tdZSOGYvC/f4cXDbQ=">AAAMMXicnVbLjts2FNUkfaRyH5kWXWUjdCZoWmsMPSw7mwGCdtNlinYyAUYTg5Ipm40kaiTazYRgviHb9jf6NdkV3fYneil59KAfE1eAAZr3nHsuLy8vGWQxKZhlvTu4c/eDDz/6+N4neu/Tzz7/4v7hl88KushDfBbSmObPA1TgmKT4jBEW4+dZjlESxPg8ePmjtJ8vcV4Qmv7KrjN8maBZSiISIgZTk0P9rh/gGUl5lEQRibHgEb5OZznK5kJvTOEc5d+LR45lmbZrfafrhuHDdIwjxoltEjswiSNWszmZzRmnlkltkzomdU06NKln0pFJxzcgPosXNDVjFJweH5sMpzLEU2dg/k6mbH5qD1zBiWMuhzUhixFJG3PDEXxpm0vAugA3l95eEpJZE6aomOOiYvh5wv1sTkRDtQdemyv1Rkp4ipjCoJIB2RD6Q8NY8QJarAepKkGUj9skELtVS3Ig/3WA7ytkB3utCSjU2i8LpcjeoXnmcrxfZF673t4rMqkBdSrqAkcBjvmxj+P4xckxAOpybFv60uJusvATIW2OagtQzv10URpt1cjwK5bSPEExvyoR3kZ6B1biRrfhggpn7VAMSsS4i/DnRYZCzE/GSSI68JmYdBRYqbB0t/BHwPeX1R9v4G30BnkrfbSO1hyljCarc9nBv9n1NftsVSe9Xdr/0+cGx9DivM1+WxQO/cQ4F1BFbS50rWb/b+X2u9yhSbflSN14uS2K7nKLbpfWZXmtfjyl7KYDtvpSdwV+DDfRFE04KyNiQmmo1bbQkdLa4JzWB1RtHG7Z6YcKKcJ5AvDGcU0be1Wjrq4Ste0q3dxbD6QtDz6gpbi73QzVlKy5GZaXQKW1LXdlvq7Et+slvDXdV2pV7sDKqpIXHBQV77c3RJoHBXmNT+XdXm25u2uHdzspnwLyLCvZ7671FzJL0AtuCbW+5dV8C6m/Xtjb4617cptCdweXLrpouytw00IBVnXqNUup6Wc5SXBfrO6QLfRNjlv0thOZmQ0xNxeb06l73cfptHnJ1X/LN9/k/pE1sMrPWB/Yq8GRtvqeTg4PvvanNFwkOGVhjIriwrYydslRzkgIDnV/UWBo8i/RDF/AMEUJLi55+VwVxkOYmRoRzeGXMqOcbTM4SoriOgkAmSA2L1SbnNxku1iw6PElJ2m2gDSElVC0iA1GDfn2NaYkxyGLr2GAwpxArIZMBwoZvJA7KuUDmISvOivhLEcp3F05rLprkG/mJBM6JNJW07Y+eOYMbHfg/OwcPflhldJ72gPtG+2RZmtj7Yn2k/ZUO9NC/Tf9rf6H/mfvr9673t+9fyronYMV5yut8/X+/Q/WiSL7</latexit>Figure 1. Leading order Feynman diagrams for the type-III seesaw (left) and tt φ (right) signal models, depicting example production and decay modes in pp collisions.
signal production and decay combinations of the seesaw signal are simulated [10]. The Σ±,0
are degenerate in mass, their decays are prompt, and the Σ decay branching fractions are identical across all lepton flavors (flavor-democratic scenario). This is achieved by taking
the mixing angles to be Ve = Vµ= Vτ = 10
−4
, values that are compatible with the existing
constraints [10–14].
New light scalars or pseudoscalars are a ubiquitous feature of many theories of physics beyond the SM, including, but not limited to, extended Higgs sectors, supersymmetric
theories, and dark sector extensions [15–18]. We consider a generalization of a simple
model [19, 20], where a new light CP-even scalar or CP-odd pseudoscalar boson (φ) is
produced in pp collisions via a Yukawa coupling of the φ to top quarks, gt, either in
three-body associated production with top quark pairs, or in top quark pair production with three-body top quark decays, t → bWφ. The signal is collectively labeled as ttφ. In this paper, we search for decays of the φ boson via a Yukawa coupling to the charged leptons,
g`, into dielectron or dimuon pairs within multilepton events. The decays of the φ boson
into tau-tau lepton pairs are not considered. It is assumed that g` gt and that all other
couplings of the φ boson are negligible. Furthermore, the φ boson decays are taken to be prompt, and the φ branching fractions into different flavors of charged lepton pairs,
B(φ → ``), as well as gt, are left as free parameters.
Figure 1illustrates example diagrams for the production and decay of heavy fermions
in the type-III seesaw model (left) and a light scalar or pseudoscalar boson in the ttφ model (right).
Prior searches for the manifestation of the type-III seesaw model have been conducted
by the ATLAS and CMS Collaborations using data recorded at√s = 7, 8, and 13 TeV [21–
24]. The most stringent constraints in the flavor-democratic scenario are from a CMS search
using 13 TeV data collected in 2016, which excluded Σ masses below 850 GeV [24]. The
present study of the ttφ model is the first direct search for a light scalar or pseudoscalar boson in leptonic decays produced in association with a top quark pair.
JHEP03(2020)051
2 The CMS detector
The central feature of the CMS apparatus is a superconducting solenoid of 6 m internal diameter, providing a magnetic field of 3.8 T. Within the solenoid volume are a silicon pixel and strip tracker, a lead tungstate crystal electromagnetic calorimeter (ECAL), and a brass and scintillator hadron calorimeter, each composed of a barrel and two endcap sections. Forward calorimeters extend the pseudorapidity (η) coverage provided by the barrel and endcap detectors. Muons are detected in gas-ionization chambers embedded in the steel flux-return yoke outside the solenoid. A more detailed description of the CMS detector, together with a definition of the coordinate system used and the relevant
kinematic variables, can be found in ref. [25]. The CMS detector uses a two-tiered trigger
system [26]. The first level, composed of custom hardware processors, uses information
from the calorimeters and muon detectors to select the most relevant pp collision events at rates up to 100 kHz. These are further processed by a second level consisting of a farm of processors, known as the high level trigger, that combines information from all CMS subdetectors to yield a final event rate of less than 1 kHz for data storage.
3 Data samples and event simulation
The data samples analyzed in this search correspond to a total integrated luminosity of
137 fb−1 (35.9, 41.5, and 59.7 fb−1 in years 2016, 2017 and 2018, respectively), recorded in
pp collisions at √s = 13 TeV. A combination of isolated single-electron and single-muon
triggers was used with corresponding transverse momentum (pT) thresholds of 24 and
27 GeV in 2016, 27 and 32 GeV in 2017, and 24 and 32 GeV in 2018. Event samples from Monte Carlo (MC) simulations are used to estimate the rates of signal and relevant SM background processes. The WZ, Zγ, ttZ, ttW, and triboson backgrounds are generated
using MadGraph5 amc@nlo (2.2.2 in 2016, 2.4.2 in 2017 and 2018 data analyses) [27]
at next-to-leading order (NLO) precision. The top quark mass used in all simulations is 172.5 GeV. The ZZ background contribution from quark-antiquark annihilation is
gener-ated using powheg 2.0 [28–30] at NLO, whereas the contribution from gluon-gluon fusion
is generated at leading order (LO) using mcfm 7.0.1 [31]. Backgrounds from Higgs boson
production for a Higgs boson mass of 125 GeV are generated at NLO using powheg and
JHUGen 7.0.11 [32–35]. Simulated event samples for Drell-Yan (DY) and tt processes,
generated at NLO with MadGraph5 amc@nlo and powheg, respectively, are used for systematic uncertainty studies.
All signal samples are simulated using MadGraph5 amc@nlo 2.6.1 at LO precision. The production cross section for the type-III seesaw signal model σ(ΣΣ) is calculated at NLO plus next-to-leading logarithmic precision, assuming that the heavy leptons are SU(2)
triplet fermions [36,37], while the ttφ production cross section σ(ttφ) comes directly from
the MadGraph5 amc@nlo 2.6.1 generator at LO precision.
All background and signal samples in 2016 are generated with the NNPDF3.0 NLO or LO parton distribution functions (PDFs), with the order matching that in the ma-trix element calculations. In 2017 and 2018, the NNPDF3.1 next-to-next-to-leading order
JHEP03(2020)051
PDFs [38,39] are used. Parton showering, fragmentation, and hadronization for all samples
are performed using pythia 8.230 [40] with the underlying event tune CUETP8M1 [41]
for the 2016 analysis, and CP5 [42] for the 2017 and 2018 analyses. Double counted
par-tons generated with pythia and MadGraph5 amc@nlo are removed using the FxFx [43]
matching schemes. The response of the CMS detector is simulated using dedicated software
based on the Geant4 toolkit [44], and the presence of multiple pp interactions in the same
or adjacent bunch crossing (pileup) is incorporated by simulating additional interactions, that are both in-time and out-of-time with the hard collision according to the pileup in the data samples.
4 Event reconstruction
A particle-flow (PF) algorithm [45] aims to reconstruct and identify each individual particle
in an event, with an optimized combination of information from the various elements of the CMS detector. In each event, the candidate vertex with the largest value of summed
physics-object p2T is taken to be the primary pp interaction vertex (PV). Here the physics
objects are the jets, clustered using the jet finding algorithm [46, 47] with the tracks
assigned to candidate vertices as inputs, and the associated missing transverse momentum,
taken as the negative vector sum of the pT of those jets. The energy of photons is obtained
from the ECAL measurement. The energy of electrons is determined from a combination of the electron momentum at the PV as determined by the tracker, the energy of the corresponding ECAL cluster, and the energy sum of all bremsstrahlung photons spatially compatible with originating from the electron track. The energy of muons is obtained from the curvature of the corresponding track. The energy of charged hadrons is determined from a combination of their momentum measured in the tracker and the matching ECAL and HCAL energy deposits, corrected for zero-suppression effects and for the response function of the calorimeters to hadronic showers. Finally, the energy of neutral hadrons is obtained from the corresponding corrected ECAL and HCAL energies.
Jets used in this analysis are reconstructed using the anti-kT algorithm [46] with a
dis-tance parameter of 0.4, as implemented in the FastJet package [47]. Jets are required to
have pT> 30 GeV and, to be fully in the tracking system volume, |η| < 2.1. Jet momentum
is determined as the vectorial sum of all particle momenta in the jet, and is found from
simulation to be, on average, within 5–10% of the true momentum over the whole pT
spec-trum and detector acceptance. The effect of the pileup on reconstructed jets is mitigated through a charged hadron subtraction technique, which removes the energy of charged
hadrons not originating from the PV [45]. The impact of neutral pileup particles in jets is
mitigated by an event-by-event jet-area-based correction of the jet four-momenta [48–50].
Jet energy corrections are derived from simulation studies so that the average measured response of jets becomes identical to that of particle level jets. In situ measurements of the momentum balance in dijet, photon+jet, leptonically decaying Z+jet, and multijet events are used to determine any residual differences between the jet energy scale in data and
in simulation, and appropriate corrections are made to the jet pT [50]. Additional quality
JHEP03(2020)051
effects or reconstruction failures [51]. Finally, all selected jets are required to be outside a
cone of ∆R ≡p(∆η)2+ (∆φ)2= 0.4 around a selected electron or muon as defined below,
where ∆φ is the azimuthal distance.
A subset of these reconstructed jets originating from b hadrons is identified using the
DeepCSV b tagging algorithm [52]. This algorithm has an efficiency of 60–75% to identify
b quark jets, depending on jet pT and η, and a misidentification rate of about 10% for c
quark jets as well as 1% for light quark and gluon jets.
The missing transverse momentum vector ~pTmiss is computed as the negative vector
sum of the transverse momenta of all the PF candidates in an event, and its magnitude is
denoted as pmissT [53]. The ~pTmiss is modified to account for corrections to the energy scale
of the reconstructed jets in the event.
Electrons and muons are reconstructed by geometrically matching tracks reconstructed
in the tracking system with energy clusters in the ECAL [54] and with the tracks in the
muon detectors [55], respectively. Electrons are required to be within the tracking system
acceptance, |η| < 2.5, and muons are required to be within the muon system acceptance,
|η| < 2.4. Both electrons and muons must have pT> 10 GeV. Furthermore, electrons must
satisfy shower shape and track quality requirements to suppress those originating from pho-ton conversions in detector material as well as hadronic activity misidentified as electrons. Similarly, muons must satisfy track fit and matching quality requirements to suppress muon misidentification due to hadron shower remnants that reach the muon system.
Prompt isolated leptons produced by SM boson decays (either directly, or via an intermediate tau lepton) are indistinguishable from those produced in signal events. Thus, SM processes that can produce three or more isolated leptons, such as WZ, ZZ, ttZ, ttW, triboson, and Higgs boson production, constitute the irreducible backgrounds. Reducible backgrounds arise from SM processes, such as Z+jets or tt+jets production, accompanied by additional leptons originating from heavy quark decays or from misidentification of jets. Such leptons arising not from boson decays, but from leptons inside or near jets, hadrons that reach the muon detectors, or hadronic showers with large electromagnetic energy fractions, are referred to as misidentified leptons.
The reducible backgrounds are significantly suppressed by applying a set of lepton isolation and displacement requirements in addition to the quality criteria in the lepton
identification [54,55]. The relative isolation is defined as the scalar pT sum, normalized to
the lepton pT, of photon and hadron PF objects within a cone of ∆R around the lepton.
This relative isolation is required to be in the range of 5–15% for ∆R = 0.3 for electrons,
scaling inversely with the electron pT, and to be less than 15% for ∆R = 0.4 for muons. The
isolation quantities are corrected for contributions from particles originating from pileup
vertices. In addition to the isolation requirement, electrons must satisfy |dz| < 0.1 cm and
|dxy| < 0.05 cm in the ECAL barrel (|η| < 1.479), and |dz| < 0.2 cm and |dxy| < 0.1 cm
in the ECAL endcap (|η| > 1.479), where dz and dxy are the longitudinal and transverse
impact parameters of electrons with respect to the primary vertex, respectively. Similarly,
muons must satisfy |dz| < 0.1 cm and |dxy| < 0.05 cm. All selected electrons within a cone of
∆R < 0.05 of a selected muon are discarded, since these are possibly due to bremsstrahlung from the muons.
JHEP03(2020)051
In trilepton events, where misidentified-background contributions are dominant, addi-tional 3-dimensional impact parameter significance and b tag veto requirements are im-posed on the leptons, removing those with significant displacement with respect to the PV
or whose matching jet is b tagged. A PF jet with pT > 10 GeV and |η| < 2.5 is considered
to be matched if it is located within a cone of ∆R < 0.4 around the lepton without any further quality criteria on the jet. These electron and muon reconstruction and selection requirements result in typical efficiencies of 40–90 and 75–95%, respectively, depending on
the lepton pT and η [54,55].
5 Event selection
In both data and simulated event samples, events satisfying the trigger criteria are required to pass additional offline selections. Each event is required to have at least one electron
with pT > 35 GeV (30 GeV in 2016) or at least one muon with pT > 26 GeV (29 GeV in
2017) to be consistent with the trigger thresholds, depending on the trigger used to collect the event. Throughout this analysis, we consider events with exactly 3 leptons (3L) in one category and four or more leptons (4L) in another category. In the 4L event category, only
the 4 leading-pT leptons are considered. All events containing a lepton pair with ∆R < 0.4
or a same-flavor lepton pair with dilepton invariant mass below 12 GeV are removed to reduce background contributions from low-mass resonances as well as final-state radiation. The 3L events containing an opposite-sign same-flavor (OSSF) lepton pair with the dilepton invariant mass below 76 GeV, when the trilepton invariant mass is within a Z boson mass
window (91 ± 15 GeV), are also rejected. This suppresses events from the Z → ``∗ → ``γ
background process, where the photon converts into two additional leptons, one of which is lost. The event selection criteria for both the type-III seesaw and ttφ signal models are orthogonal to those used in the estimation of SM backgrounds.
In the context of the type-III seesaw extension of the SM, pair production of heavy fermions gives rise to events with multiple energetic charged leptons or neutrinos in the final state. Given the relatively high momenta of bosons and leptons originating from the decays
of these heavy particles, kinematic quantities, such as the scalar pT sum of all leptons, are
instrumental in suppressing SM contributions. This is especially valid for decay modes such
as Σ± → `±Z → `±`±`∓, where all of the daughter particles of the heavy fermion can be
reconstructed in the detector. However, pmissT can be used as a complementary kinematic
quantity in other decay modes, such as Σ0 → νH → νW±W∓ or Σ± → νW± → ν`±ν,
where neutrinos can carry a significant fraction of the outgoing momentum. We define LT
as the scalar pT sum of all charged leptons, and the quantity LT+pmissT is chosen as the
primary kinematic discriminant to select this variety of decay modes.
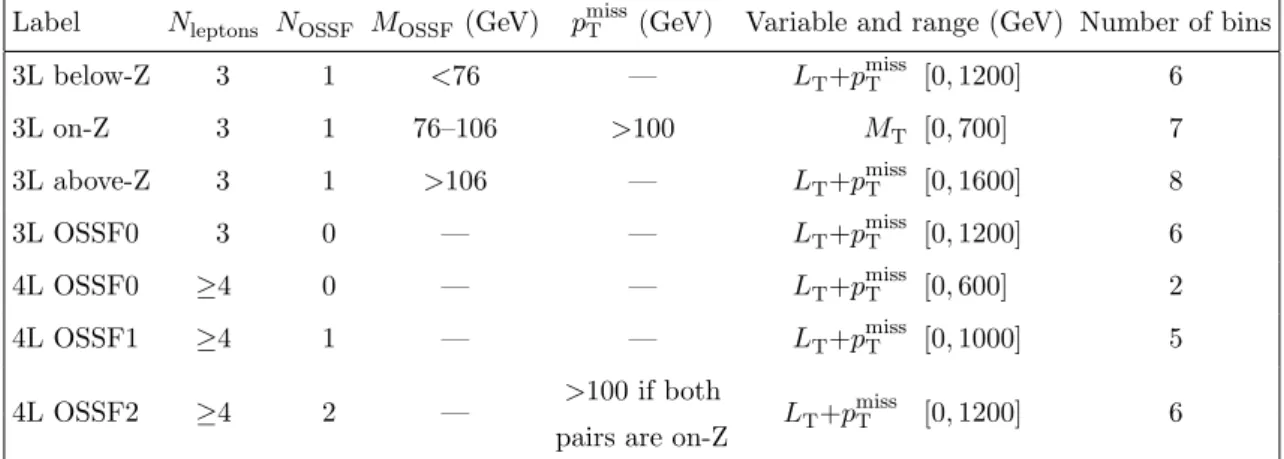
We classify the selected multilepton events into statistically independent search
chan-nels using the multiplicity of leptons, Nleptons, as well as the multiplicity and mass of
distinct OSSF pairs, NOSSF and MOSSF, respectively. In cases of ambiguity, MOSSF is
calculated using the OSSF pair with the mass closest to that of the Z boson, considering both electrons and muons. The 3L events with an OSSF lepton pair are labeled as OSSF1, whereas those without are labeled as OSSF0. The OSSF1 events are further classified as
JHEP03(2020)051
Label Nleptons NOSSF MOSSF(GeV) pmiss
T (GeV) Variable and range (GeV) Number of bins
3L below-Z 3 1 <76 — LT+p miss T [0, 1200] 6 3L on-Z 3 1 76–106 >100 MT [0, 700] 7 3L above-Z 3 1 >106 — LT+p miss T [0, 1600] 8 3L OSSF0 3 0 — — LT+p miss T [0, 1200] 6 4L OSSF0 ≥4 0 — — LT+p miss T [0, 600] 2 4L OSSF1 ≥4 1 — — LT+p miss T [0, 1000] 5 4L OSSF2 ≥4 2 — >100 if both LT+p miss T [0, 1200] 6
pairs are on-Z
Table 1. Multilepton signal region definitions for the type-III seesaw signal model. All events containing a same-flavor lepton pair with invariant mass below 12 GeV are removed in the 3L and 4L event categories. Furthermore, 3L events containing an OSSF lepton pair with mass below 76 GeV when the trilepton mass is within a Z boson mass window (91 ± 15 GeV) are also rejected. The last LT+p
miss
T or MTbin in each signal region contains the overflow events.
on-Z, below-Z, and above-Z, based on the MOSSF relative to the ±15 GeV window around
the Z boson mass, where the latter two categories are also collectively labeled as off-Z. Sim-ilarly, the 4L events are classified as those with zero, one, and two distinct OSSF lepton pairs, OSSF0, OSSF1, and OSSF2, respectively.
In the 3L on-Z search region, the sensitivity is increased by considering the
trans-verse mass discriminant MT=p2pmissT p`T[1 − cos(∆φ~pmiss
T ,~p
`
T)] instead of LT+p
miss
T , where
` refers to the lepton that is not part of the on-Z pair. We reject 3L on-Z events with
pmissT < 100 GeV, and 4L OSSF2 events with pmissT < 100 GeV and two distinct OSSF
lepton pairs on-Z, as these are used in the estimation of SM backgrounds.
This event selection and binning scheme yields a total of 40 statistically independent
search bins for the type-III seesaw model, as summarized in table 1.
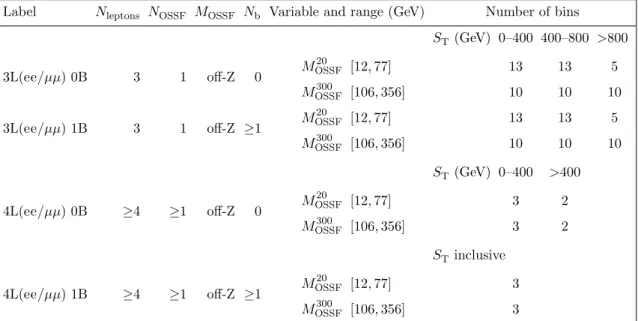
In contrast, the ttφ model yields events with a resonant OSSF lepton pair originating from the φ decays produced in association with a tt pair. We consider only 3L or 4L
events with at least one OSSF lepton pair and exclude those with MOSSF on-Z. This event
selection requires semileptonic or dileptonic tt decays in the ttφ signal. Unlike the type-III seesaw heavy fermions, relatively light scalar or pseudoscalar decays do not necessarily produce energetic charged leptons, but can yield striking resonant dilepton signatures in events with high hadronic activity and b tagged jets. Therefore, we seek events with
resonances in the OSSF dilepton mass spectra in various ST bins, where ST is defined as
the scalar pT sum of all jets, all charged leptons (LT) and pmissT .
We probe the ttφ signal in light and heavy φ mass ranges, namely 15–75 and 108– 340 GeV. Signal masses below 15 GeV and in the range of 75–108 GeV are not considered because of background from low-mass quarkonia and Z boson resonances, respectively. Masses above 340 GeV are not considered as the φ → tt decay channel becomes kinemati-cally accessible here.
JHEP03(2020)051
To account for the effects of radiation and resolution on the invariant mass recon-struction, we consider the 12–77 GeV (low) and 106–356 GeV (high) reconstructed dilepton mass ranges for the light and heavy signal mass scenarios, respectively, in both 3L and 4L channels. Because there can be an ambiguity caused by additional leptons originating from the tt system, the reconstruction of the correct φ mass is not always possible. Therefore,
we define the MOSSF20 and the MOSSF300 variables as the OSSF lepton pair masses of a given
lepton flavor closest to the targeted mass of 20 and 300 GeV, respectively. The MOSSF20
variable is used for the low dilepton mass range, while the MOSSF300 variable is used for the
high dilepton mass range. Events with a value of MOSSF20 (MOSSF300 ) outside the low (high)
dilepton mass ranges are not considered. The analysis is insensitive to the choice of the targeted mass value, and this simplified scheme allows multiple ttφ signal scenarios to be probed with a single mass spectrum.
The MOSSF20 and MOSSF300 masses are calculated separately for each lepton flavor scenario,
yielding two nonorthogonal categories labeled as 3/4L(ee) and 3/4L(µµ). Hence, a given event can qualify for both the low and high dilepton mass regions, as well as for both lepton
flavor channels. For example, a µ±µ±µ∓event could be present in both low and high
dilep-ton mass regions in the 3L(µµ) category, and similarly, an e±e∓µ±µ∓ event could qualify
for both the 4L(ee) and 4L(µµ) categories. However, for any one given ttφ signal mass and flavor scenario, only one of the dilepton mass ranges of a single flavor category is considered. Events that satisfy the low or high dilepton mass ranges are considered in orthogonal
Nb = 0 (0B) and Nb ≥ 1 (1B) selections, where Nb is the multiplicity of b tagged jets
in an event. Events in the 3L signal channels are further split into 3 ST bins (0–400 GeV,
400–800 GeV, and ≥800 GeV) for both Nb selections, those in the 4L signal channels are
split into 2 ST (0–400 GeV and ≥400 GeV) bins for the 0B selection, and only one inclusive
bin in ST is used for the 1B selection.
This event selection and binning scheme results in a total of 70 (68) statistically inde-pendent low (high) dilepton mass search bins in each of the 3/4L(ee) and 3/4L(µµ) channels
for the ttφ signal model, as summarized in table 2. The signal mass hypotheses that are
closer to the mass bin boundaries than to the bin centers are probed with a modified binning scheme, where the mass bin boundaries are shifted by half the value of the bin widths.
6 Background estimation and systematic uncertainties
The irreducible backgrounds are estimated using simulated event samples and are dom-inated by the WZ, ZZ, ttZ, and Zγ processes. The event yields of these processes are obtained from theoretical predictions, with normalization corrections derived in dedicated control regions as described below. These estimates for the WZ, ZZ and Zγ processes are largely independent of each other. Since these backgrounds make significant contributions to the ttZ-enriched control region, the normalization correction for this process is measured after the corresponding corrections have been obtained for the other backgrounds. The nor-malization correction factors and their associated uncertainties, which include both statisti-cal and systematic contributions, take the contamination of events from other processes into account and are applied to the corresponding background estimates in the signal regions.
JHEP03(2020)051
Label Nleptons NOSSF MOSSF Nb Variable and range (GeV) Number of bins
ST(GeV) 0–400 400–800 >800 3L(ee/µµ) 0B 3 1 off-Z 0 M 20 OSSF [12, 77] 13 13 5 MOSSF300 [106, 356] 10 10 10 3L(ee/µµ) 1B 3 1 off-Z ≥1 M 20 OSSF [12, 77] 13 13 5 MOSSF300 [106, 356] 10 10 10 ST(GeV) 0–400 >400 4L(ee/µµ) 0B ≥4 ≥1 off-Z 0 M 20 OSSF [12, 77] 3 2 MOSSF300 [106, 356] 3 2 STinclusive 4L(ee/µµ) 1B ≥4 ≥1 off-Z ≥1 M 20 OSSF [12, 77] 3 MOSSF300 [106, 356] 3
Table 2. Multilepton signal region definitions for the tt φ signal model. All events containing a same-flavor lepton pair with invariant mass below 12 GeV are removed in the 3L and 4L event categories. Furthermore, 3L events containing an OSSF lepton pair with mass below 76 GeV when the trilepton mass is within a Z boson mass window (91 ± 15 GeV) are also rejected.
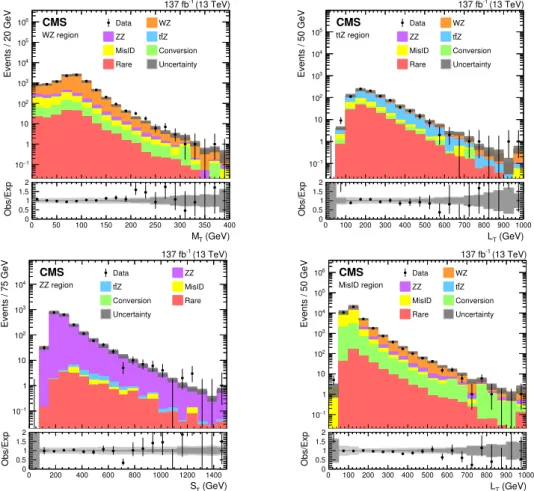
For the WZ and ttZ processes, we select events with exactly three leptons with an
on-Z OSSF pair, and the minimum lepton pT is required to be above 20 GeV to increase
the purity of these selections in the targeted process. For the WZ-enriched selection, we
require 50 < pmissT < 100 GeV and zero b tagged jets, whereas for the ttZ-enriched selection
we require pmissT < 100 GeV, ST > 350 GeV, and at least one b tagged jet. Similarly, for
ZZ, we select events with exactly four leptons, pmissT < 100 GeV, and two distinct on-Z
OSSF lepton pairs. In the WZ- and ZZ-enriched selections, the simulated event yields are normalized to match those in the data in the 0–3 and 0–2 jet multiplicity bins including overflows, respectively, yielding normalization factor uncertainties in the range of 5–25%, whereas an inclusive normalization is performed in the ttZ-enriched selection, resulting in a 20% uncertainty. The various kinematic distributions in the WZ-, ZZ-, and ttZ-enriched control regions, where the normalizations of these major irreducible backgrounds
are performed, are illustrated in figure2 (top-left, top-right, bottom-left).
Similarly, a Zγ-enriched selection is created in three-lepton events with an OSSF lepton pair with mass below 76 GeV and trilepton mass within the Z boson mass window, 91 ± 15 GeV. This selection is dominated by Z+jets events with internal and external photon conversions originating from final-state radiation, and the normalization yields a relative uncertainty of 20%. Conversion contributions from non-Zγ processes play a subdominant role, and are estimated using simulated event samples.
Other irreducible backgrounds, such as ttW, triboson, and Higgs boson processes, are estimated via simulation as well, using the cross sections obtained from the MC generation at NLO or higher accuracy, and are collectively referred to as ‘rare’ backgrounds. All rare and non-Zγ conversion backgrounds, which are not normalized to data in dedicated control regions, are assigned a relative normalization uncertainty of 50%.
JHEP03(2020)051
0 50 100 150 200 250 300 350 400 1 − 10 1 10 2 10 3 10 4 10 5 10 6 10 Events / 20 GeV Data WZ ZZ ttZ MisID Conversion Rare Uncertainty CMS (13 TeV) -1 137 fb WZ region 0 50 100 150 200 250 300 350 400 (GeV) T M 0 0.5 1 1.5 2 Obs/Exp 0 100 200 300 400 500 600 700 800 900 1000 1 − 10 1 10 2 10 3 10 4 10 5 10 Events / 50 GeV Data WZ ZZ ttZ MisID Conversion Rare Uncertainty CMS (13 TeV) -1 137 fb ttZ region 0 100 200 300 400 500 600 700 800 900 1000 (GeV) T L 0 0.5 1 1.5 2 Obs/Exp 0 200 400 600 800 1000 1200 1400 1 − 10 1 10 2 10 3 10 4 10 Events / 75 GeV Data ZZ Z t t MisID Conversion Rare Uncertainty CMS (13 TeV) -1 137 fb ZZ region 0 200 400 600 800 1000 1200 1400 (GeV) T S 0 0.5 1 1.5 2 Obs/Exp 0 100 200 300 400 500 600 700 800 900 1000 1 − 10 1 10 2 10 3 10 4 10 5 10 6 10 Events / 50 GeV Data WZ ZZ ttZ MisID Conversion Rare Uncertainty CMS (13 TeV) -1 137 fb MisID region 0 100 200 300 400 500 600 700 800 900 1000 (GeV) T L 0 0.5 1 1.5 2 Obs/ExpFigure 2. The MTdistribution in the WZ-enriched control region (upper left), the LTdistribution
in the tt Z-enriched control region (upper right), the ST distribution in the ZZ-enriched control
region (lower left), and the LT distribution in the misidentified-lepton (Z+jets) enriched control
region (lower right). The lower panels show the ratio of observed to expected events. The hatched gray bands in the upper panels and the light gray bands in the lower panels represent the total (systematic and statistical) uncertainty of the backgrounds in each bin, whereas the dark gray bands in the lower panels represent only the statistical uncertainty of the backgrounds. The rightmost bins contain the overflow events in each distribution.
A small fraction of the irreducible backgrounds are due to misidentification of the charge of one or more prompt electrons. These backgrounds are also estimated using simulated event samples. Following a study of same-sign dielectron events, in which the dielectron invariant mass is within a Z boson mass window (91 ± 15 GeV), a relative un-certainty of 50% is assigned to such contributions. These constitute less than 35% of the irreducible WZ, ZZ, and ttZ background contributions in the 3L OSSF0, 4L OSSF1, and 4L OSSF0 signal regions, and are negligible in all other signal regions.
A category of systematic uncertainties in the simulated events is due to the correc-tions applied to background and signal simulation samples to account for differences with respect to data events. These corrections are used in lepton reconstruction, identification, isolation, and trigger efficiencies, b tagging efficiencies, pileup modeling, as well as electron
JHEP03(2020)051
and muon resolution, and electron, muon, jet, and unclustered energy scale measurements. The uncertainties due to such corrections typically correspond to a 1–10% variation of the simulation-based irreducible background and signal yields across all signal regions. There-fore, they form a sub-dominant category of systematic uncertainties in the simulation-based background estimation. Similarly, uncertainties due to choices of factorization and
renor-malization scales [56] and PDFs [39] are also evaluated for signal and dominant irreducible
background processes, yielding <10% variation in signal regions. The uncertainties in the
integrated luminosity are in the range of 2.3–2.5% in each year of data collection [57–59].
The reducible backgrounds are due to misidentified leptons (MisID) arising from events such as Z+jets and tt+jets. These are estimated using a three-dimensional
implementa-tion of a matrix method [60], in which the rates at which prompt and misidentified leptons
satisfying a loose lepton selection also pass a tight lepton selection are measured in dedi-cated signal-depleted selections of events in data. The misidentification rates are measured
in Z+jets and tt+jets enriched trilepton (on-Z, pmissT < 50 GeV) and same-sign dilepton
(off-Z, pmissT > 50 GeV, and with at least 3 jets) selections, respectively, whereas an on-Z
dilepton selection is used for the prompt rates. The rates are parametrized as a function of lepton kinematic distributions and the multiplicity of tracks in the event. A weighted average of these misidentification rates is used in the analysis, reflecting the approximate expected composition of the SM backgrounds in a given search region as obtained from sim-ulated event samples. The final uncertainty in the estimated background from misidentified leptons is obtained by varying the rates within the uncertainties as well as the differences
in rates in Z+jets and tt+jets events, and has a relative uncertainty of 30–40%. Figure 2
(lower right) illustrates the misidentified-lepton background estimate as a function of LTin
the trilepton selection used to measure the rates, where a misidentified lepton is produced in association with a Z boson.
A summary of the uncertainty sources in this analysis, including the typical resultant variations on relevant background and signal processes, as well as the correlation model
across the three different data taking periods, is given in table 3. The quoted variations
on affected processes, except those in the integrated luminosity, and the inclusive normal-izations of the ttZ, conversion and rare simulations, are calculated taking into account variations of the uncertainty sources as a function of object and event dependent parame-ters as appropriate, such as lepton momenta, or jet multiplicity. Thus, these uncertainties also include bin-to-bin correlations across the search regions. The overall uncertainties in the total expected backgrounds are largely dominated by those in the irreducible WZ, ZZ, and ttZ processes, as well as the misidentified-lepton contributions, whereas the relatively large uncertainties in rare and conversion contributions and those due to electron charge misidentification are subdominant and have a negligible effect on the results across different signal regions.
7 Results
The distributions of expected SM backgrounds and observed event yields in the signal
regions as defined in tables 1 and 2 are given in figures 3–4 and 5–10 for the type-III
JHEP03(2020)051
Uncertainty source Signal/Background process Variation (%) Correlation
Integrated Luminosity Signal/Rare/Non-Zγ conversion 2.3–2.5 No
Lepton reconstruction, identification,
Signal/Background? 4–5 No
and isolation efficiency
Lepton displacement efficiency (only in 3L) Signal/Background? 3–5 Yes
Trigger efficiency Signal/Background? <3 No
b tagging efficiency Signal/Background? <5 No
Pileup modeling Signal/Background? <3 Yes
Factorization/renormalization scales & PDF Signal/Background? <10 Yes
Jet energy scale Signal/Background? <5 Yes
Unclustered energy scale Signal/Background? <5 Yes
Muon energy scale and resolution Signal/Background? <5 Yes
Electron energy scale and resolution Signal/Background? <2 Yes
WZ normalization (0/1/2/≥3 jets) WZ 5–10 Yes
ZZ normalization (0/1/≥2 jets) ZZ 5–10 Yes
ttZ normalization ttZ 15–20 Yes
Conversion normalization Conversion 20–50 Yes
Rare normalization Rare 50 Yes
Lepton misidentification rates Misidentified lepton 30–40 Yes
Electron charge misidentification WZ/ZZ† <20 No
?WZ, ZZ, ttZ, rare, and conversion background processes.
†
Only in 3L OSSF0, 4L OSSF0, and 4L OSSF1 signal regions.
Table 3. Sources of systematic uncertainties, affected background and signal processes, relative variations of the affected processes, and presence or otherwise of correlation between years in signal regions.
for type-III seesaw models with Σ masses of 300 and 700 GeV in the flavor-democratic scenario as well as for ttφ models with a pseudoscalar (scalar) φ mass of 20 and 125 (70
and 300) GeV assuming g2tB(φ → ee/µµ) = 0.05.
We perform a goodness-of-fit test based on the saturated model method [61] to
quan-tify the local deviations between the background-only hypothesis and the observed data,
without considering the look-elsewhere effect [62]. The most significant local deviation
from the SM expectation in the signal regions is found in the 3L(µµ) 1B ST < 400 GeV
high mass ttφ channel (figure 9) by selecting the bins with MOSSF300 > 206 GeV, resulting
in a data excess of approximately 3.2 standard deviations. Similarly, by examining other deviations from the SM, we observe a local data deficit of 2.5 standard deviations in the
10 < MOSSF20 < 15 GeV bin of the 3L(ee) 0B 400 < ST < 800 GeV channel (figure 5), and a
local data excess of 2.5 standard deviations in the 60 < MOSSF20 < 65 GeV bin of the 3L(µµ)
1B 400 < ST < 800 GeV channel (figure 9). Other deviations are less significant.
Over-all, the observations are found to be globally consistent with the SM predictions within 2.7 standard deviations, and no statistically significant excess compatible with the signal models probed is observed.
JHEP03(2020)051
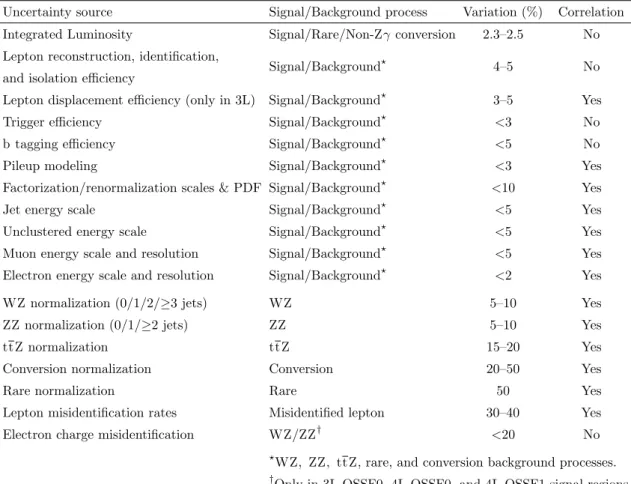
0 200 400 600 800 1000 1200 1 − 10 1 10 2 10 3 10 4 10 5 10 6 10 Events / 200 GeV Data WZ ZZ MisID Conversion ttZ Rare Σ(300) (700) Σ Uncertainty CMS (13 TeV) -1 137 fb 3L Below-Z 0 200 400 600 800 1000 1200 (GeV) T miss p + T L 0 0.5 1 1.5 2 Obs/Exp 0 100 200 300 400 500 600 700 1 − 10 1 10 2 10 3 10 4 10 5 10 6 10 Events / 100 GeV Data WZ ZZ MisID Conversion ttZ Rare Σ(300) (700) Σ Uncertainty CMS (13 TeV) -1 137 fb 3L On-Z 0 100 200 300 400 500 600 700 (GeV) T M 0 0.5 1 1.5 2 Obs/Exp 0 200 400 600 800 1000 1200 1400 1600 1 − 10 1 10 2 10 3 10 4 10 5 10 6 10 Events / 200 GeV Data WZ ZZ MisID Conversion ttZ Rare Σ(300) (700) Σ Uncertainty CMS (13 TeV) -1 137 fb 3L Above-Z 0 200 400 600 800 1000 1200 1400 1600 (GeV) T miss p + T L 0 0.5 1 1.5 2 Obs/Exp 0 200 400 600 800 1000 1200 1 − 10 1 10 2 10 3 10 4 10 5 10 6 10 Events / 200 GeV Data WZ ZZ MisID Conversion ttZ Rare Σ(300) (700) Σ Uncertainty CMS (13 TeV) -1 137 fb 3L OSSF0 0 200 400 600 800 1000 1200 (GeV) T miss p + T L 0 0.5 1 1.5 2 Obs/ExpFigure 3. Type-III seesaw signal regions in 3L below-Z (upper left), on-Z (upper right), above-Z (lower left), and OSSF0 (lower right) events. The total SM background is shown as a stacked histogram of all contributing processes. The predictions for type-III seesaw models with Σ masses of 300 and 700 GeV in the flavor-democratic scenario are also shown. The lower panels show the ratio of observed to expected events. The hatched gray bands in the upper panels and the light gray bands in the lower panels represent the total (systematic and statistical) uncertainty of the backgrounds in each bin, whereas the dark gray bands in the lower panels represent only the statistical uncertainty of the backgrounds. The rightmost bins contain the overflow events in each distribution.
Upper limits at 95% confidence level (CL) are set on the product of the signal produc-tion cross secproduc-tions and branching fracproduc-tions using a modified frequentist approach with the
CLscriterion [63,64] and the asymptotic approximation for the test statistic [65,66]. Upper
limits at 95% CL are also set on the product of the branching fractions and the square of the scalar or pseudoscalar Yukawa coupling in the ttφ model. A binned maximum-likelihood fit is performed to discriminate between the potential signal and the SM background
pro-cesses for both signal models separately. All of the LT+pmissT and MT bins are used for
the seesaw signal masses under consideration, whereas the appropriate subset of the lepton flavor and dilepton mass bins is used for a given φ mass and branching fraction scenario in the ttφ signal model, such that the low (high) dielectron and dimuon mass spectra are considered for a light (heavy) ttφ signal with the φ → ee and φ → µµ decays, respectively.
JHEP03(2020)051
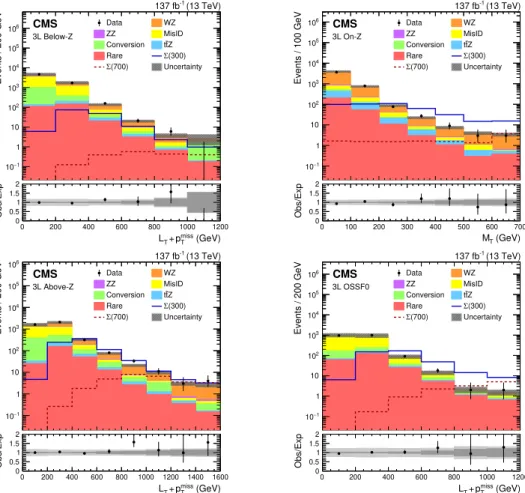
0 100 200 300 400 500 600 1 − 10 1 10 2 10 3 10 4 10 Events / 300 GeV Data ZZ MisID Conversion Z t t Rare (300) Σ Σ(700) Uncertainty CMS (13 TeV) -1 137 fb 4L OSSF0 0 100 200 300 400 500 600 (GeV) T miss p + T L 0 0.5 1 1.5 2 Obs/Exp 0 100 200 300 400 500 600 700 800 900 1000 1 − 10 1 10 2 10 3 10 4 10 5 10 Events / 200 GeV Data ZZ MisID Conversion Z t t Rare (300) Σ Σ(700) Uncertainty CMS (13 TeV) -1 137 fb 4L OSSF1 0 100 200 300 400 500 600 700 800 900 1000 (GeV) T miss p + T L 0 0.5 1 1.5 2 Obs/Exp 0 200 400 600 800 1000 1200 1 − 10 1 10 2 10 3 10 4 10 5 10 6 10 Events / 200 GeV Data ZZ MisID Conversion Z t t Rare (300) Σ Σ(700) Uncertainty CMS (13 TeV) -1 137 fb 4L OSSF2 0 200 400 600 800 1000 1200 (GeV) T miss p + T L 0 0.5 1 1.5 2 Obs/ExpFigure 4. Type-III seesaw signal regions in 4L OSSF0 (upper left), OSSF1 (upper right), and OSSF2 (lower) events. The total SM background is shown as a stacked histogram of all contributing processes. The predictions for type-III seesaw models with Σ masses of 300 and 700 GeV in the flavor-democratic scenario are also shown. The lower panels show the ratio of observed to expected events. The hatched gray bands in the upper panels and the light gray bands in the lower panels represent the total (systematic and statistical) uncertainty of the backgrounds in each bin, whereas the dark gray bands in the lower panels represent only the statistical uncertainty of the backgrounds. The rightmost bins contain the overflow events in each distribution.
The uncertainties in the mean values of both the expected signal and background yields are treated as nuisance parameters modeled by log-normal and gamma distributions for systematic and statistical uncertainties, respectively. Statistical uncertainties in the signal and background yields in each bin and year are assumed to be fully uncorrelated, whereas all systematic uncertainties are assumed to be fully correlated among the signal bins in a given year. The correlation model of all nuisance parameters across the datasets collected
in different years is summarized in table 3.
The observed and expected upper limits on the production cross section σ(ΣΣ) in the
type-III seesaw signal model are given in figure 11. Type-III seesaw heavy fermions are
excluded at 95% CL with masses below 880 GeV assuming the flavor-democratic scenario.
JHEP03(2020)051
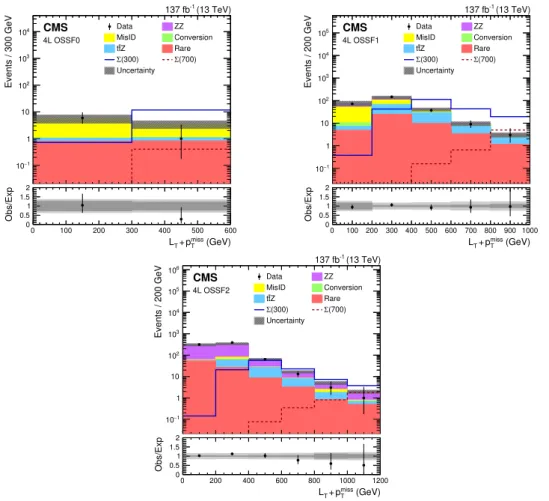
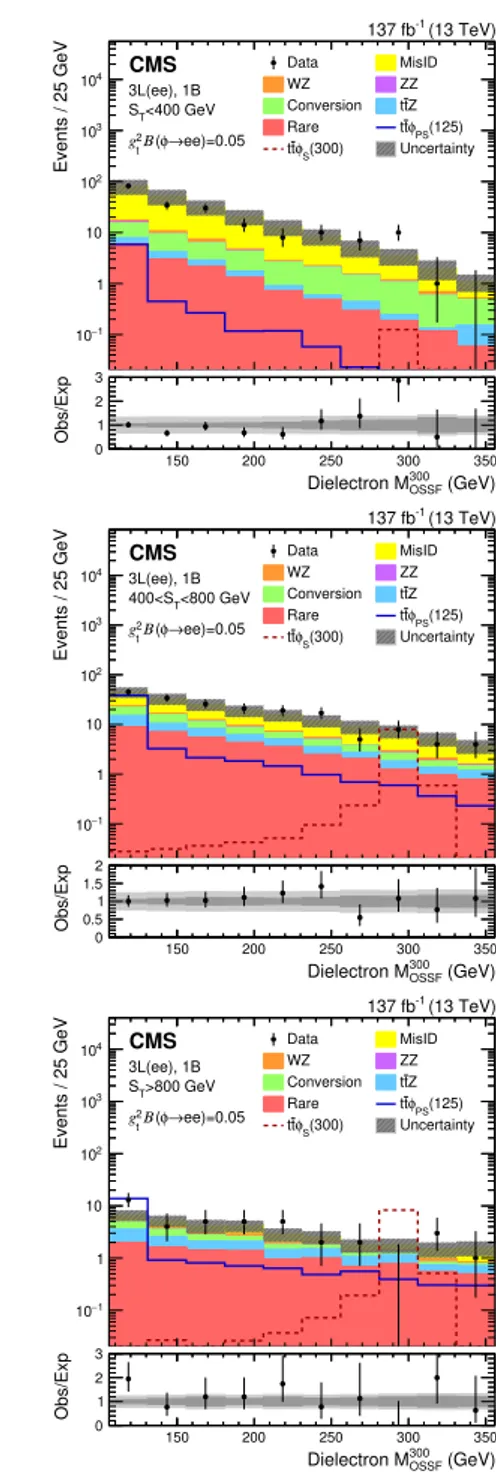
20 30 40 50 60 70 1 − 10 1 10 2 10 3 10 4 10 5 10 Events / 5 GeV Data MisID WZ ZZ Conversion ttZ Rare ttφPS(20) (70) S φ t t Uncertainty CMS (13 TeV) -1 137 fb ee)=0.05 → φ ( Β 2 t g <400 GeV T S 3L(ee), 0B 20 30 40 50 60 70 (GeV) 20 OSSF Dielectron M 0 0.5 1 1.5 2 Obs/Exp 150 200 250 300 350 1 − 10 1 10 2 10 3 10 4 10 5 10 Events / 25 GeV Data MisID WZ ZZ Conversion ttZ Rare ttφPS(125) (300) S φ t t Uncertainty CMS (13 TeV) -1 137 fb ee)=0.05 → φ ( Β 2 t g <400 GeV T S 3L(ee), 0B 150 200 250 300 350 (GeV) 300 OSSF Dielectron M 0 0.5 1 1.5 2 Obs/Exp 20 30 40 50 60 70 1 − 10 1 10 2 10 3 10 4 10 5 10 Events / 5 GeV Data MisID WZ ZZ Conversion ttZ Rare ttφPS(20) (70) S φ t t Uncertainty CMS (13 TeV) -1 137 fb ee)=0.05 → φ ( Β 2 t g <800 GeV T 400<S 3L(ee), 0B 20 30 40 50 60 70 (GeV) 20 OSSF Dielectron M 0 0.5 1 1.5 2 Obs/Exp 150 200 250 300 350 1 − 10 1 10 2 10 3 10 4 10 5 10 Events / 25 GeV Data MisID WZ ZZ Conversion ttZ Rare ttφPS(125) (300) S φ t t Uncertainty CMS (13 TeV) -1 137 fb ee)=0.05 → φ ( Β 2 t g <800 GeV T 400<S 3L(ee), 0B 150 200 250 300 350 (GeV) 300 OSSF Dielectron M 0 0.5 1 1.5 2 Obs/Exp 20 30 40 50 60 70 1 − 10 1 10 2 10 3 10 4 10 Events / 13 GeV Data MisID WZ ZZ Conversion ttZ Rare ttφPS(20) (70) S φ t t Uncertainty CMS (13 TeV) -1 137 fb ee)=0.05 → φ ( Β 2 t g >800 GeV T S 3L(ee), 0B 20 30 40 50 60 70 (GeV) 20 OSSF Dielectron M 0 0.5 1 1.5 2 Obs/Exp 150 200 250 300 350 1 − 10 1 10 2 10 3 10 4 10 Events / 25 GeV Data MisID WZ ZZ Conversion ttZ Rare ttφPS(125) (300) S φ t t Uncertainty CMS (13 TeV) -1 137 fb ee)=0.05 → φ ( Β 2 t g >800 GeV T S 3L(ee), 0B 150 200 250 300 350 (GeV) 300 OSSF Dielectron M 0 1 2 3 Obs/ExpFigure 5. Dielectron MOSSF20 (left column) and MOSSF300 (right column) distributions in the 3L(ee)
0B tt φ signal regions. Upper, center, and lower plots are for ST< 400 GeV, 400 < ST< 800 GeV,
and ST> 800 GeV, respectively. The total SM background is shown as a stacked histogram of all
contributing processes. The predictions for tt φ(→ ee) models with a pseudoscalar (scalar) φ of 20 and 125 (70 and 300) GeV mass assuming g2tB(φ → ee) = 0.05 are also shown. The lower panels
show the ratio of observed to expected events. The hatched gray bands in the upper panels and the light gray bands in the lower panels represent the total (systematic and statistical) uncertainty of the backgrounds in each bin, whereas the dark gray bands in the lower panels represent only the statistical uncertainty of the backgrounds. The rightmost bins do not contain the overflow events as these are outside the probed mass ranges.
JHEP03(2020)051
20 30 40 50 60 70 1 − 10 1 10 2 10 3 10 4 10 5 10 Events / 5 GeV Data MisID WZ ZZ Conversion ttZ Rare ttφPS(20) (70) S φ t t Uncertainty CMS (13 TeV) -1 137 fb ee)=0.05 → φ ( Β 2 t g <400 GeV T S 3L(ee), 1B 20 30 40 50 60 70 (GeV) 20 OSSF Dielectron M 0 0.5 1 1.5 2 Obs/Exp 150 200 250 300 350 1 − 10 1 10 2 10 3 10 4 10 Events / 25 GeV Data MisID WZ ZZ Conversion ttZ Rare ttφPS(125) (300) S φ t t Uncertainty CMS (13 TeV) -1 137 fb ee)=0.05 → φ ( Β 2 t g <400 GeV T S 3L(ee), 1B 150 200 250 300 350 (GeV) 300 OSSF Dielectron M 0 1 2 3 Obs/Exp 20 30 40 50 60 70 1 − 10 1 10 2 10 3 10 4 10 Events / 5 GeV Data MisID WZ ZZ Conversion ttZ Rare ttφPS(20) (70) S φ t t Uncertainty CMS (13 TeV) -1 137 fb ee)=0.05 → φ ( Β 2 t g <800 GeV T 400<S 3L(ee), 1B 20 30 40 50 60 70 (GeV) 20 OSSF Dielectron M 0 0.5 1 1.5 2 Obs/Exp 150 200 250 300 350 1 − 10 1 10 2 10 3 10 4 10 Events / 25 GeV Data MisID WZ ZZ Conversion ttZ Rare ttφPS(125) (300) S φ t t Uncertainty CMS (13 TeV) -1 137 fb ee)=0.05 → φ ( Β 2 t g <800 GeV T 400<S 3L(ee), 1B 150 200 250 300 350 (GeV) 300 OSSF Dielectron M 0 0.5 1 1.5 2 Obs/Exp 20 30 40 50 60 70 1 − 10 1 10 2 10 3 10 4 10 Events / 13 GeV Data MisID WZ ZZ Conversion ttZ Rare ttφPS(20) (70) S φ t t Uncertainty CMS (13 TeV) -1 137 fb ee)=0.05 → φ ( Β 2 t g >800 GeV T S 3L(ee), 1B 20 30 40 50 60 70 (GeV) 20 OSSF Dielectron M 0 0.5 1 1.5 2 Obs/Exp 150 200 250 300 350 1 − 10 1 10 2 10 3 10 4 10 Events / 25 GeV Data MisID WZ ZZ Conversion ttZ Rare ttφPS(125) (300) S φ t t Uncertainty CMS (13 TeV) -1 137 fb ee)=0.05 → φ ( Β 2 t g >800 GeV T S 3L(ee), 1B 150 200 250 300 350 (GeV) 300 OSSF Dielectron M 0 1 2 3 Obs/ExpFigure 6. Dielectron MOSSF20 (left column) and MOSSF300 (right column) distributions in the 3L(ee)
1B tt φ signal regions. Upper, center, and lower plots are for ST< 400 GeV, 400 < ST< 800 GeV,
and ST> 800 GeV, respectively. The total SM background is shown as a stacked histogram of all
contributing processes. The predictions for tt φ(→ ee) models with a pseudoscalar (scalar) φ of 20 and 125 (70 and 300) GeV mass assuming g2tB(φ → ee) = 0.05 are also shown. The lower panels
show the ratio of observed to expected events. The hatched gray bands in the upper panels and the light gray bands in the lower panels represent the total (systematic and statistical) uncertainty of the backgrounds in each bin, whereas the dark gray bands in the lower panels represent only the statistical uncertainty of the backgrounds. The rightmost bins do not contain the overflow events as these are outside the probed mass ranges.
JHEP03(2020)051
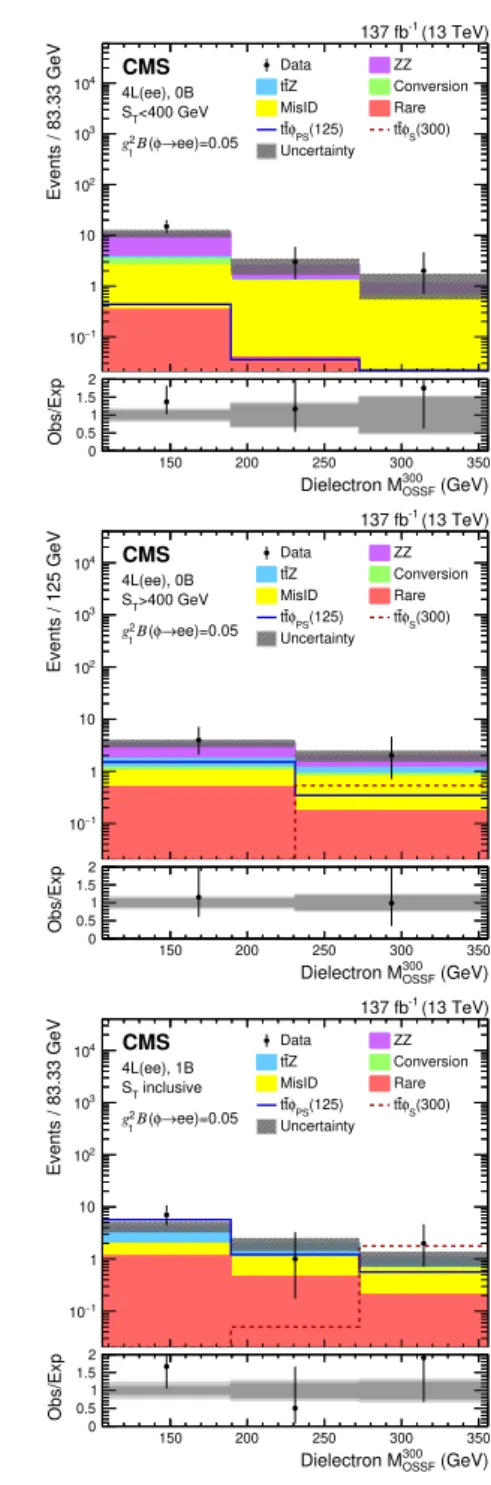
20 30 40 50 60 70 1 − 10 1 10 2 10 3 10 4 10 5 10 Events / 21.67 GeV Data ZZ Z t t Conversion MisID Rare (20) PS φ t t ttφS(70) Uncertainty CMS (13 TeV) -1 137 fb ee)=0.05 → φ ( Β 2 t g <400 GeV T S 4L(ee), 0B 20 30 40 50 60 70 (GeV) 20 OSSF Dielectron M 0 0.5 1 1.5 2 Obs/Exp 150 200 250 300 350 1 − 10 1 10 2 10 3 10 4 10 Events / 83.33 GeV Data ZZ Z t t Conversion MisID Rare (125) PS φ t t ttφS(300) Uncertainty CMS (13 TeV) -1 137 fb ee)=0.05 → φ ( Β 2 t g <400 GeV T S 4L(ee), 0B 150 200 250 300 350 (GeV) 300 OSSF Dielectron M 0 0.5 1 1.5 2 Obs/Exp 20 30 40 50 60 70 1 − 10 1 10 2 10 3 10 4 10 Events / 32.5 GeV Data ZZ Z t t Conversion MisID Rare (20) PS φ t t ttφS(70) Uncertainty CMS (13 TeV) -1 137 fb ee)=0.05 → φ ( Β 2 t g >400 GeV T S 4L(ee), 0B 20 30 40 50 60 70 (GeV) 20 OSSF Dielectron M 0 0.5 1 1.5 2 Obs/Exp 150 200 250 300 350 1 − 10 1 10 2 10 3 10 4 10 Events / 125 GeV Data ZZ Z t t Conversion MisID Rare (125) PS φ t t ttφS(300) Uncertainty CMS (13 TeV) -1 137 fb ee)=0.05 → φ ( Β 2 t g >400 GeV T S 4L(ee), 0B 150 200 250 300 350 (GeV) 300 OSSF Dielectron M 0 0.5 1 1.5 2 Obs/Exp 20 30 40 50 60 70 1 − 10 1 10 2 10 3 10 4 10 Events / 21.67 GeV Data ZZ Z t t Conversion MisID Rare (20) PS φ t t ttφS(70) Uncertainty CMS (13 TeV) -1 137 fb ee)=0.05 → φ ( Β 2 t g inclusive T S 4L(ee), 1B 20 30 40 50 60 70 (GeV) 20 OSSF Dielectron M 0 0.5 1 1.5 2 Obs/Exp 150 200 250 300 350 1 − 10 1 10 2 10 3 10 4 10 Events / 83.33 GeV Data ZZ Z t t Conversion MisID Rare (125) PS φ t t ttφS(300) Uncertainty CMS (13 TeV) -1 137 fb ee)=0.05 → φ ( Β 2 t g inclusive T S 4L(ee), 1B 150 200 250 300 350 (GeV) 300 OSSF Dielectron M 0 0.5 1 1.5 2 Obs/ExpFigure 7. Dielectron MOSSF20 (left column) and MOSSF300 (right column) distributions in the 4L(ee)
tt φ signal regions. Upper, center, and lower plots are for 0B ST < 400 GeV, 0B ST > 400 GeV,
and 1B ST-inclusive, respectively. The total SM background is shown as a stacked histogram of all
contributing processes. The predictions for tt φ(→ ee) models with a pseudoscalar (scalar) φ of 20 and 125 (70 and 300) GeV mass assuming g2tB(φ → ee) = 0.05 are also shown. The lower panels
show the ratio of observed to expected events. The hatched gray bands in the upper panels and the light gray bands in the lower panels represent the total (systematic and statistical) uncertainty of the backgrounds in each bin, whereas the dark gray bands in the lower panels represent only the statistical uncertainty of the backgrounds. The rightmost bins do not contain the overflow events as these are outside the probed mass range.
JHEP03(2020)051
20 30 40 50 60 70 1 − 10 1 10 2 10 3 10 4 10 5 10 6 10 Events / 5 GeV Data MisID WZ ZZ Conversion ttZ Rare ttφPS(20) (70) S φ t t Uncertainty CMS (13 TeV) -1 137 fb )=0.05 µ µ → φ ( Β 2 t g <400 GeV T S ), 0B µ µ 3L( 20 30 40 50 60 70 (GeV) 20 OSSF Dimuon M 0 0.5 1 1.5 2 Obs/Exp 150 200 250 300 350 1 − 10 1 10 2 10 3 10 4 10 5 10 Events / 25 GeV Data MisID WZ ZZ Conversion ttZ Rare ttφPS(125) (300) S φ t t Uncertainty CMS (13 TeV) -1 137 fb )=0.05 µ µ → φ ( Β 2 t g <400 GeV T S ), 0B µ µ 3L( 150 200 250 300 350 (GeV) 300 OSSF Dimuon M 0 0.5 1 1.5 2 Obs/Exp 20 30 40 50 60 70 1 − 10 1 10 2 10 3 10 4 10 5 10 Events / 5 GeV Data MisID WZ ZZ Conversion ttZ Rare ttφPS(20) (70) S φ t t Uncertainty CMS (13 TeV) -1 137 fb )=0.05 µ µ → φ ( Β 2 t g <800 GeV T 400<S ), 0B µ µ 3L( 20 30 40 50 60 70 (GeV) 20 OSSF Dimuon M 0 0.5 1 1.5 2 Obs/Exp 150 200 250 300 350 1 − 10 1 10 2 10 3 10 4 10 5 10 Events / 25 GeV Data MisID WZ ZZ Conversion ttZ Rare ttφPS(125) (300) S φ t t Uncertainty CMS (13 TeV) -1 137 fb )=0.05 µ µ → φ ( Β 2 t g <800 GeV T 400<S ), 0B µ µ 3L( 150 200 250 300 350 (GeV) 300 OSSF Dimuon M 0 0.5 1 1.5 2 Obs/Exp 20 30 40 50 60 70 1 − 10 1 10 2 10 3 10 4 10 Events / 13 GeV Data MisID WZ ZZ Conversion ttZ Rare ttφPS(20) (70) S φ t t Uncertainty CMS (13 TeV) -1 137 fb )=0.05 µ µ → φ ( Β 2 t g >800 GeV T S ), 0B µ µ 3L( 20 30 40 50 60 70 (GeV) 20 OSSF Dimuon M 0 0.5 1 1.5 2 Obs/Exp 150 200 250 300 350 1 − 10 1 10 2 10 3 10 4 10 Events / 25 GeV Data MisID WZ ZZ Conversion ttZ Rare ttφPS(125) (300) S φ t t Uncertainty CMS (13 TeV) -1 137 fb )=0.05 µ µ → φ ( Β 2 t g >800 GeV T S ), 0B µ µ 3L( 150 200 250 300 350 (GeV) 300 OSSF Dimuon M 0 0.5 1 1.5 2 Obs/ExpFigure 8. Dimuon MOSSF20 (left column) and MOSSF300 (right column) distributions in the 3L(µµ)
0B tt φ signal regions. Upper, center, and lower plots are for ST< 400 GeV, 400 < ST< 800 GeV,
and ST> 800 GeV, respectively. The total SM background is shown as a stacked histogram of all
contributing processes. The predictions for tt φ(→ µµ) models with a pseudoscalar (scalar) φ of 20 and 125 (70 and 300) GeV mass assuming g2tB(φ → µµ) = 0.05 are also shown. The lower panels
show the ratio of observed to expected events. The hatched gray bands in the upper panels and the light gray bands in the lower panels represent the total (systematic and statistical) uncertainty of the backgrounds in each bin, whereas the dark gray bands in the lower panels represent only the statistical uncertainty of the backgrounds. The rightmost bins do not contain the overflow events as these are outside the probed mass range.
JHEP03(2020)051
20 30 40 50 60 70 1 − 10 1 10 2 10 3 10 4 10 5 10 Events / 5 GeV Data MisID WZ ZZ Conversion ttZ Rare ttφPS(20) (70) S φ t t Uncertainty CMS (13 TeV) -1 137 fb )=0.05 µ µ → φ ( Β 2 t g <400 GeV T S ), 1B µ µ 3L( 20 30 40 50 60 70 (GeV) 20 OSSF Dimuon M 0 0.5 1 1.5 2 Obs/Exp 150 200 250 300 350 1 − 10 1 10 2 10 3 10 4 10 5 10 Events / 25 GeV Data MisID WZ ZZ Conversion ttZ Rare ttφPS(125) (300) S φ t t Uncertainty CMS (13 TeV) -1 137 fb )=0.05 µ µ → φ ( Β 2 t g <400 GeV T S ), 1B µ µ 3L( 150 200 250 300 350 (GeV) 300 OSSF Dimuon M 0 1 2 3 4 Obs/Exp 20 30 40 50 60 70 1 − 10 1 10 2 10 3 10 4 10 5 10 Events / 5 GeV Data MisID WZ ZZ Conversion ttZ Rare ttφPS(20) (70) S φ t t Uncertainty CMS (13 TeV) -1 137 fb )=0.05 µ µ → φ ( Β 2 t g <800 GeV T 400<S ), 1B µ µ 3L( 20 30 40 50 60 70 (GeV) 20 OSSF Dimuon M 0 1 2 3 4 Obs/Exp 150 200 250 300 350 1 − 10 1 10 2 10 3 10 4 10 Events / 25 GeV Data MisID WZ ZZ Conversion ttZ Rare ttφPS(125) (300) S φ t t Uncertainty CMS (13 TeV) -1 137 fb )=0.05 µ µ → φ ( Β 2 t g <800 GeV T 400<S ), 1B µ µ 3L( 150 200 250 300 350 (GeV) 300 OSSF Dimuon M 0 1 2 3 Obs/Exp 20 30 40 50 60 70 1 − 10 1 10 2 10 3 10 4 10 Events / 13 GeV Data MisID WZ ZZ Conversion ttZ Rare ttφPS(20) (70) S φ t t Uncertainty CMS (13 TeV) -1 137 fb )=0.05 µ µ → φ ( Β 2 t g >800 GeV T S ), 1B µ µ 3L( 20 30 40 50 60 70 (GeV) 20 OSSF Dimuon M 0 1 2 3 Obs/Exp 150 200 250 300 350 1 − 10 1 10 2 10 3 10 4 10 Events / 25 GeV Data MisID WZ ZZ Conversion ttZ Rare ttφPS(125) (300) S φ t t Uncertainty CMS (13 TeV) -1 137 fb )=0.05 µ µ → φ ( Β 2 t g >800 GeV T S ), 1B µ µ 3L( 150 200 250 300 350 (GeV) 300 OSSF Dimuon M 0 0.5 1 1.5 2 Obs/ExpFigure 9. Dimuon MOSSF20 (left column) and MOSSF300 (right column) distributions in the 3L(µµ)
1B tt φ signal regions. Upper, center, and lower plots are for ST< 400 GeV, 400 < ST< 800 GeV,
and ST> 800 GeV, respectively. The total SM background is shown as a stacked histogram of all
contributing processes. The predictions for tt φ(→ µµ) models with a pseudoscalar (scalar) φ of 20 and 125 (70 and 300) GeV mass assuming g2tB(φ → µµ) = 0.05 are also shown. The lower panels
show the ratio of observed to expected events. The hatched gray bands in the upper panels and the light gray bands in the lower panels represent the total (systematic and statistical) uncertainty of the backgrounds in each bin, whereas the dark gray bands in the lower panels represent only the statistical uncertainty of the backgrounds. The rightmost bins do not contain the overflow events as these are outside the probed mass range.
JHEP03(2020)051
20 30 40 50 60 70 1 − 10 1 10 2 10 3 10 4 10 5 10 Events / 21.67 GeV Data ZZ Z t t Conversion MisID Rare (20) PS φ t t ttφS(70) Uncertainty CMS (13 TeV) -1 137 fb )=0.05 µ µ → φ ( Β 2 t g <400 GeV T S ), 0B µ µ 4L( 20 30 40 50 60 70 (GeV) 20 OSSF Dimuon M 0 0.5 1 1.5 2 Obs/Exp 150 200 250 300 350 1 − 10 1 10 2 10 3 10 4 10 Events / 83.33 GeV Data ZZ Z t t Conversion MisID Rare (125) PS φ t t ttφS(300) Uncertainty CMS (13 TeV) -1 137 fb )=0.05 µ µ → φ ( Β 2 t g <400 GeV T S ), 0B µ µ 4L( 150 200 250 300 350 (GeV) 300 OSSF Dimuon M 0 0.5 1 1.5 2 Obs/Exp 20 30 40 50 60 70 1 − 10 1 10 2 10 3 10 4 10 Events / 32.5 GeV Data ZZ Z t t Conversion MisID Rare (20) PS φ t t ttφS(70) Uncertainty CMS (13 TeV) -1 137 fb )=0.05 µ µ → φ ( Β 2 t g >400 GeV T S ), 0B µ µ 4L( 20 30 40 50 60 70 (GeV) 20 OSSF Dimuon M 0 0.5 1 1.5 2 Obs/Exp 150 200 250 300 350 1 − 10 1 10 2 10 3 10 4 10 Events / 125 GeV Data ZZ Z t t Conversion MisID Rare (125) PS φ t t ttφS(300) Uncertainty CMS (13 TeV) -1 137 fb )=0.05 µ µ → φ ( Β 2 t g >400 GeV T S ), 0B µ µ 4L( 150 200 250 300 350 (GeV) 300 OSSF Dimuon M 0 0.5 1 1.5 2 Obs/Exp 20 30 40 50 60 70 1 − 10 1 10 2 10 3 10 4 10 Events / 21.67 GeV Data ZZ Z t t Conversion MisID Rare (20) PS φ t t ttφS(70) Uncertainty CMS (13 TeV) -1 137 fb )=0.05 µ µ → φ ( Β 2 t g inclusive T S ), 1B µ µ 4L( 20 30 40 50 60 70 (GeV) 20 OSSF Dimuon M 0 0.5 1 1.5 2 Obs/Exp 150 200 250 300 350 1 − 10 1 10 2 10 3 10 4 10 Events / 83.33 GeV Data ZZ Z t t Conversion MisID Rare (125) PS φ t t ttφS(300) Uncertainty CMS (13 TeV) -1 137 fb )=0.05 µ µ → φ ( Β 2 t g inclusive T S ), 1B µ µ 4L( 150 200 250 300 350 (GeV) 300 OSSF Dimuon M 0 0.5 1 1.5 2 Obs/ExpFigure 10. Dimuon MOSSF20 (left column) and MOSSF300 (right column) distributions in the 4L(µµ)
tt φ signal regions. Upper, center, and lower plots are for 0B ST < 400 GeV, 0B ST > 400 GeV,
and 1B ST-inclusive, respectively. The total SM background is shown as a stacked histogram of all
contributing processes. The predictions for tt φ(→ µµ) models with a pseudoscalar (scalar) φ of 20 and 125 (70 and 300) GeV mass assuming g2tB(φ → µµ) = 0.05 are also shown. The lower panels
show the ratio of observed to expected events. The hatched gray bands in the upper panels and the light gray bands in the lower panels represent the total (systematic and statistical) uncertainty of the backgrounds in each bin, whereas the dark gray bands in the lower panels represent only the statistical uncertainty of the backgrounds. The rightmost bins do not contain the overflow events as these are outside the probed mass range.
JHEP03(2020)051
mass (GeV)
Σ
200 400 600 800 1000 1200 1400) (pb)
Σ
Σ(
σ
4 − 10 3 − 10 2 − 10 1 − 10 1 10 2 10 ) with unc. Σ Σ ( σ 95% CL upper limits Observed Median expected 68% expected 95% expected Type-III seesaw, flavor-democratic scenarioCMS
(13 TeV)
-1
137 fb
Figure 11. The 95% confidence level expected and observed upper limits on the total production cross section of heavy fermion pairs. The inner (green) and the outer (yellow) bands indicate the regions containing 68 and 95%, respectively, of the distribution of limits expected under the background-only hypothesis. Also shown are the theoretical prediction for the cross section and the associated uncertainty of the Σ pair production via the type-III seesaw mechanism. Type-III seesaw heavy fermions are excluded for masses below 880 GeV (expected limit 930 GeV) in the flavor-democratic scenario.
model are shown in figures 12 and 13, respectively. In the ttφ signal model, we exclude
cross sections above 1–20 fb for φ masses in the range of 15–75 GeV, and above 0.3–5 fb
for φ masses in the range of 108–340 GeV. Furthermore, gt2B(φ → ee/µµ) above (0.4–
4)×10-3 for the scalar and above (0.4–3)×10-2 for the pseudoscalar scenarios are excluded
for φ masses in the 15–75 GeV range, whereas the two models perform similarly for masses
108–340 GeV and are excluded above (0.4–4)×10-2 for the scalar and above (0.6–3)×10-2
for the pseudoscalar scenarios. Uncertainties in the production cross sections due to scale
and PDF choices are considered for both signal models [36,37,67], and are also shown in
figures 11 and 12.
The differences in the low-mass exclusion limits of scalar and pseudoscalar ttφ models result from the kinematic structure of the couplings, which affect both the production cross section and the signal efficiency of the φ bosons. The coupling of a scalar boson to a fermion is momentum independent, whereas that of a pseudoscalar boson is proportional to the momentum in the low momentum limit. Therefore, the low φ momentum part of the production cross section is suppressed in the pseudoscalar model in comparison to the scalar model for φ masses below the top quark mass scale, while both production cross sections are similar for φ masses at and above the top quark mass scale. Furthermore, this coupling structure results in more pseudoscalar φ bosons in the Lorentz-boosted region
JHEP03(2020)051
50 100 150 200 250 300 mass (GeV) φ 4 − 10 3 − 10 2 − 10 1 − 10 1 10 (pb) ee) → φ( Β ) φt (t σ ) with unc. φ t (t σ =0.05) ee) → φ ( Β 2 t g ( 95% CL upper limits Observed Median expected 68% expected 95% expected CMSZ boson mass region
(13 TeV) -1 137 fb φ ee), Scalar → ( φ t t 50 100 150 200 250 300 mass (GeV) φ 4 − 10 3 − 10 2 − 10 1 − 10 1 10 (pb) ee) → φ( Β ) φt (t σ ) with unc. φ t (t σ =0.05) ee) → φ ( Β 2 t g ( 95% CL upper limits Observed Median expected 68% expected 95% expected CMS
Z boson mass region
(13 TeV) -1 137 fb φ ee), Pseudoscalar → ( φ t t 50 100 150 200 250 300 mass (GeV) φ 4 − 10 3 − 10 2 − 10 1 − 10 1 10 (pb)) µ µ → φ( Β ) φt (t σ ) with unc. φ t (t σ =0.05) ) µ µ → φ ( Β 2 t g ( 95% CL upper limits Observed Median expected 68% expected 95% expected CMS
Z boson mass region
(13 TeV) -1 137 fb φ ), Scalar µ µ → ( φ t t 50 100 150 200 250 300 mass (GeV) φ 4 − 10 3 − 10 2 − 10 1 − 10 1 10 (pb)) µ µ → φ( Β ) φt (t σ ) with unc. φ t (t σ =0.05) ) µ µ → φ ( Β 2 t g ( 95% CL upper limits Observed Median expected 68% expected 95% expected CMS
Z boson mass region
(13 TeV) -1 137 fb φ ), Pseudoscalar µ µ → ( φ t t
Figure 12. The 95% confidence level expected and observed upper limits on the product of the signal production cross section and branching fraction of a scalar φ boson in the dielectron (upper left) and dimuon (lower left) channels, and of a pseudoscalar φ boson in the dielectron (upper right) and dimuon (lower right) channels, where φ is produced in association with a top quark pair. The inner (green) and the outer (yellow) bands indicate the regions containing 68 and 95%, respectively, of the distribution of limits expected under the background-only hypothesis. The vertical hatched gray band indicates the mass region corresponding to the Z boson veto. Also shown are the theoretical predictions for the product of the production cross section and branching fraction of the tt φ model, with their uncertainties, and assuming gt2B(φ → ee/µµ) = 0.05. All tt φ signal scenarios
are excluded for the product of the production cross section and branching fraction above 1–20 fb for φ masses in the range of 15–75 GeV, and above 0.3–5 fb for φ masses in the range of 108–340 GeV.
compared to the scalar φ bosons, yielding more energetic leptons with higher selection efficiencies. The product of the fiducial acceptance and the event selection efficiency for the type-III seesaw and the ttφ models for various signal mass hypotheses, calculated after
all analysis selection requirements, are given in table 4.
8 Summary
A search has been performed for physics beyond the standard model, using multilepton
JHEP03(2020)051
50 100 150 200 250 300 mass (GeV) φ 5 − 10 4 − 10 3 − 10 2 − 10 1 − 10 1 ee) → φ( Β 2 t g 95% CL upper limits Observed Median expected 68% expected 95% expected CMSZ boson mass region
(13 TeV) -1 137 fb φ ee), Scalar → ( φ t t 50 100 150 200 250 300 mass (GeV) φ 5 − 10 4 − 10 3 − 10 2 − 10 1 − 10 1 ee) → φ( Β 2 t g 95% CL upper limits Observed Median expected 68% expected 95% expected CMS
Z boson mass region
(13 TeV) -1 137 fb φ ee), Pseudoscalar → ( φ t t 50 100 150 200 250 300 mass (GeV) φ 5 − 10 4 − 10 3 − 10 2 − 10 1 − 10 1 ) µ µ → φ( Β 2 t g 95% CL upper limits Observed Median expected 68% expected 95% expected CMS
Z boson mass region
(13 TeV) -1 137 fb φ ), Scalar µ µ → ( φ t t 50 100 150 200 250 300 mass (GeV) φ 5 − 10 4 − 10 3 − 10 2 − 10 1 − 10 1 ) µ µ → φ( Β 2 t g 95% CL upper limits Observed Median expected 68% expected 95% expected CMS
Z boson mass region
(13 TeV) -1 137 fb φ ), Pseudoscalar µ µ → ( φ t t
Figure 13. The 95% confidence level expected and observed upper limits on the product of the square of the Yukawa coupling to top quarks and branching fraction of a scalar φ boson in the dielectron (upper left) and dimuon (lower left) channels, and of a pseudoscalar φ boson in the dielectron (upper right) and dimuon (lower right) channels, where φ is produced in association with a top quark pair. The inner (green) and the outer (yellow) bands indicate the regions containing 68 and 95%, respectively, of the distribution of limits expected under the background-only hypothesis. The vertical hatched gray band indicates the mass region corresponding to the Z boson veto. The dashed horizontal line marks the unity value of the product of the square of the Yukawa coupling to top quarks and the branching fraction. Assuming a Yukawa coupling of unit strength to top quarks, the branching fraction of new scalar (pseudoscalar) bosons to dielectrons or dimuons above 0.0004–0.004 (0.004–0.03) are excluded for masses in the range of 15–75 GeV, and above 0.004–0.04 (0.006–0.03) for masses in the range of 108–340 GeV.
in 2016–2018. The observations are found to be consistent with the expectations from standard model processes, with no statistically significant signal-like excess in any of the probed channels. The results are used to constrain the allowed parameter space of the tar-geted signal models. At 95% confidence level, heavy fermions of the type-III seesaw model with masses below 880 GeV are excluded assuming identical Σ decay branching fractions across all lepton flavors. This is the most restrictive limit on the flavor-democratic scenario of the type-III seesaw model to date. Assuming a Yukawa coupling of unit strength to top