Contents lists available atScienceDirect
Journal of Analytical and Applied Pyrolysis
journal homepage:www.elsevier.com/locate/jaapThermal conversion behaviors and products of spent mushroom substrate in
CO
2
and N
2
atmospheres: Kinetic, thermodynamic, TG and Py-GC/MS
analyses
Jianli Huang
a, Junhui Zhang
a, Jingyong Liu
a,⁎, Wuming Xie
a, Jiahong Kuo
a, Kenlin Chang
a,b,
Musa Buyukada
c, Fatih Evrendilek
d,e, Shuiyu Sun
aaGuangzhou Key Laboratory Environmental Catalysis and Pollution Control, Guangdong Key Laboratory of Environmental Catalysis and Health Risk Control, School of
Environmental Science and Engineering, Institute of Environmental Health and Pollution Control, Guangdong University of Technology, Guangzhou, 510006, China
bInstitute of Environmental Engineering, National Sun Yat-Sen University, Kaohsiung, 80424, Taiwan cDepartment of Chemical Engineering, Bolu Abant Izzet Baysal University, Bolu, 14052, Turkey dDepartment of Environmental Engineering, Bolu Abant Izzet Baysal University, Bolu, 14052, Turkey eDepartment of Environmental Engineering, Ardahan University, Ardahan, 75002, Turkey
A R T I C L E I N F O
Keywords:
Spent mushroom substrate Pyrolysis
Thermogravimetric analysis Py-GC/MS
Iso-conversional methods
A B S T R A C T
This study aims at characterizing pyrolysis/gasification behaviors and products of spent mushroom substrate (SMS) in the CO2and N2atmospheres. The major decomposition stages occurred between 200 and 600 °C with
the mass losses of 60.4 and 61.5% at 20 °C/min in the CO2and N2atmospheres, respectively. The maximum mass
loss rate grew with the increased heating rate, while DTG curves shifted toward a higher temperature. Volatiles were released easier in the N2than CO2atmosphere with a higher comprehensive devolatilization index and
decomposition rate. At above 750 °C, the char gasification in the CO2atmosphere resulted in a significant mass
loss as well as a less char yield. Average activation energies by the Flynn-Wall-Ozawa method were estimated at 212 and 214 kJ/mol in the CO2and N2atmospheres, respectively. The higher thermodynamic parameters in the
N2than CO2atmosphere indicated the higher reactivity of the pyrolysis in the N2atmosphere. The reaction
mechanisms of the volatiles decomposition were best described by g(α) = (1-α)−1-1 (R2 model) in the range of
200–370 °C in both atmospheres. The major pyrolysis products at 800 °C were identified using Py-GC/MS and composed mostly of aromatic compounds such as toluene and x-methyl-naphthalenes.
1. Introduction
The increased consumption rate of the limited fossil fuel reserves, and its association with global climate change render it necessary to seek alternative renewable energy sources and technologies [1,2]. Re-cently, this has brought the thermochemical conversions of agricultural and forestry wastes to the forefront owing to their CO2neutrality,
re-newability, rich labile substances, high calorific value, low ash content and waste reduction [3]. Globally, renewable resources and biomass wastes were reported to meet about 19% of the total annual energy consumption, with its share increasing at an annual rate of 2.5% [4]. Biomass wastes explored to generate energy using (co-)combustion and (co-)pyrolysis included pomelo peels [5], buckwheat and wheat straws [6], bagasse [7], and hard/softwoods [8].
The total amount of mushrooms produced in China accounts for 75% of the annual world production with five kilograms of spent
mushroom substrate (SMS) per each kilogram of mushroom produced [9]. The growing amount of SMS waste by the mushroom industry has generated a severe public health concern in China due to its volatiles content and traditional disposals such as landfills, and composts [10]. SMS also contains mycelia, wood chips, hydrocarbons, and residual nutrients [11], thus presenting a great opportunity as a solid biofuel to bridge the gap between the environmental and economic goals towards the sustainable development of the mushroom industries.
Among the thermochemical conversions, pyrolysis can be con-sidered to be one of the most environmentally and commonly used technique in the absence of oxygen owing to its reasonable cost, simple operation and value-added by-products such as bio-oils, and bio-chars [12,13]. The gasification of biomass using CO2is regarded as an
ef-fective way to substantially reduce CO2emission when compared to
fossil fuels [14]. Pyrolysis/gasification serves to use biomass waste as a renewable energy source, reduce their volume and remove pathogens.
https://doi.org/10.1016/j.jaap.2019.02.002
Received 16 October 2018; Received in revised form 20 December 2018; Accepted 3 February 2019
⁎Corresponding author.
E-mail addresses:[email protected],[email protected](J. Liu).
Available online 10 February 2019
0165-2370/ © 2019 Elsevier B.V. All rights reserved.
The devolatilized gases of pyrolysis can be condensed as bio-oils which can be used as a feedstock or a value-added product [12]. In addition, bio-chars generated by the pyrolysis were found to have excellent ad-sorption properties to reduce total nitrogen (TN) and CODCrleaching
[9]. The temperature and atmosphere type are the major drivers of the thermochemical processes as well as the difference in reactivity [15]. For example, the pyrolysis of biomass wastes was reported to lead to a significantly less char yield in the pure CO2than N2atmosphere [16].
Pyrolysis in the CO2atmosphere was found to enhance C4
hydrocarbon-cracking, impede the formation of benzene derivatives and generate less condensable hydrocarbons (tar) and chars with a higher specific surface area [17,18]. Li et al. [19] found that the char gasification occurred at a high temperature zone, while the mass loss rate was higher in the N2than CO2atmosphere in a low temperature zone. Mafu
et al. [20] reported that the gasification of bio-chars resulted in higher reactivity than did that of coal chars.
Thermogravimetric (TG) analysis is essential to a better under-standing of pyrolysis behaviors and products as a function of time and temperature in a controlled atmosphere [4,21]. The TG data provide the kinetic parameters to design and optimize the thermal conversion systems. Cumming and McLaughlin [22] emphasized the role of the TG data in the industrial-scale generation of bioenergy. Li et al. [23] op-timized the operational conditions for the co-combustion of tobacco residue and high-ash anthracite coal by using TG analysis. Based on TG/ DSC-FTIR analyses, Yang et al. [24] pointed out that hemicellulose, cellulose and lignin degraded at different temperatures and emitted different gas products during pyrolysis due to their different functional groups and chemical structures. Zhao et al. [25] showed that CO2, CO,
and CH4were most evolved from the pyrolysis of hemicellulose,
cel-lulose, and lignin, respectively, using pyrolysis-gas chromatography/ mass spectrometry (Py-GC/MS) in the TG experiments. Hemicellulose, cellulose, and lignin also play an important role in the pyrolysis/gasi-fication behaviors and gas products of SMS as a lignocellulosic by-product of the mushroom industry.
Model-free and model-fitting methods based on TG data have been successfully used to understand the kinetic and thermodynamic per-formance parameters of solid wastes during the pyrolysis [25,26]. The model-free methods such as Flynn-Wall-Ozawa (FWO), Starink, and distributed activation energy model (DAEM) have the following two major advantages: (1) no assumption about the kinetic models, and (2) conversion degree-dependent activation energy estimates [11,27]. The model-fitting approach such as Coats and Redfern method (CR) has been adopted to explain the mechanisms of the different reaction stages [2,28]. However, activation energy estimates by the model-fitting method are an average value for the overall degradation process and do not capture the interaction among kinetic parameters, temperature, and conversion degree [29].
In light of the above related literature, there still exists a significant knowledge gap about the pyrolytic products, and kinetic and thermo-dynamic behaviors of SMS in a changing atmosphere, theoretically and operationally essential to the development of industry-scale pyrolysis technologies to boost the bioenergy generation from solid wastes. The objectives of this study were to quantify (1) the thermal degradation behaviors of SMS as a function of four heating rates in the CO2and N2
atmospheres using TG analysis, (2) their pyrolysis performances and reaction mechanisms using the kinetic and thermodynamic parameters, and (3) gas products using Py-GC/MS analysis.
2. Materials and methods
2.1. Sample preparation and characterization
Spent mushroom substrate samples were collected from a mush-room factory (Ruyiqing Group Co., Ltd) in Xiamen of the Fujian pro-vince, China. The mushroom substrate was mainly made of cottonseed husk (30%), corn cob (70%), and N and P fertilizers added to meet the
need of the mushroom cultivation. SMS was collected after mushroom was cultivated for several cycles which was abandoned due to the lack of nutrients. SMS was placed into a sealed bag in the factory and then transported to laboratory. The naturally dried SMS at ambient tem-perature was pulverized and then ball milled to ensure that the particle size was smaller than 74 μm. The SMS samples were dried at 105 °C for 24 h in an oven and then stored in a desiccator for subsequent experi-ments. Proximate analyses of SMS on an air-dry basis were determined according to the standard method of China (GB/T 28731-2012). The carbon, hydrogen, nitrogen and sulfur contents in the ultimate analysis were determined using an elemental analyzer (Vario EL cube by Elementar), while oxygen was determined by difference [5]. Results of the proximate/ultimate experiments conducted for three times to en-sure the reliability were obtained from our previous study [11] (Table 1). The components of SMS were determined using the wet chemistry method of Van Soest for the three replicates.
2.2. TGA experiments
The influences of the four heating rates (β = 10, 15, 20 and 25 °C/ min), and the CO2and N2 atmospheres on the thermal degradation
behaviors of SMS were determined using a TG analyzer (STA-409, NETZSCH). Prior to the experiments, a blank experiment was con-ducted for each condition to obtain the baseline to eliminate the sys-tematic errors of the instrument. In terms of repeatability and accuracy, the samples randomly chosen under the same conditions were also measured three times so that the relative errors of the repeated ex-periments were within ± 2% [30]. In each experimental run, about 6 mg of the samples were put in an alumina crucible and then heated in a furnace from ambient temperature to 900 °C at a gas flow rate of 50 mL/min.
To evaluate the pyrolysis performances at the heating rates, the comprehensive devolatilization index (D) was used as follows, with the higher D values representing a better volatile release performance [31]:
= × × × D R R T T T ( P) ( V) i P 1/2 (1)
where -Rp and -RV: the maximum and mean mass loss rates,
respec-tively; Tiand Tpare ignition and peak temperatures, respectively; and
ΔT1/2is the time range at half value of -RP; 2.3. Py-GC/MS analysis
Py-GC/MS analysis was conducted at the Guangzhou Institute of Geochemistry of the Chinese Academy of Sciences to online-monitor the releases of organic pyrolysis products. A Frontier Lab PY-2020id
Table 1
Results of proximate/ultimate and composition analyses on an air-dried basis. Parameter SMS Proximate analysis (%) Moisture 8.89 ± 0.17 Volatiles matters 62.9 ± 0.37 Ash 10.9 ± 0.14 Fixed carbon∗ 17.3 ± 0.68 Ultimate analysis (%) Carbon 42.5 ± 0.11 Hydrogen 5.80 ± 0.08 Nitrogen 2.15 ± 0.07 Oxygen∗ 29.7 ± 0.49 Sulfur 0.10 ± 0.01 Component (%) Hemicellulose 18.5 ± 0.16 Cellulose 22.7 ± 0.33 Lignin 13.6 ± 0.07 ∗ Calculated by difference.
pyrolysis reactor (800 °C for 24 s) using purified He as the carrier gas was coupled to a GC/MS equipped with a HP-5MS capillary column (30 m × 0.32 mm × 0.25 μm). The initial temperature of the GC/MS oven was kept at 40 °C for 2 min, elevated to 300 °C under a constant heating rate of 10 °C/min and held on for 10 min. The volatiles matters during the pyrolysis were identified using the NIST mass spectral li-brary and relevant literature.
2.4. Kinetic and thermodynamic analyses
The integral methods were used to estimate the kinetic parameters during the thermal degradation of SMS. The kinetic equations can be described thus [2]:
= d
dt k T f( ) ( ) (2)
where is conversion degree; t is reaction time; T is actual temperature (K); k is the reaction rate constant; and f ( ) is the function of reaction mechanism. Conversion degree was determined as follows:
= m m m m t t 0 (3) where m0,mt and m are the initial, actual and final masses of the
samples, respectively.
According to the Arrhenius equation, k (T) can be expressed as follows: = k T A E RT ( ) exp (4) where A is the pre-exponential factor; E is activation energy; and R is the universal gas constant (8.31J/(K mol)).
TG experiments were performed using linearly increased heating rates for the non-isothermal reactions, = dT dt/ . Therefore, by com-bining Eqs.(2)and(3), Eq.(1)can be rewritten thus:
= d dT A f E RT ( ) exp( ) (5) The kinetic parameters of heterogeneous reactions cannot be esti-mated using a single TG curve. The TG experiments were designed using the four heating rates (β) of 10, 15, 20 and 25 °C/min. Without the determination of the kinetic models of the reaction mechanisms, the three iso-conversional methods of FWO, DAEM, and Starink were ap-plied simultaneously to estimate reliable E values.
2.5. Flynn-Wall-Ozawa (FWO) method
Estimates of E values according to the FWO method have the ad-vantage of eliminating bias from the assumption about a possible re-action mechanism model. Combining the integral iso-conversional methods and the Doyle approximation, the FWO method can be ex-pressed as follows [1]: = AE Rg E RT lg lg( ( )) 2.315 0.4567 (6)
where g ( ) is the integral form of reaction mechanism function; and lg(Rg ( )AE )is a constant obtained fitting a linear model into the plot of lg versus 1/T. Since corresponded to a certain T for each TG curve, the linear models were fitted into the four plots of lg versus 1/T. Thus, E estimates were derived from their slopes (-0.4567E/R).
The thermodynamic estimates of the pre-exponential factor (A), and Gibbs free energy (ΔG), entropy (ΔS) and enthalpy changes (ΔH) were based on E values as follows [2]:
= A E E RT RT [ exp( )]/( ) p p 2 (7) = H E RT (8) = + G E RT K T hA ln( ) p B p (9) = S ( H G T)/ p (10)
where KBis Boltzmann constant (1.381 × 10⁻³⁴J/K); h is Plank
con-stant (6.626 × 10⁻³⁴J∙s); and T
pis peak temperature (K) of the
deri-vative TG curve.
2.6. Distributed activation energy model (DAEM)
The DAEM method has been commonly applied to the multiple-stage reaction kinetics of the pyrolysis under the assumption of an in-finite parallel reaction and activation energy distribution. The Arrhenius equation can be simplified as follows [1]:
= + T AR E E RT ln( 2) ln( ) 0.6575 (11)
A series of points for (ln( )T2 , 1/T) were obtained from the
experi-mental data for each conversion degree, and their slopes (-E/R) were used to estimate E values.
2.7. Starink method
The Starink method couples the KAS and FWO methods to obtain reliable E estimates. The Starink method can be expressed as follows [27]: = T C E RT ln( 1.92) s 1.0008 (12)
The slopes (-1.0008 E/R) of the linear models fitted into the plots of ln( )
T1.92 versus 1/T were used to estimate E values.
2.8. Reaction mechanism function
The most suitable kinetic model was determined to describe the experimental data. Eq. (12) was derived from Eq. (4) integrated as follows [32]: = = g d f A E RT dT ( ) ( ) T exp( ) T 0 0 (13)
Eq.(13)can be further transformed into Eq.(14)as follows using the Coats and Redfern approximation models [33]:
= g T AR E RT E E RT ln ( )2 ln [1 2 ] (14) According to the Coats and Redfern method, RT E2 / 0[2], the following can be given:
= g T AR E E RT ln ( )2 ln (15) Given a suitable reaction mechanism, a linear model can be fitted into the plot of ln(g )
T ( )
2 against 1/T whose slopes yield both E values and
pre-exponential factor (A). The best-fit model with a highest coefficient of determination (R2) was selected as the best-fit reaction mechanism
[34]. A great number of reaction mechanisms were tested to find the optimal reaction mechanism function.
3. Results and discussion
3.1. Physical and chemical characteristics
The proximate/ultimate analyses and the components character-istics of SMS are presented inTable 1. SMS had a high content of vo-latiles matters (62.9%) and a low content of fixed carbon (17.3%). A moisture content lower than 10% was shown to shorten the time for the drying process [35]. The lower carbon and sulfur contents of SMS than
bituminous coal indicated that SMS can be a more cleaner renewable biofuel with less CO2and SOxemissions [36]. The composition of SMS
(Table 1) showed that SMS was rich in cellulose (22.7%) followed by hemicellulose (18.5%), and lignin (13.6%). Their high total proportion (54.8%) indicated their dominant role in the distribution of gas pro-ducts during the pyrolysis/gasification process [6]. The thermal stabi-lity of the three components due to their different chemical structures and function groups was shown to be of the following order: hemi-cellulose < hemi-cellulose < lignin [24].
3.2. Pyrolysis behaviors in a changing atmosphere
The TGA experiments offered the considerable information to cap-ture the fuel thermal decomposition behaviors. The TG and DTG curves of the SMS pyrolysis in the N2atmosphere at the four heating rates
(Fig. 1) showed the following main three stages: the evaporation of moisture and the decomposition of some light hydrocarbons (stage I); the devolatilization of (hemi-)cellulose (stage II); and the decomposi-tion of residuals (stage III). In particular, the weight loss at above 750 °C in the CO2atmosphere was regarded as the char–gasification
process as there was no significant change in the DTG curves in the N2
atmosphere.
According toFig. 2, the moisture evaporation occurred between the initial temperature and 200℃ in both atmospheres, with the mass loss ranges of 2.65–3.96% and 3.52–4.23%, respectively. Stage II was where the major mass losses of 60.4 and 61.5% at 20 °C/min in the CO2and N2
atmospheres, respectively, occurred due to the devolatilization of such components as (hemi-)cellulose and protein. Since the pyrolysis was the first step of gasification, the mass loss rate at this stage was not sig-nificant. Since the maximum mass loss rates (12.6 and 13.0%/min)
occurred at 345 and 348 °C in the CO2and N2atmospheres at 20 °C/
min, respectively (Table 2), the thermal conversion of SMS into various products can be effectively controlled at this stage.
Stage III belonged to the residual decomposition though secondary reactions including re-polymerization and re-condensation in the CO2
and N2 atmospheres, respectively [37]. In the range of initial
tem-perature to 750 °C, the trends of the TG and DTG curves were similar in both atmospheres. However, the TG and DTG curves changed promi-nently and about 8% mass loss occurred at above 750 °C due to the reaction between SMS and CO2(Fig. 1b). The pyrolysis was the first
step when thermal conversion was conducted in the CO2atmosphere,
while gasification dominated the main reaction in the high temperature zone [19,38]. Tang et al. [16] reported the similar results that CO2can
be a reactant to biomass at high temperature. The reason for this may be the gasification of SMS in the CO2 atmosphere which can be
ex-pressed thus:
C + CO2⇋2CO, ΔH = 1.44 × 10⁷J/kg (16)
This reaction at the high temperature is exponentially dependent on temperature [39]. Due to the high energy demand, the gasification process was mostly studied in the CO2atmosphere at above 800 °C to
generate less chars with developed pore structures and less tar [40,41]. According to the Boudouard reaction (homogeneous and heterogeneous reactions), CO2can directly react with chars, tars and gases to hinder
their secondary formations, thus generating less residuals at above 650 °C [17]. It can be inferred that CO2behaved as an inert gas carrier
like N2 at the low temperatures and accelerated the consumption of
residuals at the high temperature.
For each of the DTG curves, a first shoulder peak was observed at 300 and 306 °C in CO2and N2atmospheres, respectively, most likely Fig. 1. TG (a, c) and DTG (b, d) curves of SMS pyrolysis in the CO2and N2atmospheres at the four heating rates.
due to the decomposition of hemicellulose. Zhao et al. [25] pointed out that the maximum weight loss rate during the pyrolysis of hemi-cellulose was attained at 295 °C which was consistent with the first shoulder peak of SMS. The maximum mass loss rate associated with the decomposition of cellulose was also reported in related literature. Cel-lulose with a long polymer of glucose without branches resulted in its stable structure and high thermal stability, degraded in the range of 315–400 °C and reached its maximum mass loss rate at about 355 °C [24]. The maximum peak in the range of 300–400 °C can be attributed to the depolymerization and glucosidic linkage scission of lig-nocellulosics [1]. Since lignin degrades in a wide range of 100–900 °C due to its chemical bonds, no clearly marked boundaries were observed for the decompositions of the different components [24]. The higher cellulose than hemicellulose and lignin contents of SMS (Table 1) in-dicated that the maximum peak was mainly attributed to the de-gradation of cellulose.
3.3. Pyrolysis performances in a changing atmosphere
According to the nine characteristic parameters obtained for the atmospheres and heating rates (Table 2), the ignition (Ti) and peak (Tp)
temperatures as the indicator of the volatiles performance were similar regardless of the atmosphere type. However, the burnout temperature (Tb) was higher (108 °C) in the CO2than N2 atmosphere due to the
gasification reaction in the CO2atmosphere. Hence, the pyrolysis in the
different atmospheres did not influence the decomposition behavior significantly at the low temperature which was mainly affected by the fuel property. The maximum mass loss rate was slightly lower in the CO2than N2atmosphere due to the inhibitory effect, transport property
and specific heat capacity of CO2relative to N2[19,39]. However, the
average mass loss rate was slightly lower in the N2 than CO2
atmo-sphere due to the gasification in the CO2atmosphere at the high
tem-perature zone. The D values were slightly higher in the N2than CO2
atmosphere. The D value of SMS was close to that of rapeseed meal
(2.55 × 10⁻⁶ %2/(°C3min2)) but lower than that of rapeseed straw
(9.67 × 10⁻⁶%2/(°C3min2)) and camellia seed shell (7.16 × 10⁻⁶%2/
(°C3min2)) at 20 °C/min [31].
A shorter burnout time in the N2than CO2atmosphere indicated
that the pyrolysis in the N2atmosphere was more feasible and efficient.
All the peak mass loss rates (-Rp) were higher in the N2than CO2
at-mosphere at the same heating rate. The Tp values indicated that the
characteristic temperatures shifted to a higher temperature region with the increased heating rate. The linear regression models of Tp= 0.912β
+ 326 and Tp= 1.07β + 325 were found to best describe the
re-lationships between the heating rates and peak temperature in the CO2
and N2atmospheres, respectively. The TG and DTG curves shifted
to-ward a higher temperature zone due to the enhanced heat transfer limitations (also known as thermal hysteresis) caused by the increased heating rate [27,42]. The increased heating rate caused the peak tem-perature and decomposition rate to grow higher but not to change the attribution of the decomposition [12]. The increased heating rates also improved the volatiles release performance owing to the enhanced energy input, as was also indicated by the increased D value in the CO2
atmosphere.
3.4. Kinetic and thermodynamic analyses in a changing atmosphere The thermodynamic and kinetic parameters play a vital role in the design, upgrading and scaling of the industrial reactors [12]. The ki-netic and thermodynamic parameters of E, A, ΔH, ΔG, and ΔS were estimated in the range of 200–600 °C during which a 60% weight loss occurred. Activation energy is the minimum energy to start the che-mical reaction and is usually used to determine the reactivity and sensitivity of a reaction [43]. The average E estimates did not differ significantly in the CO2and N2atmospheres according to the FWO,
DAEM and Starink methods, with their R2values being higher than 0.93
(Table 3).
The ranges of the E estimates in the CO2 and N2 atmospheres Fig. 2. Weight losses of pyrolysis stages at four heating rates in (a) CO2and (b) N2atmospheres.
Table 2
Characteristic performance parameters of SMS pyrolysis based on TG experiments.
β (°C/min) Ti(°C) Tp(°C) Tb(°C) ΔT1/2(°C) -Rp(%/min) -RV(%/min) Mf(%) tb(min) D (%2/(°C3∙min2))
CO2 10 272 334 884 79.4 6.19 0.88 24.6 87.0 7.53 × 10⁻⁷ 15 288 342 881 81.6 9.31 1.30 26.5 58.2 1.51 × 10⁻⁶ 20 304 345 879 83.1 12.6 1.71 28.5 43.8 2.48 × 10⁻⁶ 25 284 348 874 91.6 14.4 2.15 29.3 35.0 3.43 × 10⁻⁶ N2 10 276 335 813 77.7 6.38 0.80 30.8 79.9 7.13 × 10⁻⁷ 15 292 342 799 76.6 9.83 1.22 30.8 52.7 1.58 × 10⁻⁶ 20 302 348 770 80.1 13.0 1.67 30.3 38.4 2.59 × 10⁻⁶ 25 288 351 774 81.7 16.6 2.11 30.5 31.0 4.25 × 10⁻⁶
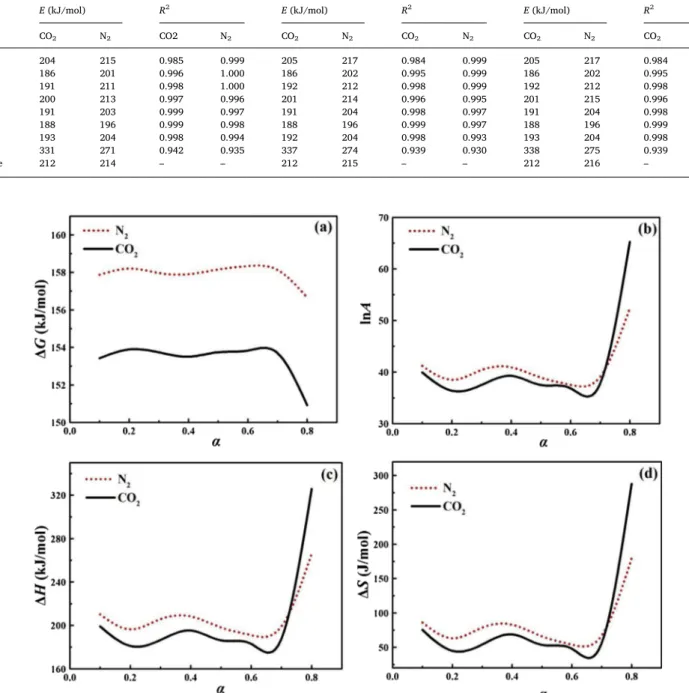
according to the FWO method showed that the same reaction me-chanism was not appropriate to explain the entire process. The pyr-olysis of SMS involved different reaction mechanisms in the various reaction stages. In related literature, the multiple-step kinetics were estimated when E changed significantly with the conversion degree [1]. The rates of change in E were most pronounced at α = 0.7 (about 350 °C) in both atmospheres. The drastic changes in the E values ap-peared to correspond to the char formation stage due to the existence of minerals which can act as a barrier to the diffusion of heat, and the decomposition and release of volatiles [27]. The thermodynamic parameters were derived from the E estimates by the FWO method in the CO2 and N2 atmospheres at the heating rate of 20 °C/min
(Fig. 3). No significant change in ΔG was found between the two atmospheres (Fig. 3a), with a higher ΔG value indicating lower
reaction favorability [42].
The higher pre-exponential factor (A 109 s−1) represents the
higher complexity level of the reaction [27]. The values of lnA differed by several orders of magnitude between the CO2and N2atmospheres
(Fig. 3b). A more complex reaction occurred with the highest conver-sion degree. The range of A values was higher for SMS than rice straw (1.70×1072.37×10671.70×1007to9.35×1012 9.35×10¹² 2.37×1067 s−1), rice bran (1.00×1007 1.00×10⁷ 2.37×1067 to 1.58×1010
×
2.37 10671.58×1010 s−1), and switchgrass (3.70×1032.37×1067 to ×
1.65 1021 2.37×1067 s−1) [2]. The close agreement between the
ranges of ΔH and E in the N2atmosphere revealed the energy difference
between the activated complex and the reagent [44]. The higher ΔS in the N2than CO2atmosphere pointed to the higher reactivity of the
pyrolysis of SMS [42].
Table 3
E and R2estimates according to the FWO, DAEM and Starink methods in the CO
2and N2atmospheres.
α FWO DAEM Starink
E (kJ/mol) R2 E (kJ/mol) R2 E (kJ/mol) R2
CO2 N2 CO2 N2 CO2 N2 CO2 N2 CO2 N2 CO2 N2 0.1 204 215 0.985 0.999 205 217 0.984 0.999 205 217 0.984 0.999 0.2 186 201 0.996 1.000 186 202 0.995 0.999 186 202 0.995 0.999 0.3 191 211 0.998 1.000 192 212 0.998 0.999 192 212 0.998 0.999 0.4 200 213 0.997 0.996 201 214 0.996 0.995 201 215 0.996 0.995 0.5 191 203 0.999 0.997 191 204 0.998 0.997 191 204 0.998 0.997 0.6 188 196 0.999 0.998 188 196 0.999 0.997 188 196 0.999 0.997 0.7 193 204 0.998 0.994 192 204 0.998 0.993 193 204 0.998 0.993 0.8 331 271 0.942 0.935 337 274 0.939 0.930 338 275 0.939 0.931 Average 212 214 – – 212 215 – – 212 216 – –
3.5. Reaction mechanisms in a changing atmosphere
The results showed that the R2 (g(α)=(1-α)−1-1) models were the
most suitable reaction mechanisms when α ranged from 0.1 to 0.8 (about 260–370 °C) for the pyrolysis of SMS in both atmospheres (Table 4). The model with the highest R2 was selected as the most
suitable reaction mechanism for the pyrolysis process. However, this average E estimate of the entire pyrolysis process as a single kinetic model had higher errors than did the iso-conversional estimates [1].
There was no significant difference between the atmospheres in terms of the E values as a function of α value between 0.1 and 0.8, and the reaction mechanism of the pyrolysis. The R2 model represents the mechanism of enhanced random nucleation with two nucleus on in-dividual particles which offer greater growth centers to accelerate the degradation of cellulose chains [45]. The volatiles of SMS degraded immediately in the range of 200–400 °C which may be catalyzed by its inorganic matters such as silica according to the R2 model [45]. The experimental and calculated α values were consistent according to the R2 model in the range of 200–370 °C (Fig. 4). The R2 model appeared to be suitable for the volatilization stage of (hemi-)celluloses. Ding et al. [8] reported the similar results that the 2nd or 3rd-order reaction me-chanism best elucidated the pyrolysis behaviors of hard/softwoods also rich in (hemi-)celluloses.
3.6. Major pyrolytic products
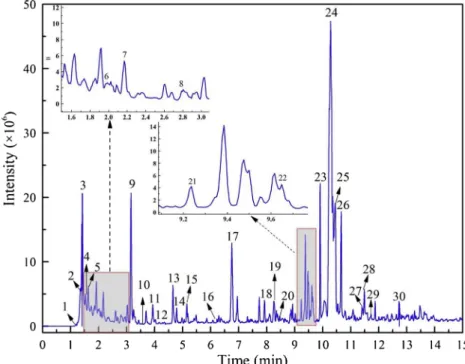
The Py-GC/MS experiments were conducted to identify the volatiles evolved from the pyrolysis of SMS. The thermal decomposition of SMS
in the inert (N2) atmosphere ended at about 800 °C, as was indicated by
the burnout temperature inTable 2, which was also selected as the pyrolysis temperature for the Py-GC/MS analyses. The resultant pyr-olysis by-products of SMS such as bio-oils, gases, and solid products can be used as biofuels and value-added chemicals in further processes [46].Fig. 5shows the chromatogram of the pyrolytic products of SMS. The bio-oil components of the SMS pyrolysis identified at 800 °C using the database of NIST library and published data are presented in Table 5.
The gaseous products identified in this study were composed mainly of aliphatic hydrocarbons (ALHs, mainly alkanes and alkenes), aromatic hydrocarbons (ARHs), phenols, and others nitrogen-containing com-pounds. Benzene and its derivatives (ARHs) were derived from the decomposition of lignin, and (hemi-)cellulose. Similar results were obtained with the pyrolytic products of bagasse [7]. Also, aromatic hydrocarbons were reported to generate from the secondary cracking reactions of proteins and alkenes through an intermolecular reaction [7]. The main bio-oil compounds from the lignin pyrolysis were phenols affected by the higher temperatures [25]. The phenolic compounds of SMS detected in this study included phenol, 2-methyl-phenol, and pyrocatechol. Zhang et al. [47] found a new approach to produce 4-ethyl phenol selectively from the low-temperature catalytic fast pyr-olysis of bagasse which also existedin the products of the SMS pyrpyr-olysis (x-ethyl-phenol).
Only the following two types of polycyclic aromatic hydrocarbons (PAHs) were detected from the pyrolysis process: naphthalene (1.30%) and methyl-naphthalene (2.03%). The generation of naphthalene can be attributed to the isomerization and polymerization of p-cresol [48]:
Table 4
E (kJ/mol) and R2estimates from the slopes of the various reaction mechanisms when α ranges from 0.1 to 0.8.
Symbol g(α) CO2 N2 Equation R2 E Equation R2 E Diff ;usion D1 α2 y = -12466x + 6.23 0.967 104 y = -12269x + 5.89 0.966 102 D2 (1-α)ln(1-α)+α y = -13678x + 7.78 0.979 114 y = -13465x + 7.39 0.977 112 D3 [1-(1-α)1/3]2 y = -15131x + 8.93 0.988 126 y = -14899x + 8.52 0.988 124 D4 1-2α/3-(1-α)2/3 y = -14159x + 7.15 0.982 118 y = -13939x + 6.76 0.981 116 Contracting F2 1-(1-α)1/2 y = -6618x - 3.16 0.981 55.0 y = -6505x - 3.37 0.979 54.1 F3 1-(1-α)1/3 y = -6975x - 2.91 0.986 58.0 y = -6858x - 3.12 0.985 57.0 Power law P2/3 α3/2 y = -9055x + 0.985 0.965 75.3 y = -8906x + 0.717 0.963 74.0 P2 α1/2 y = -2231x - 9.51 0.933 18.6 y = -2181x - 9.60 0.929 18.1 P3 α1/3 y = -1094x - 11.3 0.878 9.10 y = -1060x - 11.3 0.868 8.81 P4 α1/4 y = -526x - 12.1 0.736 4.37 y = -500x - 12.2 0.712 4.15 Avrami-Erofeev A1 [-ln(1-α)]2/3 y = -4768x - 5.20 0.992 39.6 y = -4683x - 5.35 0.991 38.9 A2 [-ln(1-α)]1/2 y = -3281x - 7.59 0.990 27.3 y = -3217x - 7.70 0.988 26.8 A3 [-ln(1-α)]1/3 y = -1794x - 9.98 0.984 14.9 y = -1751x - 10.0 0.981 14.6 A4 [-ln(1-α)]1/4 y = -1050x - 11.2 0.971 8.73 y = -1018x - 11.2 0.967 8.46 Reaction order R1 -ln(1-α) y = -7742x - 0.412 0.993 64.4 y = -7616x - 0.641 0.992 63.3 R2 (1-α)−1-1 y = -10451x + 4.52 0.997 86.9 y = -10291x + 4.23 0.996 85.6 R3 1/2[(1-α)−2-1] y = -13713x + 10.4 0.981 114 y = -13512x + 10.1 0.982 112
According to the Maillard reaction, x-methyl-1H-indole (1.51%), benzyl nitrile (0.78%), 2-methyl-pyridine (0.51%), and other nitrogen-containing compounds were derived from the reactions of the carbonyl and amino functional groups of protein [46]. The presence of
nitrogen-containing compounds in bio-oils is concerning due to the generation of NOxduring the process. CaO is a significant disinfectant used in the
cultivation of edible mushroom and facilitates the transition of N in chars as follows: CaO + char N → CaCx + CO + N2[7]. The smaller
amounts of N-containing compounds found in the biofuels make them a
Fig. 4. The R2 models for volatiles decomposition stages in the (a) CO2and (b) N2atmospheres; the comparison of experimental and calculated α values in the (c)
CO2and (d) N2atmospheres according to R2 model in the α range of 0.1 to 0.8.
cleaner energy source.
2,3-dihydro-benzofuran, toluene and benzene were the three major products of the SMS pyrolysis with the peak areas of 10.5, 6.63 and 5.50%, respectively. This suggests that the compounds with benzene ring were the major products of the bio-oils. The generation of toluene and benzene were attributed mainly to the degradation of (hemi-)cel-luloses, and protein [48]. 2,3-dihydro-benzofuran was derived from phenylbenzofuran which can be found in lignin, as was shown in the below reaction mechanism [7]:
The pyrolysis of lignin involved the breaking of ether bonds and CeC bonds with a series of reactions including dehydration, demethy-lation, decarbonydemethy-lation, decarboxydemethy-lation, and alkylation [49]. Oxyge-nated compounds of the bio-oils were also generated such as 2, 5-di-methyl-furan, and 2-(1-methylethoxy)-phenol. The formation of furan was mainly attributed to the open-ring reactions and the dehydration of cellulose to create furan ring from the glucopyranose structure [49]. Not only can the bio-oil products of the SMS pyrolysis be used as the biofuels, but also most of their components if separated using special techniques can be ultilized as the chemical feedstocks.
4. Conclusions
The thermal degradation behaviors of SMS in the CO2and N2
at-mospheres were quantified using TG and Py-GC/MS analyses. The de-composition rate and comprehensive devolatilization index were found to be slightly higher in the N2than CO2atmosphere regardless of the
heating rate. The significant changes in the DTG curves in the CO2
at-mosphere at above 750 °C seemed to be caused by the gasification of SMS. The pyrolysis behaviors showed no significant difference in terms of the E estimates but exhibited complex reactions since the E values changed significantly with the increased conversion degree. The E va-lues were estimated at 212 kJ/mol in the CO2atmosphere, while 214,
215 and 216 kJ/mol were estimated in the N2 atmosphere using the
FWO, DAEM and Starink methods, respectively. There was a dramatic
Table 5
Major pyrolytic products of SMS based on Py-GC/MS analyses at 800 °C.
Num Peak time (min) Substance Peak area (%)
Formula m/z Molecular structure
1 1.20 2-Butene 2.93 C4H8 56 2 1.33 Isoprene 4.22 C5H8 68 3 1.42 Cyclopentadiene 4.26 C5H6 66 4 1.56 1-Hexene 1.35 C6H12 84 5 1.64 2,4-Hexadiene 0.87 C6H10 82 6 2.01 Benzene 5.50 C6H6 78 7 2.23 Cyclopentane 0.47 C7H14 98 8 2.81 1-methyl-Cyclohexadiene 1.44 C8H12 108 9 3.16 Toluene 6.63 C7H8 92 10 3.51 1-Octene 0.34 C8H16 112 11 3.93 2-methyl-Pyridine 0.51 C6H7N 93 12 4.18 2,5-dimethyl-Furan 1.94 C6H8O 96 13 4.65 Ethylbenzene 2.16 C8H10 106 14 4.78 Xylene 1.57 C8H10 106 15 5.15 Styrene 4.22 C8H8 104 16 6.23 propyl-Benzene 0.37 C9H10 118 17 6.76 Phenol 4.77 C6H6O 94 18 7.93 2-methyl-Phenol 1.87 C7H8O 108 19 8.26 4-methyl-Phenol 4.46 C7H8O 108 20 8.48 1-Undecene 0.43 C11H22 154 21 9.24 Benzyl nitrile 0.78 C8H7N 117 22 9.65 x-ethyl-Phenol 3.12 C8H10O 122 23 9.91 Naphthalene 1.30 C10H8 128 24 10.28 Pyrocatechol 3.31 C6H6O2 110 25 10.45 Benzofuran,2,3-dihydro- 10.5 C8H8O 120 26 10.66 2-(1- methylethoxy)-Phenol 1.14 C9H12O2 152 Table 5 (continued) Num Peak time (min) Substance Peak area (%)
Formula m/z Molecular structure
27 11.42 Durene 1.48 C10H14 134 28 11.5 x-methyl-Naphthalene 2.03 C11H10 142 29 11.73 x-methyl-Naphthalene 1..17 C11H10 142 30 12.73 x-methyl-1H-lndole 1.51 C9H9N 131
change in the E values as well as the thermodynamic parameters (ΔG, ΔS, ΔH and A) at above 350 °C most probably due to the burnout of volatiles. The reaction mechanisms involved in the volatiles decom-position stages in both atmospheres were best explained using the R2 model. The pyrolysis products identified using Py-GC/MS were found to be rich in the complex components of the bio-oil and aromatic com-pounds.
Acknowledgments
This work was financially supported by the National Natural Science Foundation of China (No. 51608129), and the Science and Technology Planning Project of Guangdong Province, China (No. 2016A050502059, 2017A050501036, 2018A050506046, 2019B020208017).
References
[1] G. Chen, S. He, Z. Cheng, Y. Guan, B. Yan, W. Ma, et al., Comparison of kinetic analysis methods in thermal decomposition of cattle manure by themogravimetric analysis, Bioresour. Technol. 243 (2017) 69–77.
[2] M.S. Ahmad, M.A. Mehmood, S.T.H. Taqvi, A. Elkamel, C.-G. Liu, J. Xu, et al., Pyrolysis, kinetics analysis, thermodynamics parameters and reaction mechanism of Typha latifolia to evaluate its bioenergy potential, Bioresour. Technol. 245 (2017) 491–501.
[3] J. Yu, C. Yao, X. Zeng, S. Geng, L. Dong, Y. Wang, et al., Biomass pyrolysis in a micro-fluidized bed reactor: characterization and kinetics, Chem. Eng. J. 168 (2011) 839–847.
[4] E. Müsellim, M.H. Tahir, M.S. Ahmad, S. Ceylan, Thermokinetic and TG/DSC-FTIR study of pea waste biomass pyrolysis, Appl. Therm. Eng. 137 (2018) 54–61. [5] C. Xie, J. Liu, X. Zhang, W. Xie, J. Sun, K. Chang, et al., Co-combustion thermal
conversion characteristics of textile dyeing sludge and pomelo peel using TGA and artificial neural networks, Appl. Energy 212 (2018) 786–795.
[6] K. Lazdovica, V. Kampars, L. Liepina, M. Vilka, Comparative study on thermal pyrolysis of buckwheat and wheat straws by using TGA-FTIR and Py-GC/MS methods, J. Anal. Appl. Pyrol. 124 (2017) 1–15.
[7] Y. Lin, Y. Liao, Z. Yu, S. Fang, X. Ma, A study on co-pyrolysis of bagasse and sewage sludge using TG-FTIR and Py-GC/MS, Energ. Convers. Manage. 151 (2017) 190–198.
[8] Y. Ding, O.A. Ezekoye, S. Lu, C. Wang, R. Zhou, Comparative pyrolysis behaviors and reaction mechanisms of hardwood and softwood, Energ. Convers. Manage. 132 (2017) 102–109.
[9] Z. Lou, Y. Sun, S. Bian, S. Ali Baig, B. Hu, X. Xu, Nutrient conservation during spent mushroom compost application using spent mushroom substrate derived biochar, Chemosphere 169 (2017) 23–31.
[10] Y. Fan, Z. Yu, S. Fang, Y. Lin, Y. Lin, Y. Liao, et al., Investigation on the co-com-bustion of oil shale and municipal solid waste by using thermogravimetric analysis, Energy Convers. Manage. 117 (2016) 367–374.
[11] J. Huang, J. Liu, J. Chen, W. Xie, J. Kuo, X. Lu, et al., Combustion behaviors of spent mushroom substrate using TG-MS and TG-FTIR: thermal conversion, kinetic, ther-modynamic and emission analyses, Bioresour. Technol. 266 (2018) 389–397. [12] X. Huang, J.-P. Cao, X.-Y. Zhao, J.-X. Wang, X. Fan, Y.-P. Zhao, et al., Pyrolysis
kinetics of soybean straw using thermogravimetric analysis, Fuel 169 (2016) 93–98. [13] R.E. Guedes, A.S. Luna, A.R. Torres, Operating parameters for bio-oil production in
biomass pyrolysis: a review, J. Anal. Appl. Pyrol. 129 (2018) 134–149. [14] A. Gupta, S.K. Thengane, S. Mahajani, CO2gasification of char from lignocellulosic
garden waste: Experimental and kinetic study, Bioresour. Technol. 263 (2018) 180–191.
[15] A.B. Hernandez, F. Okonta, N. Freeman, Thermal decomposition of sewage sludge under N2, CO2and air: gas characterization and kinetic analysis, J. Environ.
Manage. 196 (2017) 560–568.
[16] Y. Tang, X. Ma, Z. Wang, Z. Wu, Q. Yu, A study of the thermal degradation of six typical municipal waste components in CO2 and N2 atmospheres using TGA-FTIR, Thermochim. Acta 657 (2017) 12–19.
[17] C. Guizani, F.J. Escudero Sanz, S. Salvador, Effects of CO2on biomass fast pyrolysis:
reaction rate, gas yields and char reactive properties, Fuel 116 (2014) 310–320. [18] E.E. Kwon, Y.J. Jeon, H. Yi, New candidate for biofuel feedstock beyond terrestrial
biomass for thermo-chemical process (pyrolysis/gasification) enhanced by carbon dioxide (CO2), Bioresour. Technol. 123 (2012) 673–677.
[19] Q. Li, C. Zhao, X. Chen, W. Wu, Y. Li, Comparison of pulverized coal combustion in air and in O2/CO2mixtures by thermo-gravimetric analysis, J. Anal. Appl. Pyrol. 85
(2009) 521–528.
[20] L.D. Mafu, H.W.J.P. Neomagus, R.C. Everson, G.N. Okolo, C.A. Strydom, J.R. Bunt, The carbon dioxide gasification characteristics of biomass char samples and their effect on coal gasification reactivity during co-gasification, Bioresour. Technol. 258 (2018) 70–78.
[21] L. Nowicki, S. Ledakowicz, Comprehensive characterization of thermal
decomposition of sewage sludge by TG–MS, J. Anal. Appl. Pyrol. 110 (2014) 220–228.
[22] J.W. Cumming, J. McLaughlin, The thermogravimetric behaviour of coal, Thermochim. Acta 57 (1982) 253–272.
[23] X.G. Li, Y. Lv, B.G. Ma, S.W. Jian, H.B. Tan, Thermogravimetric investigation on co-combustion characteristics of tobacco residue and high-ash anthracite coal, Bioresour. Technol. 102 (2011) 9783–9787.
[24] H. Yang, R. Yan, H. Chen, D.H. Lee, C. Zheng, Characteristics of hemicellulose, cellulose and lignin pyrolysis, Fuel 86 (2007) 1781–1788.
[25] C. Zhao, E. Jiang, A. Chen, Volatile production from pyrolysis of cellulose, hemi-cellulose and lignin, J. Energy Inst. 90 (2017) 902–913.
[26] H. Cai, H. Zou, J. Liu, W. Xie, J. Kuo, M. Buyukada, et al., Thermal degradations and processes of waste tea and tea leaves via TG-FTIR: combustion performances, ki-netics, thermodynamics, products and optimization, Bioresour. Technol. 268 (2018) 715–725.
[27] X. Yuan, T. He, H. Cao, Q. Yuan, Cattle manure pyrolysis process: Kinetic and thermodynamic analysis with isoconversional methods, Renew. Energy 107 (2017) 489–496.
[28] M.V. Gil, D. Casal, C. Pevida, J.J. Pis, F. Rubiera, Thermal behaviour and kinetics of coal/biomass blends during co-combustion, Bioresour. Technol. 101 (2010) 5601–5608.
[29] S. Vyazovkin, C.A. Wight, Model-free and model-fitting approaches to kinetic analysis of isothermal and nonisothermal data, Thermochim. Acta 340–341 (1999) 53–68.
[30] L. Huang, C. Xie, J. Liu, X. Zhang, K. Chang, J. Kuo, et al., Influence of catalysts on co-combustion of sewage sludge and water hyacinth blends as determined by TG-MS analysis, Bioresour. Technol. 247 (2018) 217–225.
[31] J. Chen, X. Fan, B. Jiang, L. Mu, P. Yao, H. Yin, et al., Pyrolysis of oil-plant wastes in a TGA and a fixed-bed reactor: thermochemical behaviors, kinetics, and products characterization, Bioresour. Technol. 192 (2015) 592–602.
[32] S.R. Naqvi, R. Tariq, Z. Hameed, I. Ali, M. Naqvi, W.-H. Chen, et al., Pyrolysis of high ash sewage sludge: kinetics and thermodynamic analysis using coats-redfern method, Renew. Energy 131 (2019) 854–860.
[33] J. Chen, L. Mu, J. Cai, P. Yao, X. Song, H. Yin, et al., Pyrolysis and oxy-fuel com-bustion characteristics and kinetics of petrochemical wastewater sludge using thermogravimetric analysis, Bioresour. Technol. 198 (2015) 115–123. [34] J. Chen, Y. Wang, X. Lang, X. Ren, S. Fan, Comparative evaluation of thermal
oxidative decomposition for oil-plant residues via thermogravimetric analysis: thermal conversion characteristics, kinetics, and thermodynamics, Bioresour. Technol. 243 (2017) 37–46.
[35] H. Jiang, Z. Cheng, T. Zhao, M. Liu, M. Zhang, J. Li, et al., Pyrolysis kinetics of spent lark mushroom substrate and characterization of bio-oil obtained from the sub-strate, Energy Convers. Manage. 88 (2014) 259–266.
[36] G. Wang, J. Zhang, J. Shao, Z. Liu, G. Zhang, T. Xu, et al., Thermal behavior and kinetic analysis of co-combustion of waste biomass/low rank coal blends, Energy Convers. Manage. 124 (2016) 414–426.
[37] J. Chen, L. Mu, B. Jiang, H. Yin, X. Song, A. Li, TG/DSC-FTIR and Py-GC in-vestigation on pyrolysis characteristics of petrochemical wastewater sludge, Bioresour. Technol. 192 (2015) 1–10.
[38] I.I. Ahmed, A.K. Gupta, Kinetics of woodchips char gasification with steam and carbon dioxide, Appl. Energy 88 (2011) 1613–1619.
[39] Y. Tang, X. Ma, Z. Lai, Y. Fan, Thermogravimetric analyses of co-combustion of plastic, rubber, leather in N2/O2and CO2/O2atmospheres, Energy 90 (2015)
1066–1074.
[40] Q. Zha, J. Zhao, C.A. Wang, D. Che, Rapid pyrolysis and CO2gasification of
an-thracite at high temperature, J. Energy Inst. 91 (2018) 1143–1152.
[41] G. Wang, J. Zhang, J. Shao, Z. Liu, H. Wang, X. Li, et al., Experimental and modeling studies on CO2gasification of biomass chars, Energy 114 (2016) 143–154. [42] L. Huang, J. Liu, Y. He, S. Sun, J. Chen, J. Sun, et al., Thermodynamics and kinetics
parameters of co-combustion between sewage sludge and water hyacinth in CO2/O2
atmosphere as biomass to solid biofuel, Bioresour. Technol. 218 (2016) 631–642. [43] J. Chen, J. Liu, Y. He, L. Huang, S. Sun, J. Sun, et al., Investigation of co-combustion
characteristics of sewage sludge and coffee grounds mixtures using thermogravi-metric analysis coupled to artificial neural networks modeling, Bioresour. Technol. 225 (2017) 234–245.
[44] A.A.D. Maia, L.C. de Morais, Kinetic parameters of red pepper waste as biomass to solid biofuel, Bioresour. Technol. 204 (2016) 157–163.
[45] D. Mallick, M.K. Poddar, P. Mahanta, V.S. Moholkar, Discernment of synergism in pyrolysis of biomass blends using thermogravimetric analysis, Bioresour. Technol. 261 (2018) 294–305.
[46] D. Irmak Aslan, P. Parthasarathy, J.L. Goldfarb, S. Ceylan, Pyrolysis reaction models of waste tires: Application of Master-Plots method for energy conversion via de-volatilization, Waste. Manage. 68 (2017) 405–411.
[47] Zhang Z-b, Q. Lu, Ye X-n, Li W-t, Y. Zhang, C.-q. Dong, Selective production of 4-ethyl phenol from low-temperature catalytic fast pyrolysis of herbaceous biomass, J. Anal. Appl. Pyrol. 115 (2015) 307–315.
[48] Z. Yu, M. Dai, M. Huang, S. Fang, J. Xu, Y. Lin, et al., Catalytic characteristics of the fast pyrolysis of microalgae over oil shale: Analytical Py-GC/MS study, Renew. Energy 125 (2018) 465–471.
[49] C. Quan, N. Gao, Q. Song, Pyrolysis of biomass components in a TGA and a fixed-bed reactor: thermochemical behaviors, kinetics, and product characterization, J. Anal. Appl. Pyrol. 121 (2016) 84–92.