EUROPEAN ORGANIZATION FOR NUCLEAR RESEARCH (CERN)
CERN-EP-2019-022 2020/01/24
CMS-SMP-17-011
Measurement of electroweak production of a W boson in
association with two jets in proton-proton collisions at
√
s
=
13 TeV
The CMS Collaboration
∗Abstract
A measurement is presented of electroweak (EW) production of a W boson in asso-ciation with two jets in proton-proton collisions at √s = 13 TeV. The data sample was recorded by the CMS Collaboration at the LHC and corresponds to an integrated luminosity of 35.9 fb−1. The measurement is performed for the`νjj final state (with
`ν indicating a lepton-neutrino pair, and j representing the quarks produced in the hard interaction) in a kinematic region defined by invariant mass mjj > 120 GeV and transverse momenta pTj>25 GeV. The cross section of the process is measured in the electron and muon channels yielding σEW(Wjj) = 6.23±0.12 (stat)±0.61 (syst) pb per channel, in agreement with leading-order standard model predictions. The addi-tional hadronic activity of events in a signal-enriched region is studied, and the mea-surements are compared with predictions. The final state is also used to perform a search for anomalous trilinear gauge couplings. Limits on anomalous trilinear gauge couplings associated with dimension-six operators are given in the framework of an effective field theory. The corresponding 95% confidence level intervals are−2.3 <
cWWW/Λ2 < 2.5 TeV−2,−8.8 < cW/Λ2 < 16 TeV−2, and−45 < cB/Λ2 < 46 TeV−2. These results are combined with the CMS EW Zjj analysis, yielding the constraint on the cWWW coupling :−1.8<cWWW/Λ2 <2.0 TeV−2.
”Published in the European Physical Journal C as doi:10.1140/epjc/s10052-019-7585-7.”
c
2020 CERN for the benefit of the CMS Collaboration. CC-BY-4.0 license
∗See Appendix C for the list of collaboration members
1
1
Introduction
In proton-proton (pp) collisions at the CERN LHC, the pure electroweak (EW) production of a lepton-neutrino pair (`ν) in association with two jets (jj) includes production via vector boson fusion (VBF). This process has a distinctive signature of two jets with large energy and sep-aration in pseudorapidity (η), produced in association with a lepton-neutrino pair. This EW process is referred to as EW Wjj, and the two jets produced through the fragmentation of the outgoing quarks are referred to as “tagging jets”.
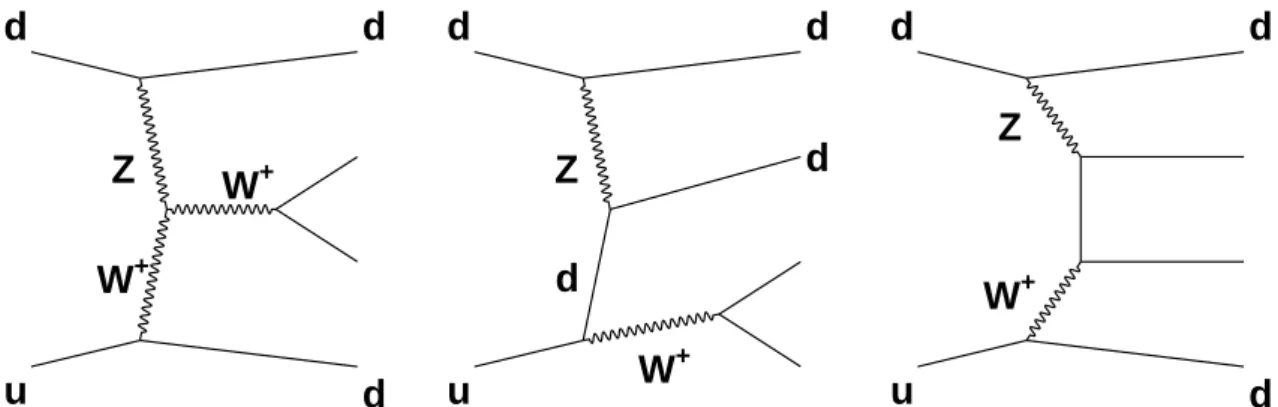
Figure 1 shows representative Feynman diagrams for the EW Wjj signal processes, namely VBF (Fig. 1, left), bremsstrahlung-like (Fig. 1, center), and multiperipheral (Fig. 1, right) production. Gauge cancellations lead to a large negative interference between the VBF diagram and the other two diagrams, with the larger interference coming from bremsstrahlung-like production. Interference with multiperipheral production is limited to cases where the lepton-neutrino pair mass is close to the W boson mass.
u
d
+W
Z
+W
d
d
u
d
d
Z
+W
d
d
u
d
+W
Z
d
d
Figure 1: Representative Feynman diagrams for lepton-neutrino production in association with two jets from purely electroweak amplitudes: vector boson fusion (left), bremsstrahlung-like (center), and multiperipheral (right) production.
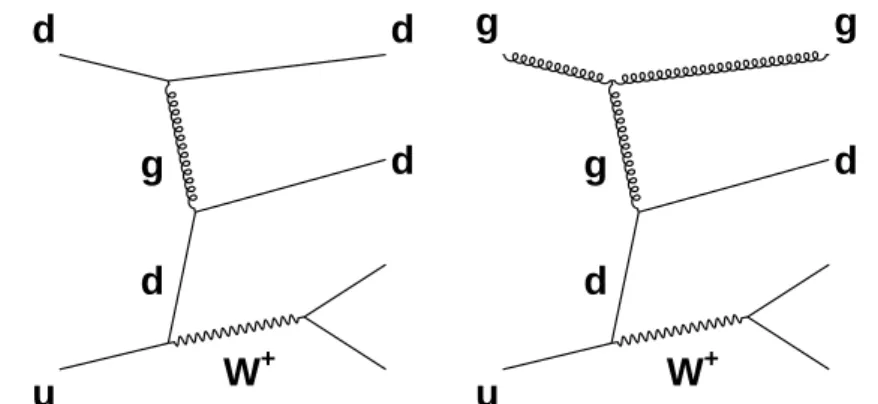
In addition to the purely EW signal diagrams described above, there are other, not purely EW processes, that lead to the same`νjj final states and can interfere with the signal diagrams in Fig. 1. This interference effect between the signal production and the main Drell-Yan (DY) background processes (DY Wjj) is small compared to the interference effects among the EW production amplitudes, but needs to be included when measuring the signal contribution. Fig-ure 2 (left) shows one example of W boson production in association with two jets that has the same initial and final states as those in Fig. 1. A process that does not interfere with the EW signal is shown in Fig. 2 (right).
The study of EW Wjj processes is part of a more general investigation of standard model (SM) VBF and scattering processes that includes the measurements of EW Zjj processes, Higgs boson production [1–3], and searches for physics beyond the SM [4]. The properties of EW Wjj events that are isolated from the backgrounds can be compared with SM predictions. Probing the additional hadronic activity in selected events can shed light on the modeling of the additional parton radiation [5, 6], which is important for signal selection and the vetoing of background events.
Higher-dimensional operators outside the SM can generate anomalous trilinear gauge cou-plings (ATGCs) [7, 8], so the measurement of the coupling strengths provides an indirect search for beyond-the-SM physics at mass scales not directly accessible at the LHC.
col-u
d
d
g
+W
d
d
u
g
d
g
+W
d
g
Figure 2: Representative diagrams for W boson production in association with two jets (DY Wjj) that constitute the main background for the measurement.
lisions at √s = 8 TeV [9] and then by the ATLAS Collaboration at both √s = 8 TeV and
√
s = 7 TeV [10]. The closely related EW Zjj process was first measured during Run 1 by the CMS Collaboration using pp collisions at√s= 7 TeV [11], and then at√s =8 TeV by both the CMS [12] and ATLAS [13] Collaborations. The EW Zjj measurements using data samples of pp collisions at√s = 13 TeV have been performed by ATLAS [14] and by CMS [15]. Considering leptonic final states in the same kinematic region the EW Wjj cross section is about a factor 10 larger than the EW Zjj cross section. All results so far agree with the expectations of the SM within a precision of 10–20%.
This paper presents measurements of the EW Wjj process with the CMS detector using pp collisions collected at √s =13 TeV during 2016, corresponding to an integrated luminosity of 35.9 fb−1. A multivariate analysis (BDT), based on the methods developed for the EW Zjj mea-surement [11, 12], is used to separate signal events from the large W +jets background. The analysis of the 13 TeV data offers the opportunity to measure the cross section at a higher energy than previously done and to reduce the uncertainties obtained with previous measurements, given both the larger integrated luminosity and the larger predicted total cross section.
This paper is organized as follows: Section 2 describes the experimental apparatus and Sec-tion 3 the event simulaSec-tions. Event selecSec-tion procedures are described in SecSec-tion 4, together with the selection efficiencies and background estimations using control regions (CRs). Sec-tion 5 describes an estimaSec-tion of the multijet background from quantum chromodynamics (QCD), based on CRs in data. Section 6 discusses a correction applied to the simulation as a function of the invariant mass mjj. Section 7 presents distributions of the main discriminating variables in data. Section 8 details the strategy adopted to extract the signal from the data, and the corresponding systematic uncertainties are summarized in Section 9. The cross section and anomalous coupling results are presented in Sections 10 and 11, respectively. Section 12 presents a study of the additional hadronic activity in an EW Wjj enriched region. Finally, a brief summary of the results is given in Section 13.
2
The CMS detector and physics objects
The central feature of the CMS apparatus is a superconducting solenoid of 6 m internal diame-ter, providing a magnetic field of 3.8 T. Within the solenoid volume are a silicon pixel and strip tracker, a lead tungstate crystal electromagnetic calorimeter (ECAL), and a brass and scintilla-tor hadron calorimeter, each composed of a barrel and two endcap sections. Forward calorime-ters extend the η coverage provided by the barrel and endcap detectors to |η|= 5.2. Muons
3
are measured in gas-ionization detectors embedded in the steel flux-return yoke outside the solenoid.
The tracker measures charged particles within the range|η| <2.5. It consists of 1440 pixel and 15 148 strip detector modules. For nonisolated particles with transverse momenta 1 < pT <
10 GeV and|η| < 1.4, the track resolutions are typically 1.5% in pT and 25–90 (45–150) µm in the transverse (longitudinal) impact parameter [16].
The energy of electrons is measured after combining the information from the ECAL and the tracker, whereas their direction is measured by the tracker. The momentum resolution for electrons with pT ≈ 45 GeV from Z → ee decays ranges from 1.7% to 4.5%. It is generally better in the barrel region than in the endcaps, and also depends on the bremsstrahlung energy emitted by the electron as it traverses the material in front of the ECAL [17].
Muons are measured in the range|η| <2.4, with detection planes made using three technolo-gies: drift tubes, cathode strip chambers, and resistive-plate chambers. Matching muons to tracks measured in the silicon tracker results in a relative transverse momentum resolution for muons with 20 < pT < 100 GeV of 1.3–2.0% in the barrel and better than 6% in the endcaps. The pTresolution in the barrel is better than 10% for muons with pTup to 1 TeV [18].
Events of interest are selected using a two-tiered trigger system [19]. The first level (L1), com-posed of custom hardware processors, uses information from the calorimeters and muon de-tectors to select events at a rate of around 100 kHz within a time interval of less than 4 µs. The second level, known as the high-level trigger (HLT), consists of a farm of processors running a version of the full-event reconstruction software optimized for fast processing, and reduces the event rate to around 1 kHz before data storage.
A more detailed description of the CMS detector, together with a definition of the coordinate system used and the relevant kinematic variables, can be found in Ref. [20].
3
Simulation of signal and background events
Signal events are simulated at leading order (LO) using the MADGRAPH5 aMC@NLO(v2.3.3)
Monte Carlo (MC) generator [21], interfaced withPYTHIA (v8.212) [22] for parton showering
(PS) and hadronization. The NNPDF30 [23] parton distribution functions (PDFs) are used to generate the events. The underlying event is modeled using the CUETP8M1 tune [24]. The sim-ulation does not include extra partons at matrix element (ME) level. The signal is defined in the kinematic region with parton transverse momentum pTj >25 GeV, and diparton invariant mass mjj > 120 GeV. The simulated cross section for the`νjj final state (with`= e, µ or τ), ap-plying the above requirements, is σLO(EW`νjj) =6.81+−0.030.06(scale)±0.26 (PDFs) pb, where the first uncertainty is obtained by changing simultaneously the factorization (µF) and renormal-ization (µR) scales by factors of 2 and 1/2, and the second one reflects the uncertainties in the NNPDF30 PDFs. The LO signal cross section and relevant kinematic distributions estimated with MADGRAPH5 aMC@NLO are in agreement within 2–5% with the next-to-leading-order (NLO) predictions of theVBFNLOgenerator (v2.6.3) [25–27], which include QCD NLO correc-tions to the LO ME-level diagrams evaluated with MADGRAPH5 aMC@NLO. For additional
comparisons, signal events produced with MADGRAPH5 aMC@NLO are also processed with
theHERWIG++ (v2.7.1) [28] PS, using the EE5C [29] tune.
An additional signal sample that includes NLO QCD corrections but does not include the s-channel contributions to the final state has been generated withPOWHEG(v2.0) [30–32], based on theVBFNLOME calculations [33, 34]. In thePOWHEGsample the mjj>120 GeV condition is
applied on the two pT-leading parton-level jets, after clustering the ME final state partons with the kT-algorithm [35–37], with a distance parameter D=0.8, as done in Ref. [33]. ThePOWHEG
sample has also been processed alternatively with PYTHIAand HERWIG++ parton showering
(PS) and hadronization programs, as done for the MADGRAPH5 aMC@NLO samples. In the
following, results obtained with thePOWHEGsignal samples are given as a cross check of the main results obtained with the MADGRAPH5 aMC@NLOsignal samples.
Events coming from processes including ATGCs are generated with the same settings as the SM sample, but include additional information for reweighting in the three-dimensional effec-tive field theory (EFT) parameter space, which is described in more detail in Section 11. The ’EWdim6NLO’ model [8, 21] is used for the generation of anomalous couplings.
Background W boson events are also simulated with MADGRAPH5 aMC@NLO using (i) an NLO ME calculation with up to three final-state partons generated from QCD interactions, and (ii) an LO ME calculation with up to four partons from QCD interactions. The ME-PS matching is performed following the FxFx prescription [38] for the NLO case, and the MLM prescrip-tion [39, 40] for the LO case. The NLO background simulaprescrip-tion is used to extract the final results, while the independent LO samples are used to perform the multivariate discriminant training. The inclusive W boson production is normalized to σth(W) = 61.5 nb, as computed at next-to-next-to-leading order (NNLO) withFEWZ(v3.1) [41].
The evaluation of the interference between EW Wjj and DY Wjj processes relies on the pre-dictions obtained with MADGRAPH5 aMC@NLO. A dedicated sample of events arising from the interference terms is generated directly by selecting the contributions of order αsα3EW, and passed through the full detector simulation to estimate the expected interference contribution. Other backgrounds are expected from events with one electron or muon and missing transverse momentum together with jets in the final state. Events from top quark pair production are generated withPOWHEG(v2.0) [30–32], and normalized to the inclusive cross section calculated at NNLO, including next-to-next-to-leading logarithmic corrections, of 832 pb [42, 43]. Single top quark processes are modeled at NLO with POWHEG [30–32, 44] and normalized to cross sections of 71.7±2.0 pb, 217±3 pb, and 10.32±0.20 pb, respectively, for the tW (POWHEG
v1) [45], t-, and s-channel production [42, 46]. The diboson (VV) production processes (WW, WZ, and ZZ) are generated withPYTHIAand normalized to NNLO cross section computations
obtained withMCFM(v8.0) [47].
The contribution from QCD multijet processes is derived via an extrapolation from a QCD data CR with the lepton relative isolation selection inverted. All background simulations make use of thePYTHIAPS model with the CUETP8M1 tune.
A detector simulation based on GEANT4 (v9.4p03) [48, 49] is applied to all the generated signal and background samples. The presence of multiple pp interactions is incorporated by simu-lating additional interactions (pileup), both in-time and out-of-time with respect to the hard interaction, with a multiplicity that matches the distribution observed in data. The average pileup is measured to be about 23 additional interactions per bunch crossing.
4
Reconstruction and selection of events
Events containing exactly one isolated, high-pTlepton and at least two high-pTjets are selected. Isolated single-lepton triggers are used to acquire the data, where the lepton is required to have pT >27 GeV for the electron trigger and pT >24 GeV for the muon trigger.
5
The offline analysis uses candidates reconstructed by the particle-flow (PF) algorithm [50]. In the PF event reconstruction, all stable particles in the event — i.e., electrons, muons, photons, charged and neutral hadrons — are reconstructed as PF candidates using information from all subdetectors to obtain an optimal determination of their direction, energy, and type. The PF candidates are used to reconstruct the jets and the missing transverse momentum.
The reconstructed primary vertex (PV) with the largest value of summed physics-object p2T is the primary pp interaction vertex. The physics objects are the objects returned by a jet find-ing algorithm [51, 52] applied to all charged particle tracks associated with the vertex, along with the corresponding associated missing transverse momentum. Charged tracks identified as hadrons from pileup vertices are omitted in the subsequent PF event reconstruction [50]. Offline electrons are reconstructed from clusters of energy deposits in the ECAL that match tracks extrapolated from the silicon tracker [17]. Offline muons are reconstructed by fitting trajectories based on hits in the silicon tracker and in the muon system [53]. Reconstructed electron or muon candidates are required to have pT > 20 GeV. Electron candidates are re-quired to be reconstructed within|η| ≤2.4, excluding the barrel-to-endcap transitional region 1.444 < |η| < 1.566 of the ECAL [20]. Muon candidates are required to be reconstructed in the fiducial region|η| ≤ 2.4. The track associated with a lepton candidate is required to have both its transverse and longitudinal impact parameters compatible with the position of the PV of the event.
The leptons are required to be isolated; the isolation (I) variable is calculated from PF candi-dates and is corrected for pileup on an event-by-event basis [54]. The scalar pT sum of all PF candidates reconstructed in an isolation cone with radius∆R=
√
(∆η)2+ (∆φ)2=0.4 around the lepton’s momentum vector, excluding the lepton itself, is required to be less than 6% of the electron or muon pT value. For additional offline analysis, the isolated lepton is required to have pT >25 GeV for the muon channel and pT>30 GeV for the electron channel. Events with more than one lepton satisfying the above requirements are rejected. The lepton flavor samples are exclusive and precedence is given to the selection of muons.
The missing transverse momentum vector,~pmissT , is calculated offline as the negative of the vec-tor sum of transverse momenta of all PF objects identified in the event [55], and the magnitude of this vector is denoted pmissT . Events are required to have pmissT in excess of 20 GeV in the muon channel and 40 GeV in the electron channel. The tighter requirement for the electron channel re-duces the corresponding higher background of QCD multijet events. The transverse mass (mT) of the lepton and~pmiss
T four-vector sum is then required to exceed 40 GeV in both channels. Jets are reconstructed by clustering PF candidates with the anti-kT algorithm [51, 56] using a distance parameter of 0.4. The jet momentum is the vector sum of all particle momenta in the jet and is typically within 5 to 10% of the true momentum over the whole pT spectrum and detector acceptance.
An offset correction is applied to jet energies because of the contribution from pileup. Jet en-ergy corrections are derived from simulation, and are confirmed with in situ measurements of the energy balance in dijet, multijet, photon+jet, and Z+jets events with leptonic Z boson decays [57]. Loose jet identification criteria are applied to reject misreconstructed jets resulting from detector noise [58]. Loose criteria are also applied to remove jets heavily contaminated with pileup energy (clustering of energy deposits not associated with a parton from the pri-mary pp interaction) [58, 59]. The efficiency of the jet identification is greater than 99%, with a rejection of 90% of background pileup jets with pT ' 50 GeV and |η| ≤ 2.5. For jets with
rejec-tion is approximately 50%. The jet energy resolurejec-tion (JER) is typically≈15% at 10 GeV, 8% at 100 GeV, and 4% at 1 TeV for jets with|η| ≤ 1 [57]. Jets reconstructed with pT ≥ 15 GeV and
|η| ≤4.7 are used in the analysis.
The two highest pT jets are defined as the tagging jets, and are required to have pT > 50 GeV and pT >30 GeV for the leading and subleading (in pT) jet, respectively. The invariant mass of the two tagging jets is required to satisfy mjj>200 GeV.
The transverse momentum of the W boson (~pTW) is evaluated as the vector sum of the lepton pT and~pmissT . The event pTbalance (R(pT)) is then defined as
R(pT) = |~pTj1+ ~pTj2+ ~pTW|
|~pTj1| + |~pTj2| + |~pTW| (1)
where~pTj1 and~pTj2 are the transverse momenta of the two tagging jets.
Finally, events are required to have R(pT) < 0.2. This has a negligible effect on the analysis sensitivity and allows the definition of a nonoverlapping control sample with R(pT) > 0.2 that is used to derive a correction to the invariant mass based on a CR in data, as described in Section 6.
A multivariate analysis technique, described in Section 8, is used to provide an optimal sepa-ration of the DY Wjj and EW Wjj components of the inclusive`νjj spectrum. The main discrim-inating variables are the dijet invariant mass mjjand pseudorapidity separation∆ηjj.
Angular variables useful for signal discrimination include the y∗ Zeppenfeld variable [6], de-fined as the difference between the rapidity of the W boson yWand the average rapidity of the two tagging jets, i.e.,
y∗ =yW−1
2(yj1 +yj2), (2)
and the z∗ Zeppenfeld variable [6] defined as z∗ = y
∗ ∆yjj
, (3)
where∆yjjis the dijet rapidity separation.
Table 1 reports the expected and observed event yields after the initial selection and after im-posing a minimum value for the final multivariate discriminant output applied to define the signal-enriched region used for the studies of additional hadronic activity described in Sec-tion 12.
4.1 Discriminating quarks from gluons
Jets in signal events are expected to originate from quarks, whereas for background events it is more probable that jets are initiated by a gluon. A quark-gluon likelihood (QGL) discrim-inant [11] is evaluated for the two tagging jets with the intent of distinguishing the nature of each jet.
The QGL discriminant exploits differences in the showering and fragmentation of quarks and gluons, making use of the following internal jet composition observables: (i) the particle multi-plicity of the jet, (ii) the minor root-mean-square of distance between the jet constituents in the η–φ plane, and (iii) the pT distribution function of the jet constituents, as defined in Ref. [60].
7
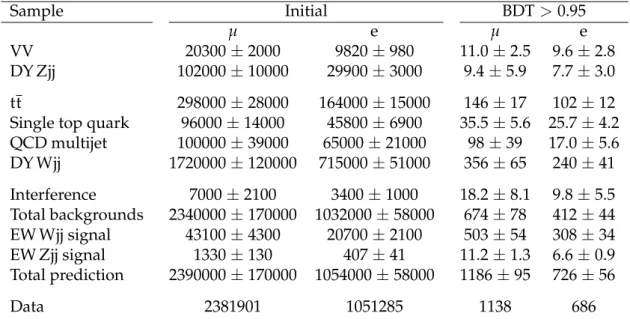
Table 1: Event yields expected for background and signal processes using the initial selections and with a selection on the multivariate analysis output (BDT) that provides similar signal and background yields. The yields are compared to the data observed in the different channels and categories. The total uncertainties quoted for signal, DY Wjj and diboson backgrounds, and processes with top quarks (tt and single top quarks) include the systematic uncertainties.
Sample Initial BDT>0.95
µ e µ e
VV 20300±2000 9820±980 11.0±2.5 9.6±2.8
DY Zjj 102000±10000 29900±3000 9.4±5.9 7.7±3.0
tt 298000±28000 164000±15000 146±17 102±12
Single top quark 96000±14000 45800±6900 35.5±5.6 25.7±4.2
QCD multijet 100000±39000 65000±21000 98±39 17.0±5.6 DY Wjj 1720000±120000 715000±51000 356±65 240±41 Interference 7000±2100 3400±1000 18.2±8.1 9.8±5.5 Total backgrounds 2340000±170000 1032000±58000 674±78 412±44 EW Wjj signal 43100±4300 20700±2100 503±54 308±34 EW Zjj signal 1330±130 407±41 11.2±1.3 6.6±0.9 Total prediction 2390000±170000 1054000±58000 1186±95 726±56 Data 2381901 1051285 1138 686
The variables are used as inputs to a likelihood discriminant on gluon and quark jets con-structed from simulated dijet events. The performance of the QGL discriminant is evaluated and validated using independent, exclusive samples of Z +jet and dijet data [60]. Corrections to the simulated QGL distributions and related systematic uncertainties are derived from a comparison of simulation and data distributions.
5
The QCD multijet background
The QCD multijet contribution is estimated by defining a multijet-enriched CR with inverted lepton isolation criteria for both the muon and electron channels. In the nominal selection both lepton types are required to pass the relative isolation requirement I < 0.06, whereas the multijet-enriched CRs are defined with the same event selection but with isolation require-ments 0.06< I <0.12 and 0.06< I <0.15, for the muon and electron channel respectively. It is then assumed that the pmissT distribution of QCD events has the same shape in both the nominal and the multijet-enriched CR.
The various components, with floating W +jets and QCD multijet background scale factors, are simultaneously fitted to the pmissT data distributions, independently in the muon and electron channels, and the expected QCD multijet yields in the nominal regions are derived.
The contribution of QCD multijet processes in any other observable (x) used in the analysis is then normalized to the yields obtained above from the fit to the pmissT distribution, and the shape for the distribution x is taken as the difference between data and all simulated background contributions in the x distribution in the multijet-enriched CR.
The estimation of the QCD multijet contribution based on a CR in data is validated by checking the modeling of other variables that discriminate QCD multijets from W +jets such as the W transverse mass and the minimum difference in φ between the missing transerse energy and the jets. Good agreement with the data is observed in all distributions. The stability of the W
+jets fitted normalization is checked by varying the selection requirements for the fitted region and repeating the QCD extraction fit. The observed variations in fitted normalization when varying the mT(W) and pmissT selection requirements with respect to the fit region definition are much smaller than systematic uncertainties.
Although b tagging is not used in this analysis, a b-tagging discriminant output [61] is used to check the fitted W +jets background normalization as well as the tt normalization from simulation, and they agree with data within the uncertainties. Finally, the selections on mjj, pmissT , and mT(W) are also loosened in order to verify that the W +jets background scale factor is not biased by these requirements.
6
The
m
jjcorrection
A systematic overestimation of the simulation yields is caused by a partial mistiming of the signals in the forward region of the ECAL endcaps (2.5 < |η| < 3.0). This effect, which in-creases with increasing mjj, is observed in both electron and muon channels. A correction for this effect is derived in the nonoverlapping signal-depleted CR obtained by requiring that the event transverse momentum balance R(pT), defined in Section 4, exceeds 0.2.
A third-order polynomial correction is first applied to the W +jets simulation separately in the muon and electron channels in order to match the R(pT)distribution in data. The magnitude of the applied R(pT)corrections is about 10%. The uncertainty in this correction due to the limited statistical precision of the simulation as well as data is propagated to the fitted W +jets templates.
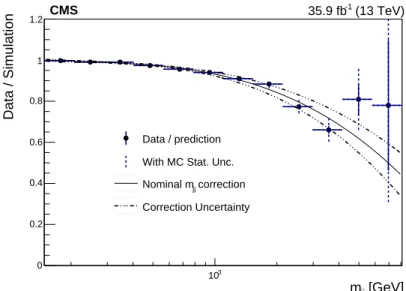
A correction to the mjjprediction from simulation is derived in the signal-depleted R(pT) >0.2 CR via a third-order polynomial fit to the ratio of data to the overall prediction from simulation for signal and background as a function of ln(mjj/ GeV). The electron and muon channels are combined when deriving the mjj correction. The uncertainty in the correction includes the data statistical component as well as the systematic uncertainty due to the limited statistical precision of the simulation.
Figure 3 shows the fitted correction including the uncertainty. This correction is applied to all simulated results, including the signal, and the corresponding uncertainty is propagated to the signal extraction fits.
7
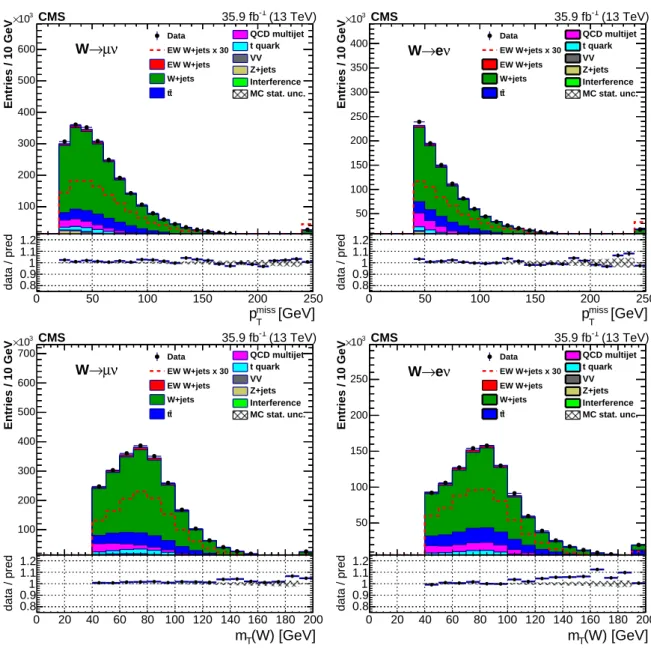
Distributions of discriminating variables
Figure 4 shows the pmissT and mT(W) distributions after the event preselection. The dijet invari-ant mass and pseudorapidity difference (∆ηjj) after preselection are presented in Fig. 5, and Fig. 6 shows the y? and z? distributions after the event preselection. The distributions of the QGL likelihood output values in data and simulation for the two tagging jets are shown in Fig. 7. The prediction from simulated events and the data agree within total uncertainties for all discriminating variables.
8
Signal discriminants and extraction procedure
The EW Wjj signal is characterized by a large pseudorapidity separation between the tagging jets, due to the small-angle scattering of the two initial partons. Because of both the topological configuration and the large energy of the outgoing partons, mjjis also expected to be large, and
9 [GeV] jj m 3 10 Data / Simulation 0 0.2 0.4 0.6 0.8 1 1.2 Data / prediction With MC Stat. Unc.
correction
jj
Nominal m
Correction Uncertainty
CMS 35.9 fb-1 (13 TeV)
Figure 3: Data divided by simulation as a function of ln(mjj/ GeV)in a signal-depleted control sample with R(pT) > 0.2. This distribution is fit by a third-order polynomial (solid black line) in order to derive a correction on the simulation mjjprediction. The points are varied by the uncertainty, including the effect of the limited number of simulated events and refitted in order to derive the systematic variations on the correction (dashed lines) corresponding to a standard deviation (s.d.).
can be used to distinguish the EW Wjj and DY Wjj processes. The correlation between∆ηjjand mjjis expected to be different in signal and background events, therefore these characteristics are expected to yield a high separation power between EW Wjj and DY Wjj production. In addition, in signal events it is expected that the W boson candidate is produced centrally in the rapidity region defined by the two tagging jets. As a consequence, signal events are expected to yield lower values of z∗ compared to the DY background. Other variables that are used to enhance the signal-to-background separation are related to the kinematics of the event or to the properties of the jets that are expected to be initiated by quarks. The variables that are used in the multivariate analysis are: (i) mjj, (ii)∆ηjj, (iii) z∗, and (iv) the QGL values of the two tagging jets.
The output is built by training a boosted decision tree (BDT) discriminator with the TMVA
package [62] to achieve an optimal separation between the EW Wjj and DY Wjj processes. The simulated events that are used for the BDT training are not used for the signal extraction. To improve the sensitivity for the extraction of the signal component, the transformation that originally projects the BDT output value in the [−1,+1] interval is changed to BDT0 =tanh−1((BDT+
1)/2). This allows the purest signal region of the BDT output to be better sampled while keep-ing an equal-width binnkeep-ing of the BDT variable.
Figure 8 shows the distributions of the discriminants for the two leptonic channels. Good overall agreement between simulation and data is observed in all distributions, and the signal presence is visible at high BDT’ values.
A binned maximum likelihood is built from the expected rates for each process, as a function of the value of the discriminant, which is fit to extract the strength modifiers for the EW Wjj and DY Wjj processes, µ = σ(EW Wjj)/σLO(EW`νjj) and υ = σ(W)/σNNLO(W). Nuisance parameters are added to modify the expected rates and shapes according to the estimate of the systematic uncertainties affecting the measurement.
0 50 100 150 200 250 100 200 300 400 500 600 3 10 × Data EW W+jets x 30 EW W+jets W+jets t t QCD multijet t quark VV Z+jets Interference MC stat. unc. CMS 35.9 fb-1 (13 TeV) Entries / 10 GeV ν µ → W 0 50 100 150 200 250 50 100 150 200 250 300 350 400 3 10 × Data EW W+jets x 30 EW W+jets W+jets t t QCD multijet t quark VV Z+jets Interference MC stat. unc. CMS 35.9 fb-1 (13 TeV) Entries / 10 GeV ν e → W [GeV] miss T p 0 50 100 150 200 250 data / pred. 0.8 0.91 1.1 1.2 [GeV] miss T p 0 50 100 150 200 250 data / pred. 0.8 0.91 1.1 1.2 0 20 40 60 80 100 120 140 160 180 200 100 200 300 400 500 600 700 3 10 × Data EW W+jets x 30 EW W+jets W+jets t t QCD multijet t quark VV Z+jets Interference MC stat. unc. CMS 35.9 fb-1 (13 TeV) Entries / 10 GeV ν µ → W 0 20 40 60 80 100 120 140 160 180 200 50 100 150 200 250 3 10 × Data EW W+jets x 30 EW W+jets W+jets t t QCD multijet t quark VV Z+jets Interference MC stat. unc. CMS 35.9 fb-1 (13 TeV) Entries / 10 GeV ν e → W (W) [GeV] T m 0 20 40 60 80 100 120 140 160 180 200 data / pred. 0.8 0.91 1.1 1.2 (W) [GeV] T m 0 20 40 60 80 100 120 140 160 180 200 data / pred. 0.8 0.91 1.1 1.2
Figure 4: Distribution of the missing transverse momentum (upper) and the lepton-pmissT system transverse mass (lower) after the event preselection for the selected leading lepton in the event, in the muon (left) and electron (right) channels. In all plots the last bin contains overflow events.
The interference between the EW Wjj and DY Wjj processes is included in the fit procedure, and its strength scales as√µυ. The interference model is derived from the MADGRAPH5 aMC@NLO
simulation described in Section 3.
The parameters of the model (µ and υ) are determined by maximizing the likelihood. The statistical methodology follows the one used in other analyses [63] using asymptotic formu-las [64]. In this procedure the systematic uncertainties affecting the measurement of the signal and background strengths (µ and υ) are constrained with log-normal probability distributions.
9
Systematic uncertainties
The main systematic uncertainties affecting the measurement are classified into experimen-tal and theoretical according to their sources. Some uncertainties affect only normalizations,
9.1 Experimental uncertainties 11 0 200 400 600 800 1000 1200 1400 1600 1800 2000 10 2 10 3 10 4 10 5 10 6 10 7 10 8 10 9 10 10 10 Data EW W+jets x 30 EW W+jets W+jets t t QCD multijet t quark VV Z+jets Interference MC stat. unc. CMS 35.9 fb-1 (13 TeV) Entries / 100 GeV ν µ → W 0 200 400 600 800 1000 1200 1400 1600 1800 2000 10 2 10 3 10 4 10 5 10 6 10 7 10 8 10 9 10 Data EW W+jets x 30 EW W+jets W+jets t t QCD multijet t quark VV Z+jets Interference MC stat. unc. CMS 35.9 fb-1 (13 TeV) Entries / 100 GeV ν e → W [GeV] jj m 0 200 400 600 800 100012001400160018002000 data / pred. 0.8 0.91 1.1 1.2 [GeV] jj m 0 200 400 600 800 100012001400160018002000 data / pred. 0.8 0.91 1.1 1.2 0 1 2 3 4 5 6 7 8 9 10 2 10 3 10 4 10 5 10 6 10 7 10 8 10 9 10 Data EW W+jets x 30 EW W+jets W+jets t t QCD multijet t quark VV Z+jets Interference MC stat. unc. CMS 35.9 fb-1 (13 TeV) Entries / 0.5 ν µ → W 0 1 2 3 4 5 6 7 8 9 10 2 10 3 10 4 10 5 10 6 10 7 10 8 10 Data EW W+jets x 30 EW W+jets W+jets t t QCD multijet t quark VV Z+jets Interference MC stat. unc. CMS 35.9 fb-1 (13 TeV) Entries / 0.5 GeV ν e → W (jj) η ∆ 0 1 2 3 4 5 6 7 8 9 data / pred. 0.5 1 1.5 (jj) η ∆ 0 1 2 3 4 5 6 7 8 9 data / pred. 0.5 1 1.5
Figure 5: Dijet invariant mass (upper) and pseudorapidity difference (lower) distributions after the event preselection, in the muon (left) and electron (right) channels. In all plots the last bin contains overflow events.
whereas others affect both the normalization and shape of the BDT output distribution.
9.1 Experimental uncertainties
The following experimental uncertainties are considered.
Integrated luminosity. A 2.5% uncertainty is assigned to the value of the integrated
luminos-ity [65].
Trigger and selection efficiencies. Uncertainties in the efficiency corrections based on control
samples in data for the leptonic trigger and offline selections are included and amount to a total of 2–3% depending on the lepton pT and η, for both the e and µ channels. These uncertainties are estimated by comparing the lepton efficiencies expected in simulation and measured in data with a “tag-and-probe” method [66].
-5 -4 -3 -2 -1 0 1 2 3 4 5 100 200 300 400 500 3 10 × Data EW W+jets x 30 EW W+jets W+jets t t QCD multijet t quark VV Z+jets Interference MC stat. unc. CMS 35.9 fb-1 (13 TeV) Entries / 0.5 ν µ → W -5 -4 -3 -2 -1 0 1 2 3 4 5 50 100 150 200 250 3 10 × Data EW W+jets x 30 EW W+jets W+jets t t QCD multijet t quark VV Z+jets Interference MC stat. unc. CMS 35.9 fb-1 (13 TeV) Entries / 0.5 ν e → W y*(W) -5 -4 -3 -2 -1 0 1 2 3 4 5 data / pred. 0.8 0.91 1.1 1.2 y*(W) -5 -4 -3 -2 -1 0 1 2 3 4 5 data / pred. 0.8 0.91 1.1 1.2 0 0.5 1 1.5 2 2.5 3 100 200 300 400 500 600 700 800 900 3 10 × Data EW W+jets x 30 EW W+jets W+jets t t QCD multijet t quark VV Z+jets Interference MC stat. unc. CMS 35.9 fb-1 (13 TeV) Entries / 0.2 ν µ → W 0 0.5 1 1.5 2 2.5 3 50 100 150 200 250 300 350 400 450 3 10 × Data EW W+jets x 30 EW W+jets W+jets t t QCD multijet t quark VV Z+jets Interference MC stat. unc. CMS 35.9 fb-1 (13 TeV) Entries / 0.2 ν e → W z*(W) 0 0.5 1 1.5 2 2.5 3 data / pred. 0.8 0.91 1.1 1.2 z*(W) 0 0.5 1 1.5 2 2.5 3 data / pred. 0.8 0.91 1.1 1.2
Figure 6: Distributions of the “Zeppenfeld” variables y?(W) (upper) and z?(W) (lower) after event preselection in the muon (left) and electron (right) channels. In all plots the first and last bins contain overflow events.
Jet energy scale and resolution. The uncertainty in the energy of the jets affects the event
se-lection and the computation of the kinematic variables used to calculate the discrimi-nants. Therefore, the uncertainty in the jet energy scale (JES) affects both the expected event yields and the final shapes. The effect of the JES uncertainty is studied by rescaling up and down the reconstructed jet energy by pT- and η-dependent scale factors [57]. An analogous approach is used for the JER.
QGL discriminator. The uncertainty in the performance of the QGL discriminator is measured
using independent Z +jet and dijet data, after comparing with the corresponding simula-tion predicsimula-tions [60]. Shape variasimula-tions corresponding to the full differences between the data and the simulation are used as estimates of the uncertainty.
Pileup. Pileup can affect the identification and isolation of the leptons or the corrected energy
9.1 Experimental uncertainties 13 0 0.1 0.2 0.3 0.4 0.5 0.6 0.7 0.8 0.9 1 200 400 600 800 1000 3 10 × Data EW W+jets x 30 EW W+jets W+jets t t QCD multijet t quark VV Z+jets Interference MC stat. unc. CMS 35.9 fb-1 (13 TeV) Entries / 0.05 ν µ → W 0 0.1 0.2 0.3 0.4 0.5 0.6 0.7 0.8 0.9 1 100 200 300 400 500 3 10 × Data EW W+jets x 30 EW W+jets W+jets t t QCD multijet t quark VV Z+jets Interference MC stat. unc. CMS 35.9 fb-1 (13 TeV) Entries / 0.05 ν e → W Leading jet QGL 0 0.1 0.2 0.3 0.4 0.5 0.6 0.7 0.8 0.9 1 data / pred. 0.8 0.91 1.1 1.2 Leading jet QGL 0 0.1 0.2 0.3 0.4 0.5 0.6 0.7 0.8 0.9 1 data / pred. 0.8 0.91 1.1 1.2 0 0.1 0.2 0.3 0.4 0.5 0.6 0.7 0.8 0.9 1 100 200 300 400 500 600 700 3 10 × Data EW W+jets x 30 EW W+jets W+jets t t QCD multijet t quark VV Z+jets Interference MC stat. unc. CMS 35.9 fb-1 (13 TeV) Entries / 0.05 ν µ → W 0 0.1 0.2 0.3 0.4 0.5 0.6 0.7 0.8 0.9 1 50 100 150 200 250 300 350 3 10 × Data EW W+jets x 30 EW W+jets W+jets t t QCD multijet t quark VV Z+jets Interference MC stat. unc. CMS 35.9 fb-1 (13 TeV) Entries / 0.05 ν e → W Subleading jet QGL 0 0.1 0.2 0.3 0.4 0.5 0.6 0.7 0.8 0.9 1 data / pred. 0.8 0.91 1.1 1.2 Subleading jet QGL 0 0.1 0.2 0.3 0.4 0.5 0.6 0.7 0.8 0.9 1 data / pred. 0.8 0.91 1.1 1.2
Figure 7: The QGL output for the leading (upper) and subleading (lower) quark jet candidates in the preselected muon (left) and electron (right) samples.
dijet system because of the contamination of tracks and calorimetric deposits. This un-certainty is evaluated by generating alternative distributions of the number of pileup interactions, corresponding to a 4.6% uncertainty in the total inelastic pp cross section at
√
s=13 TeV [67].
Limited number of simulated events. For each signal and background simulation, shape
vari-ations for the distributions are considered by shifting the content of each bin up or down by its statistical uncertainty [68]. This generates alternatives to the nominal shape that are used to describe the uncertainty from the limited number of simulated events.
mjjcorrection. As described in Section 6, the mjj prediction from simulation is corrected to
match the distribution in data in a signal-depleted R(pT) > 0.2 control region. The un-certainty in this correction is derived by varying the fitted points within the statistical uncertainty from data and simulation combined and refitting the correction.
Entries / 0.1 -1 10 1 10 2 10 3 10 4 10 5 10 6 10 7 10 8 10 Data EW W+jets W+jets t t t quark QCD multijet VV Z+jets Interference CMS 35.9 fb-1 (13 TeV) BDT' 0 0.5 1 1.5 2 2.5 (data / pred.) - 1-0.2 -0.1 0 0.1 0.2
0.3 Jet energy scale unc. Quark-gluon likelihood reweighting unc.
F µ QCD scale: R µ QCD scale: correction unc. jj m Entries / 0.1 -1 10 1 10 2 10 3 10 4 10 5 10 6 10 7 10 Data EW W+jets W+jets t t t quark QCD multijet VV Z+jets Interference CMS 35.9 fb-1 (13 TeV) BDT' 0 0.5 1 1.5 2 2.5 (data / pred.) - 1-0.2 -0.1 0 0.1 0.2
0.3 Jet energy scale unc. Quark-gluon likelihood reweighting unc.
F µ QCD scale: R µ QCD scale: correction unc. jj m
Figure 8: Data and MC simulation BDT’ output distributions for the muon (left) and electron (right) channels, using the BDT output transformed with the tanh−1 function to enhance the purest signal region. The ratio panel shows the statistical uncertainty from the simulation as well as the independent systematic uncertainties front the leading sources.
extrapolated from the data in a nonoverlapping CR. The uncertainty in the QCD multijet background template shape is derived by taking the envelope of the shape obtained when varying the lepton isolation requirement used to define the multijet-enriched CR. A 50% uncertainty in the QCD multijet background normalization is also included.
9.2 Theoretical uncertainties
The following theoretical uncertainties are considered in the analysis.
PDF. The PDF uncertainties are evaluated by comparing the nominal distributions to those obtained when using the alternative PDFs of the NNPDF set, including αsvariations.
Factorization and renormalization scales. To account for theoretical uncertainties, signal and
background shape variations are built by changing the values of µF and µR from their defaults by factors of 2 or 1/2 in the ME calculation, simultaneously for µFand µR, but independently for each simulated sample.
Signal acceptance. A 5% uncertainty on the signal yield is assigned to account for differences
between the prediction for the LO signal with respect to the NLO predictions of the
VBFNLOgenerator (v2.6.3).
Normalization of top quark and diboson backgrounds. Diboson and top quark production
processes are modeled with MC simulations. An uncertainty in the normalization of these backgrounds is assigned based on the PDF and µF, µRuncertainties, following cal-culations in Refs. [42, 43, 47].
Interference between EW Wjj and DY Wjj. An overall normalization and a shape uncertainty
are assigned to the interference term in the fit, based on an envelope of predictions with different µF, µRscales.
15
Parton showering model. The uncertainty in the PS model and the event tune is assessed as
the full difference of the acceptance and shape predictions usingPYTHIAandHERWIG++.
R(pT)correction. As described in Section 6, the R(pT)prediction from W +jets simulation is
corrected to match the distribution in data with all expected contributions other than W +jets subtracted. The uncertainty in this correction is derived by varying the fitted points within the statistical uncertainty from data and simulation combined and refitting the correction.
10
Measurement of the EW Wjj production cross section
The signal strength, defined with the `νjj final state in the kinematic region described in Sec-tion 3, is extracted from the fit to the BDT output distribuSec-tion as discussed in SecSec-tion 8. Figure 9 shows the BDT distribution in the muon and electron channels for data and simulation after the fit, where the grey uncertainty band includes all systematic uncertainties. Good agreement is observed between the data and simulation within the uncertainties.
Entries / 0.1 -1 10 1 10 2 10 3 10 4 10 5 10 6 10 7 10 CMS 35.9 fb-1 (13 TeV) Data EW W+jets W+jets t t t quark QCD multijet VV Z+jets Interference BDT' 0 0.5 1 1.5 2 2.5 (data / pred.) - 1 -0.2 -0.1 0 0.1
0.2 total uncertainty (syst. + stat.)
Entries / 0.1 -1 10 1 10 2 10 3 10 4 10 5 10 6 10 7 10 CMS 35.9 fb-1 (13 TeV) Data EW W+jets W+jets t t t quark QCD multijet VV Z+jets Interference BDT' 0 0.5 1 1.5 2 2.5 (data / pred.) - 1 -0.2 -0.1 0 0.1
0.2 total uncertainty (syst. + stat.)
Figure 9: Data compared with simulation for the BDT’ output distribution for the muon (left) and electron (right) channels, after the fit. The grey uncertainty band in the ratio panel includes all systematic uncertainties.
In the muon channel, the signal strength is measured to be
µ=0.91±0.02 (stat)±0.12 (syst)=0.91±0.12 (total), corresponding to a measured signal cross section
σ(EW`νjj) =6.22±0.12 (stat)±0.74 (syst) pb=6.22±0.75 (total) pb. In the electron channel, the signal strength is measured to be
µ=0.92±0.03 (stat)±0.13 (syst)=0.92±0.13 (total), corresponding to a measured signal cross section
The results obtained for the different lepton channels are compatible with each other, and in agreement with the SM predictions.
From the combined fit of the two channels, the signal strength is measured to be µ=0.91±0.02 (stat)±0.10 (syst)=0.91±0.10 (total), corresponding to a measured signal cross section
σ(EW`νjj) =6.23±0.12 (stat)±0.61 (syst) pb=6.23±0.62 (total) pb,
in agreement with the MADGRAPH5 aMC@NLOLO prediction σLO(EW`νjj) =6.81+−0.030.06(scale)± 0.26 (PDF) pb. In the combined fit, the DY strength is ν = 0.88±0.07. Using the statistical methodology described in Section 8, the background-only hypotheses in the electron, muon, and combined channels are all excluded with significance above five standard deviations. Ta-ble 2 lists the major sources of uncertainty and their impact on the measured precision of µ. The largest sources of experimental uncertainty are the mjjcorrection, the JES, and the limited number of simulated events, while the largest sources of theoretical uncertainty are the µF, µR scale uncertainties and the uncertainty in the signal acceptance, derived by comparing the LO signal prediction with the prediction from theVBFNLOgenerator.
Table 2: Major sources of uncertainty in the measurement of the signal strength µ, and their impact. The total uncertainty is separated into four components: statistical, number of simu-lated events, experimental, and theory. The experimental and theory components are further decomposed into their primary individual uncertainty sources.
Uncertainty source ∆µ
Statistical +0.02 −0.02
Size of simulated samples +0.05 −0.05
Experimental +0.07 −0.07
Jet energy scale and resolution +0.03 −0.01
QCD multijet estimation +0.03 −0.03
mjj correction +0.05 −0.05
Background normalization +0.02 −0.02
Other experimental uncertainties <0.01
Theory +0.07 −0.07
QCD scale and PDF +0.05 −0.05
Interference +0.02 −0.02
Signal acceptance +0.05 −0.05
Other theory uncertainties +0.01 −0.01
Total +0.10 −0.10
The signal strength is also measured with respect to the NLO signal prediction, as described in Section 3. In the muon channel, the signal strength is measured to be
µNLO=0.91±0.02 (stat)±0.12 (syst)=0.91±0.12 (total). In the electron channel, the signal strength is measured to be
17
µNLO=0.89±0.03 (stat)±0.12 (syst)=0.89±0.12 (total). From the combined fit of the two channels, the signal strength is measured to be
µNLO=0.90±0.02 (stat)±0.10 (syst)=0.90±0.10 (total), corresponding to a measured signal cross section
σ(EW`νjj) =6.07±0.12 (stat)±0.57 (syst) pb=6.07±0.58 (total) pb,
in agreement with thePOWHEGNLO prediction σNLO(EW`νjj) =6.74+−0.020.04(scale)±0.26 (PDF) pb.
11
Limits on anomalous gauge couplings
It is useful to look for signs of new physics via a model-independent EFT framework. In the framework of EFT, new physics can be described as an infinite series of new interaction terms organized as an expansion in the mass dimension of the operators.
In the EW sector of the SM, the first higher-dimensional operators containing bosons are six-dimensional [8]: OWWW = cWWW Λ2 WµνW νρWµ ρ, OW = cW Λ2(D µΦ)†W µν(D νΦ), OB= cB Λ2(D µΦ)†B µν(D νΦ), e OWWW = ceWWW Λ2 WeµνW νρWµ ρ, e OW = ecW Λ2(D µΦ)† e Wµν(DνΦ), (4)
where, as is customary, group indices are suppressed and the mass scaleΛ is factorized from the coupling constants c. In Eq. (4), Wµνis the SU(2) field strength, Bµνis the U(1) field strength, Φ is the Higgs doublet, and operators with a tilde are the magnetic duals of the field strengths. The first three operators are charge and parity conserving, whereas the last two are not. Models with operators that preserve charge conjugation and parity symmetries can be included in the calculation either individually or in pairs. With these assumptions, the values of coupling constants divided by the mass scale c/Λ2are measured.
These operators have a rich phenomenology since they contribute to many multiboson scat-tering processes at tree level. The operator OWWW modifies vertices with three or six vector bosons, whereas the operators OW and OB modify both the HVV vertices and vertices with three or four vector bosons. A more detailed description of the phenomenology of these oper-ators can be found in Ref. [69]. Modifications to the ZWW and γWW vertices are investigated in this analysis, since these modify the pp→Wjj cross section.
Previously, modifications to these vertices have been studied using anomalous trilinear gauge couplings [70]. The relationship between the dimension-six operators in Eq. (4) and ATGCs can be found in Ref. [8]. Most stringent limits on ATGC parameters were previously set by LEP [71], CDF [72], D0 [73], ATLAS [74, 75], and CMS [76, 77].
11.1 Statistical analysis
The measurement of the coupling constants uses templates in the pT of the lepton from the W → `νdecay. Because this is well measured and longitudinally Lorentz invariant, this vari-able is robust against mismodeling and ideal for this purpose. An additional requirement of BDT>0.5 has been applied, which is optimized based on the expected sensitivity to the ATGC signal. The expected limits are subsequently improved by 20–25% with respect to the expected limits without a BDT selection. In each channel, four bins from 0 < p`T < 1.2 TeV are used, where the last bin contains overflow and its lower bin edge boundary has been optimized sep-arately for each channel.
For each signal MC event, 125 weights are assigned that correspond to a 5×5×5 grid in (cWWW/Λ2) (cW/Λ2) (cB/Λ2). Equal bins are used in the interval [−15, 15]TeV−2 for cWWW/Λ2, [−40, 40]TeV−2 for cW/Λ2, and equal bins in the interval [−175, 175]TeV−2 for cB/Λ2.
To construct the p`
Ttemplates, the associated weights calculated for each event are used to con-struct a parametrized model of the expected yield in each bin as a function of the values of the dimension-six operators’ coupling constants. For each bin, the ratios of the expected signal yield with dimension-six operators to the one without (leaving only the SM contribution) are fitted at each point of the grid to a quadratic polynomial. The highest p`T bin has the largest statistical power to detect the presence of higher-dimensional operators. Figure 10 shows ex-amples of the final templates, with the expected signal overlaid on the background expectation, for three different hypotheses of dimension-six operators. The SM distribution is normalized to the expected cross section.
A simultaneous binned fit for the values of the ATGCs is performed in the two lepton channels. A profile likelihood method, the Wald Gaussian approximation, and Wilks’ theorem [78] are used to derive confidence intervals at 95% confidence level (CL). One-dimensional and two-dimensional limits are derived on each of the three ATGC parameters and each combination of two ATGC parameters while all other parameters are set to their SM values. Systematic and theoretical uncertainties are represented by the individual nuisance parameters with log-normal distributions and are profiled in the fit.
11.2 Results
No significant deviation from the SM expectation is observed. Limits on the EFT param-eters are reported and also translated into the equivalent paramparam-eters defined in an effec-tive Lagrangian (LEP parametrization) in Ref. [79], without form factors: λγ =
λZ = λ, ∆κZ = ∆gZ
1 −∆κγ tan2θW. The parameters λ, ∆κZ, and ∆gZ1 are considered, where the ∆ symbols represent deviations from their respective SM values.
Results for the one-dimensional limits are listed in Table 3 for cWWW, cW and cB, and in Table 4 for λ, ∆gZ1 and ∆κ1Z; two-dimensions limits are shown in Figs. 11 and 12. The results are dominated by the sensitivity in the muon channel due to the larger acceptance for muons. An ATGC signal is not included in the interference between EW and DY production. The effect on the limits is small (<3%). The LHC semileptonic WZ analysis using 13 TeV data currently sets the most stringent limits on cWWW/Λ2 and c
W/Λ2, while the WW analysis using 8 TeV data currently sets the tightest limits on cB/Λ2. This analysis is most sensitive to cWWW/Λ2, where the limit is slightly less restrictive but comparable.
11.2 Results 19 Events -1 10 1 10 2 10 3 10 4 10 5 10 6 10 CMS 35.9 fb-1 (13 TeV) Data EW W+jets W+jets t t t quark QCD multijet VV Z+jets Interference =7.5 www ATGC c =20 w ATGC c =87.5 b ATGC c ) [GeV] µ ( T p 0 200 400 600 800 1000 1200 (data / pred.) - 1 -0.5 0 0.5
Jet energy scale unc.
Quark-gluon likelihood reweighting unc.
F µ QCD scale: R µ QCD scale: correction unc. jj M Events -1 10 1 10 2 10 3 10 4 10 5 10 CMS 35.9 fb-1 (13 TeV) Data EW W+jets W+jets t t t quark QCD multijet VV Z+jets Interference =7.5 www ATGC c =20 w ATGC c =87.5 b ATGC c (e) [GeV] T p 0 200 400 600 800 1000 1200 (data / pred.) - 1 -0.5 0 0.5
Jet energy scale unc.
Quark-gluon likelihood reweighting unc.
F µ QCD scale: R µ QCD scale: correction unc. jj M
Figure 10: Distributions of p`Tin data and SM backgrounds, and various ATGC scenarios in the muon (left) and electron (right) channels, before the fit. For each ATGC scenario plotted a par-ticular parameter is varied while the other ATGC parameters are fixed to zero. The lower pan-els show the ratio between data and prediction minus one with the statistical uncertainty from simulation (grey hatched band) as well as the leading systematic uncertainties in the shape of the p`Tdistribution.
Table 3: One-dimensional limits on the ATGC EFT parameters at 95% CL.
Coupling constant Expected 95% CL interval (TeV−2) Observed 95% CL interval (TeV−2)
cWWW/Λ2 [−2.5, 2.5] [−2.3, 2.5]
cW/Λ2 [−16, 19] [−8.8, 16]
cB/Λ2 [−62, 61] [−45, 46]
Table 4: One-dimensional limits on the ATGC effective Lagrangian (LEP parametrization) pa-rameters at 95% CL.
Coupling constant Expected 95% CL interval Observed 95% CL interval
λZ [−0.0094, 0.0097] [−0.0088, 0.0095]
∆gZ
1 [−0.046, 0.053] [−0.029, 0.044]
∆κZ
] -2 [TeV 2 Λ / W c -20 0 20 ] -2 [TeV 2 Λ / B c -100 0 100 Expected 68% CL Expected 95% CL Expected 99% CL Observed 95% CL = 13 TeV s , -1 L = 35.9 fb CMS ] -2 [TeV 2 Λ / WWW c -4 -2 0 2 4 ] -2 [TeV 2 Λ / B c -100 0 100 Expected 68% CL Expected 95% CL Expected 99% CL Observed 95% CL = 13 TeV s , -1 L = 35.9 fb CMS ] -2 [TeV 2 Λ / WWW c -4 -2 0 2 4 ] -2 [TeV 2 Λ / W c -20 0 20 Expected 68% CL Expected 95% CL Expected 99% CL Observed 95% CL = 13 TeV s , -1 L = 35.9 fb CMS
11.2 Results 21 Z 1 g ∆ -0.1 0 0.1 Z λ -0.02 -0.01 0 0.01 0.02 Expected 68% CL Expected 95% CL Expected 99% CL Observed 95% CL = 13 TeV s , -1 L = 35.9 fb CMS Z 1 g ∆ -0.1 0 0.1 Z κ∆ -0.1 0 0.1 Expected 68% CL Expected 95% CL Expected 99% CL Observed 95% CL = 13 TeV s , -1 L = 35.9 fb CMS Z λ -0.02 -0.01 0 0.01 0.02 Z κ∆ -0.1 0 0.1 Expected 68% CL Expected 95% CL Expected 99% CL Observed 95% CL = 13 TeV s , -1 L = 35.9 fb CMS
Figure 12: Expected and observed two-dimensional limits on the ATGC effective Lagrangian (LEP parametrization) parameters at 95% CL.
11.3 Combination with the VBF Z boson production analysis
As mentioned in Section 1, the closely-related EW Zjj process has been measured by CMS at
√
s =13 TeV [15]. This result included constraints on ATGC EFT parameters obtained via a fit to the pT(Z) distribution, an experimentally clean observable sensitive to deviations from zero in the ATGC parameters. Both the EW Zjj and EW Wjj analyses are sensitive to anomalous couplings related to the WWZ vertex. A simultaneous binned likelihood fit for the ATGC parameters is performed to the pT(Z) distribution in the EW Zjj production and and pT` in the EW Wjj production. In the combined fit, the primary uncertainty sources are correlated including the JES and JER uncertainties. Results for the one-dimensional limits are listed in Table 5 for cWWW, cW and cB, and in Table 6 for λ,∆gZ1, and∆κ1Z; two-dimensions limits are shown in Figs. 13 and 14.
Table 5: One-dimensional limits on the ATGC EFT parameters at 95% CL from the combination of EW Wjj and EW Zjj analyses.
Coupling constant Expected 95% CL interval (TeV−2) Observed 95% CL interval (TeV−2)
cWWW/Λ2 [−2.3, 2.4] [−1.8, 2.0]
cW/Λ2 [−11, 14] [−5.8, 10.0]
cB/Λ2 [−61, 61] [−43, 45]
Table 6: One-dimensional limits on the ATGC effective Lagrangian (LEP parametrization) pa-rameters at 95% CL from the combination of EW Wjj and EW Zjj analyses.
Coupling constant Expected 95% CL interval Observed 95% CL interval
λZ [−0.0089, 0.0091] [−0.0071, 0.0076]
∆gZ
1 [−0.040, 0.047] [−0.021, 0.034]
∆κZ
1 [−0.058, 0.059] [−0.043, 0.042]
12
Study of the hadronic and jet activity in W +jet events
Having established the presence of the SM signal, the properties of the hadronic activity in the selected events can be examined, in particular in the the region in rapidity between the two tagging jets, with low expected hadron activity (rapidity gap). The production of additional jets in the rapidity gap, in a region with a larger contribution of EW Wjj processes is explored in Section 12.1. Studies of the rapidity gap hadronic activity using track-only observables, are presented in Section 12.2. Finally, a study of hadronic activity vetoes, using both PF jets and track-only observables, is presented in Section 12.3. A significant suppression of the hadronic activity in signal events is expected because the final-state objects originate from EW interac-tions, in contrast with the radiative QCD production of jets in DY Wjj events.
In all these studies, event distributions are shown with a selection on the output value at BDT>0.95, which allows a signal-enriched region to be selected with a similar fraction of sig-nal and background events. None of the BDT input observables listed in Section 8 are related to additional hadronic activity observables, as a consequence there is no bias on the additional hadronic activity observables due to the BDT output cut. The reconstructed distributions are compared directly to the prediction obtained with a full simulation of the CMS detector. In the BDT> 0.95 region, the dominant uncertainty on the prediction from simulation is due to the limited number of generated events.
23 ] -2 [TeV 2 Λ / W c -20 0 20 ] -2 [TeV 2 Λ / B c -100 0 100 Expected 68% CL Expected 95% CL Expected 99% CL Observed 95% CL = 13 TeV s , -1 L = 35.9 fb CMS ] -2 [TeV 2 Λ / WWW c -4 -2 0 2 4 ] -2 [TeV 2 Λ / B c -100 0 100 Expected 68% CL Expected 95% CL Expected 99% CL Observed 95% CL = 13 TeV s , -1 L = 35.9 fb CMS ] -2 [TeV 2 Λ / WWW c -4 -2 0 2 4 ] -2 [TeV 2 Λ / W c -20 0 20 Expected 68% CL Expected 95% CL Expected 99% CL Observed 95% CL = 13 TeV s , -1 L = 35.9 fb CMS
Figure 13: Expected and observed two-dimensional limits on the EFT parameters at 95% CL from the combination of EW Wjj and EW Zjj analyses.
Z 1 g ∆ -0.1 0 0.1 Z λ -0.02 -0.01 0 0.01 0.02 Expected 68% CL Expected 95% CL Expected 99% CL Observed 95% CL = 13 TeV s , -1 L = 35.9 fb CMS Z 1 g ∆ -0.1 0 0.1 Z κ∆ -0.1 0 0.1 Expected 68% CL Expected 95% CL Expected 99% CL Observed 95% CL = 13 TeV s , -1 L = 35.9 fb CMS Z λ -0.02 -0.01 0 0.01 0.02 Z κ∆ -0.1 0 0.1 Expected 68% CL Expected 95% CL Expected 99% CL Observed 95% CL = 13 TeV s , -1 L = 35.9 fb CMS
Figure 14: Expected and observed two-dimensional limits on the ATGC effective Lagrangian (LEP parametrization) parameters at 95% CL from the combination of EW Wjj and EW Zjj analyses.
12.1 Jet activity studies in a high-purity region 25
12.1 Jet activity studies in a high-purity region
For this study, aside from the two tagging jets used in the preselection, all PF jets with pT >
15 GeV found within the pseudorapidity gap of the tagging jets, ηtag jetmin < η< ηmaxtag jet, are used. For the estimation of the background contributions, the normalizations obtained from the fit discussed in Section 10 are used.
The pT of the leading additional jet in Wjj events, as well as the scalar pT sum (HT) of all additional jets, are shown in Figs. 15 and 16, comparing data and simulations including the signal prediction from MADGRAPH5 aMC@NLO interfaced with eitherPYTHIA or HERWIG++ parton showering. The comparison reveals a deficit in the simulation predictions withPYTHIA
parton showering for the rate of events with lower additional jet activity, whereas the tail of higher additional activity is generally in better agreement.
A suppression of additional jets is observed in data compared with the background-only sim-ulation shapes. In the simsim-ulation of the signal, the additional jets are produced by the PS (see Section 3), so studying these distributions provides insight on the PS model in the rapidity gap region.
12.2 Study of charged hadron activity
For this study, a collection is formed of high-purity tracks [80] with pT > 0.3 GeV, uniquely associated with the main PV in the event. Tracks associated with the lepton or with the tagging jets are excluded from the selection. The association between the selected tracks and the recon-structed PVs is carried out by minimizing the longitudinal impact parameter, which is defined as the z-distance between the PV and the point of closest approach of the track helix to the PV, labeled dPVz . The association is required to satisfy the conditions dPVz <2 mm and dPVz <3δdPVz , where δdPVz is the uncertainty in dPVz .
A collection of “soft-track” jets is defined by clustering the selected tracks using the anti-kT clustering algorithm [51] with a distance parameter of R=0.4. The use of track jets represents a clean and well-understood method [81] to reconstruct jets with energy as low as a few GeV. These jets are not affected by pileup because of the association of the constituent tracks with the hard scattering vertex [82].
Track jets of low pTand within ηtag jetmin <η<ηtag jetmax are considered for the study of the hadronic activity between the tagging jets, and referred to as “soft activity” (SA). For each event, the scalar pT sum of the soft-track jets with pT > 1 GeV is computed, and referred to as the “soft HT” variable. Figures 17 and 18 show the distribution of the leading soft-track jet pT and soft HT in the signal-enriched region (BDT> 0.95), for the electron and muon channels, compared to predictions from PYTHIA and HERWIG++ PS models. The plots show some disagreement
between the data and the predictions, in particular in the regions of small additional activity, when compared with thePYTHIApredictions.
12.3 Study of hadronic activity vetoes
The efficiency of a hadronic activity veto corresponds to the fraction of events with a measured gap activity below a given threshold. This efficiency is studied as a function of the applied threshold for various gap activity observables. The veto thresholds studied here start at 15 GeV for gap activities measured with standard PF jets, while they go down to 1 GeV for gap activities measured with soft-track jets.