Honey price estimation for the future in Turkey; example of 2019-
2020
Mustafa Bahadır ÇEVRİMLİ
1,a,, Mehmet Saltuk ARIKAN
2,b, Mustafa Agah TEKİNDAL
3,c1Selçuk University, Faculty of Veterinary Medicine, Department of Livestock Economics and Management, Konya; 2Fırat University, Faculty of Veterinary Medicine, Department of Animal Health Economics and Management, Elazığ; 3Selçuk University,
Faculty of Veterinary Medicine, Department of Biostatistic, Konya, Turkey.
aORCID: 0000-0001-5888-242X; bORCID: 0000-0003-4862-1706; cORCID: 0000-0002-4060-7048.
Corresponding author: [email protected]
Received date: 27.05.2019 - Accepted date: 01.11.2019
Abstract: The purpose of the present study is to develop models for the time series data of honey prices in Turkey between 1998 and 2018 using Box-Jenkins and Winter's Exponential Smoothing methods and to evaluate the TRY- and US$-denominated forecasts made using such models for 2019-2020. The method employed to analyse the time series data is the Seasonal Auto Regressive Integrated Moving Average (SARIMA). The most suitable model to forecast the honey prices was found to be SARIMA (2,1,2)(1,0,1) for TRY-denominated prices and SARIMA (0,1,3)(0,0,0) for US$-denominated prices. It was forecast that the average price of 1 kg of honey would be 49.08 TRY/6.15 US$ at the end of 2020. Since the study will provide beekeepers with information on future prices, it will help them better plan their production activities. The price forecasts in this study will be useful for producers and those involved in sale of honey with respect to prediction of how the honey prices will change in the years to come.
Keywords: Forecasting, honey, time series, Turkey.
Türkiye’de bal fiyatlarının geleceğe yönelik kestirimi; 2019-2020 örneği
Özet: Bu çalışmada, Türkiye’de 1998-2018 yıllarına ait aylık bal fiyatları zaman serisinin Box-Jenkins ve Winter’s Üstel Düzgünleştirme yöntemleri ile modellenerek ve bu modellerin 2019-2020 yılları arasında TL ve dolar bazında öngörülerinin değerlendirilmesi amaçlanmıştır. Zaman serilerinin analizlerinde mevsimsel otoregresif hareketli ortalama (SARIMA- Seasonal Autoregressive Integrated Moving Average) yöntemi kullanılmıştır. Bal fiyatları için belirlenen en uygun tahmin modeli TL bazında SARIMA(2,1,2)(1,0,1) modeli ve dolar bazında SARIMA(0,1,3)(0,0,0) modeli olduğu tespit edilmiştir. Çalışma sonucunda 2020 yılı sonunda bal fiyatlarının doğrusal artış ile ortalama 49.08 TL/kg ve 6.15 US$ olacağı tahmin edilmiştir. Sonuç olarak arıcılıkla uğraşanların gelecekteki fiyatlar hakkında bilgi sahibi olmaları onlara üretim faaliyetinin planlanmasında faydalı bilgiler sağlayacaktır. Çalışmada yapılan fiyat tahminleri balın satış aşamasında faaliyet gösteren kişiler ve üreticiler için ürün fiyatlarının nasıl şekilleneceği konusunda öngörü sahibi olmalarını sağlayacaktır.
Anahtar sözcükler: Bal, tahminleme, Türkiye, zaman serisi.
Introduction
Today, the beekeeping industry has become a significant rural production sector with its increasing economic returns and product diversity (11). Turkey ranks second following China in both the total number of hives and total honey production (12). In 2018, Turkey produced 107 thousand tons of honey with a total of 8.1 million honey-producing hives (35).
While the marketing infrastructure of honey in Turkey is conventional, the marketing channels are divided into three groups, namely, producers, wholesalers and retailers (10). In addition to the marketing channels, the beekeeping enterprises are able to find markets for
their products through direct sales to processing companies and via cooperatives. However, marketing via cooperatives is a last resort for producers due to its low margin of profit (25). The major marketing-related problems of beekeeping enterprises are that they cannot sell their products in a timely manner and cannot charge the price they prefer, and that a quality-price relationship does not exist for honey in the domestic market (11, 29).
Previous studies found that honey production costs varied depending on the total number of hives belonging to the enterprises (7, 22), and that the enterprises could reduce their production costs through sale of by-products and migratory beekeeping (11). In 2018, the average retail
price of strained honey in Turkey was 30.48 TRY (Turkish Lira)/kg (minimum-maximum: 28.22-33.72, standard deviation: 2.10) or 6.43 US$/kg (minimum-maximum: 5.0-7.5, standard deviation: 0.82) (36).
The future of honey production and prices is important for both producers and consumers. Honey consumption per capita in Turkey was 0.84 kg in 2003 and rose to 1.22 kg as of 2013, the most recent year for which latest data are available (13). It is noted that honey price is the most important factor in the countries' honey export and competitiveness in the international market. Taking this into account, estimations and inferences are made regarding the competitiveness of countries in the international market using the past price data (20). Today, honey price affects the consumer demand for honey, along with a number of factors such as quality, production technique and origin of the honey (19, 21).
Time series is a series of observations made at certain time intervals, which allows development of an appropriate model using statistical methods to make forecasts (2). Time series analysis has been recently found wide use in studies focusing on honey production, specifically to predict the number of colonies and honey export and import (23, 28), to determine the competitive power in honey export (34), to forecast honey production using Autoregressive integrated moving average (ARIMA) models (6, 9, 18) and to determine the supply of and demand for honey (26).
The main objective of our study is to examine the fluctuations in TRY- and USD-denominated honey prices. Furthermore, we aim to develop models for the time series data of honey prices without taking into account the exchange rate parity and to make price forecasts. What we intend to do is to determine and predict the fluctuations in TRY- and USD-denominated prices.
The purpose of the present study is to use known models for the time series data of honey prices in Turkey between 1998 and 2018 using Box-Jenkins and Winter's Exponential Smoothing methods and to evaluate the TRY- and US$-denominated forecasts made using such models for 2019-2020.
Material and Methods
Data set: The study consisted of data sets retail honey prices on a monthly basis belonging to the 1998-2018 year in Turkey (36). In the analysis of the time series, the predictions obtained by using the seasonal autoregressive moving average (SARIMA) method were evaluated. For analysis of time series, the SPSS program version 25.0 was used (15).
The Box-Jenkins method (ARIMA): Autoregressive Integrated Moving Average (ARIMA) method used in forecasting time series events was developed by Box and Jenkins (5). ARIMA modeling approach is limited to the
assumption that there is linearity between the variables. Apart from that, the researchers developed alternative modeling perspectives for forecasting the time series events not fulfilling the linearity assumption.
ARIMA or Box-Jenkins models are the combinations of AR and MA models administered to the series differenced at degree d. The essence of the Box-Jenkins method is the choice of an ARIMA model that is the most suitable one among various models based on the structure of the current data but contains limited number of parameters. As a whole, these models are represented as ARIMA (p, d, q).
In the models (38),
p: degree of autoregressive model, q: order of moving average model, d: degree of non-seasonal differencing.
The expression of ARIMA (p, d, q) model can be defined as indicated in equation 1
Zt = 1Zt−1+2Zt−2+………..+PZt−P+at−1at−1−at−2at−2−
……….. −aq−qat−q [1] Here:
P : parameter values for autoregressive operator,
at : error term coefficients, q : parameter values for moving average operator, Zt : time series of the original series differenced at degree d. In other words,
P ,t = 1,2,…,t [2] The first differences series is defined as given in equation 2. Here:= The first differences series, = the random variables subset of the original time series. If the first differences series is not stationary, stationary is checked by differencing the first time series again. This is modeled as given in equation 3. 1 −
=
t t tW
W
Z
t = 1,2,…,t [3] When the degree of difference is d = 0 (that means that the original series is stationary), the ARIMA model will be AR, MA, or ARMA model. Due to this feature, it can be said that ARIMA models incorporate all of the Box Jenkins models.As done by ARIMA (p, d, q) model, seasonal ARIMA(P,D,Q)s models only distinguish the interval between the observations that effect one another. These are (seasonal) periods. They do not indicate period involving a single interval.
For example: ARIMA(1,0,0)12 model is [monthly AR(1)]].
Zt = α + 1 Zt-12 + At [4] Thus, autocorrelation decrease exponential lags may be at 12, 24, 36, etc.
Partial autocorrelation lag is 12 = 1 1 −
−
=
t t tY
Y
W
tW
Y
t
If lag is after 1, it becomes equal to 0.
Seasonal ARIMA(P,D,Q)s Models ARIMA(p, d, q) Models relationship can be expressed as SARIMA models:
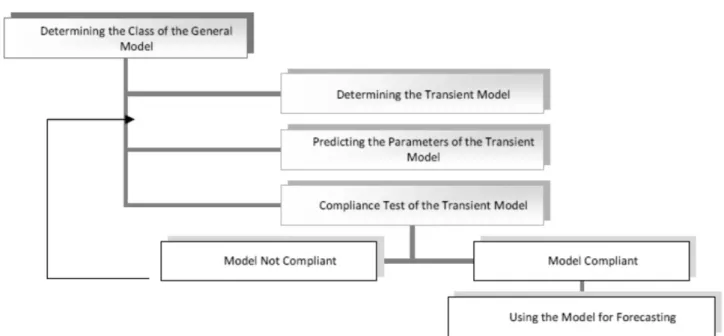
ΦP(B ) p(B) [1- ] [1-B] Zt= α + ΘQ(B ) θq(B) At [5] This model is used if we want to understand what is meant by autocorrelation design through two autoregressive polynomials and two moving average polynomials, and this can be referred to as difference operator as well (27). The model establishment process involves certain repetitive steps (5). These steps are indicated in the flow chart given in Figure 1.
The establishment of Box-Jenkins ARIMA models involves four main steps. In the first step, the class of the general model is determined. In selecting the general model, the graphs of autocorrelation and partial autocorrelation functions are used. The features of theoretical functions concerning ARIMA models are used based on autocorrelation and partial autocorrelation functions in Figure 1 (5). In the second step, a transient model compliant with the structure of the data is determined. To this end, autocorrelation and partial correlation functions are used. In determining the model, a model is selected from model classes such as AR, MA, ARMA, ARIMA, and SARIMA (32). In the third step, the parameters of the transient model are forecasted by use of efficient statistical techniques, and the standard errors of coefficients are calculated to test whether or not they are significant. In the last stage, compliance of the model is checked for forecasting. To this end, the autocorrelation
function of the model is examined by drawing the graph of the autocorrelation coefficients of the errors of the transient model that is assumed to be compliant. If this function displays a particular shape, it is concluded that errors are not random. This kind of finding means that the determined transient model is not compliant. Therefore, one turns to the second step again, and this process is repeated until the compliant model is determined through a new transient model. The model passing the compliance check is now ready to be used for forecasting (3, 17, 31, 39).
Moving averages and exponential smoothing techniques were used in forecasting. Simple exponential smoothing is a method derived from the moving averages technique, and its equation is as follows:
[6]
where is the forecast value for the next period, is the smoothing factor in the range of 0< <1, is
the actual value of the new observation at time t, and is the previous smoothed value. Note that is set such
that it minimises the mean squared errors.
t is the value observed at . Then, t is a seasonal component, is the smoothing components of the trend t, L is the number of periods in a season, is one forecast ahead of m periods, m is the number of forecast periods, (Alpha) smoothes the parameter, (Beta) is the seasonal smoothing parameter, and (Gamma) is the smoothing parameter of trend (8).
Figure 1. Model establishment process.
sB
D d ' 1 ')
1
(
−
−+
=
t t tZ
Z
Z
' 1 ^ t tZ
Z
+=
1 ^ + tZ
tZ
' tZ
tY
tb
m tF
+
Valid criteria to test model validity:
• Forecast Error (e): et = At - Ft [7] • Mean Forecast Error (MFE or Bias):
n e MFE n i i
= = 1 ) ( [8] •• Mean Absolute Deviation (MAD):
n e MAD n i i
= = 1 [9] • Mean Absolute Percentage Error (MAPE):
=−
=
n t t t tA
F
A
n
M
11
[10]• Mean Square Error (MSE):
n
E
MSE
N t t
==
1 2 [11]Results
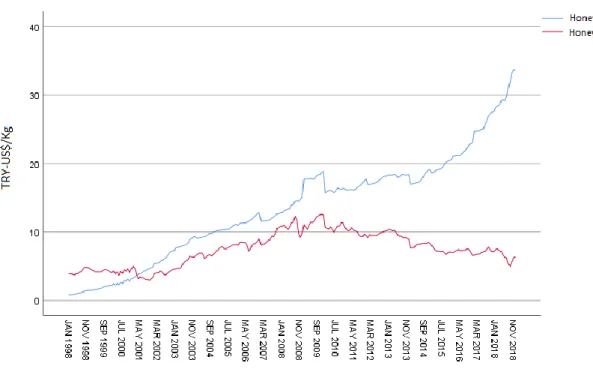
A time series analysis of the honey prices (in TRY and US$) between 1998 and 2018 was conducted to forecast the future prices of honey. Time series graph of honey prices is given in Figure 2.
Figure 2 shows that the series of TRY prices has an increasing trend, along with some fluctuations. Seasonal effects and trends in the time series prevent the series from
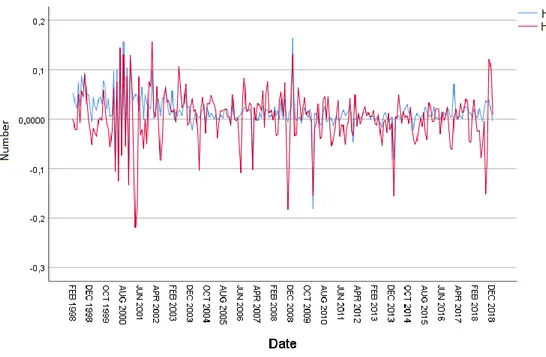
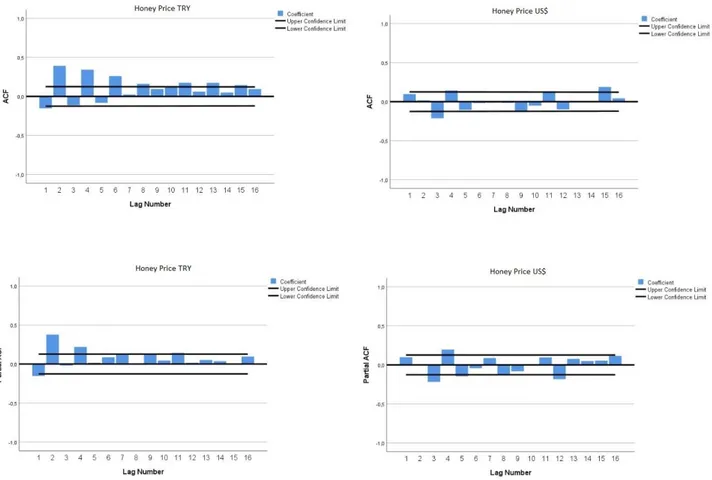
being stationary. Autocorrelation function (ACF) and partial autocorrelation function (PACF) graphs are presented in Figure-3 for understanding the stability in the series. It is understood that the series is not stationary because there are more than one delays outside the confidence limits. In order for the series to be stationary and to decrease the difference between the values, the logarithm of the series was taken and the difference was continued until the series was stationary. It is concluded that after the difference for the trend, the series becomes stationary. The time series graph of honey prices obtained after taking its first difference is given in Figure 4, and the ACF and PACF graphs are given in Figure 5.
When the ACF and PACF graphs are examined in Figure 5, it is seen that the two delays exceed the confidence limit and the other two delays are close to the confidence limit. It can be said that the series has become static. In addition, the stability analysis of the series was performed by Augmented Dickey Fuller (ADF) unit root test (14). According to the ADF test result, the series was not stationary (t = -0,258; P = 0.111) before the difference was obtained, whereas after the difference-taking process the series became stable (t = -14,789; P = 0.001).
Several different models were tested and the most suitable model was found to be SARIMA (2,1,2) (1,0,1) for TRY-denominated prices and SARIMA (0,1,3) (0,0,0) for US$-denominated prices.
Figure 3. Autocorrelation function (ACF) and partial autocorrelation function (PACF) graph of honey series.
Figure 5. Autocorrelation function (ACF) and partial autocorrelation function (PACF) graph of the difference series of honey prices.
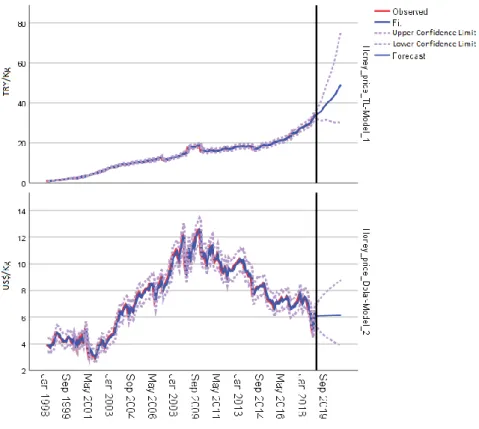
Table 1 illustrates the forecast values of honey prices until 2020. Honey prices (TRY/kg) are expected to follow an increasing trend between 2019 and 2020, similarly to that in the previous years. Accordingly, honey price is forecast to range between 30.07 and 75.81 TRY/kg as of December 2020 with an increase of 44% (average forecast value 49.08 TRY/kg). As is seen in Figure 6 where the results of the model SARIMA(2,1,2)(1,0,1) are shown, honey prices have been in a drastic increasing trend after 2014. The graph of honey prices in US$ indicates that the prices have a constant trend similar to the previous years. Results of the model SARIMA(0,1,3)(0,0,0) indicate that honey prices peaked in 2009 after which they followed a decreasing trend (Figure 6). The average value of honey prices as of December 2020 was forecast to be 6.15 US$/kg (3.87-8.79 US$).
The goodness of fit of the obtained models is examined in comparison with a criterion known as R2 (determination coefficient). The values are between 0-1 and the values are close to 1. The stationary R2 is a measure that compares the stationary part of the model with the basic model. It is preferred in case of trend or seasonal structure in the series. RMSE is the square root
of the mean squares error. It refers to how different the model is from the level estimated by the model in the dependent series. Smaller values indicate better model estimates. MAPE is the mean absolute percentage error. It is independent of the units of the series and can therefore be used to compare different series. MAE stands for mean absolute error and is expressed in the original unit of the series. MaxAPE is maximum absolute percentage error. It shows the maximum error among the forecast values and is expressed as a percentage. Therefore, it is independent of the unit used. It is useful for imagining a worst-case scenario for the forecasts. MaxAE measures maximum absolute error, expressed in the same unit as that of the dependent series. Normalized BIC (Bayesian information criteria) is a general measure of the overall fit of a model. It is used to make a comparison between different models for a series, with the low values suggesting a better model (1).
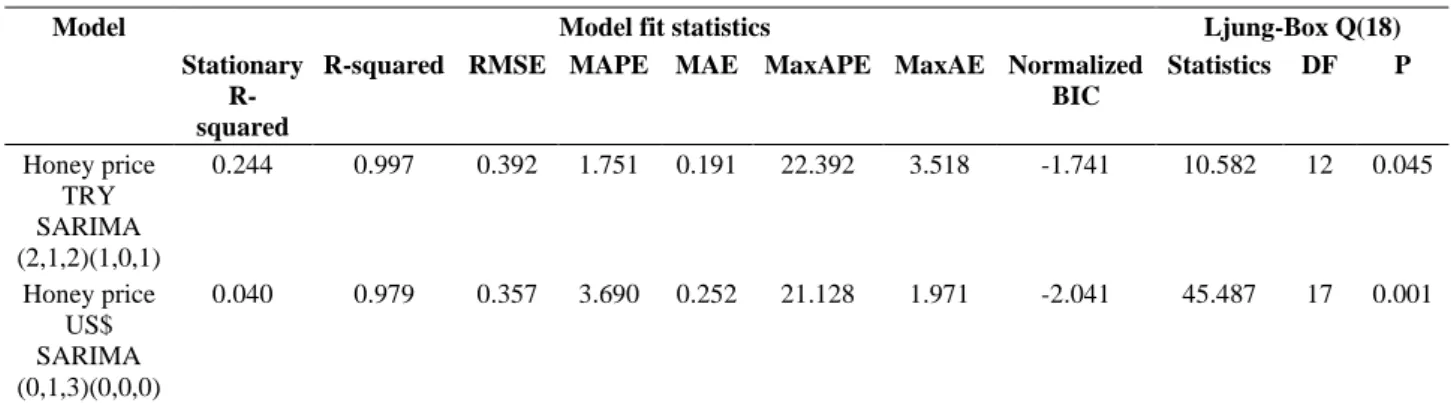
From Table 2, it is clear that the Box-Jenkins models developed for honey prices in TRY and US$ are statistically significant (P=0.045 and P=0.001). MAPE value indicates that the series have quite usable forecasts.
Table 1. Monthly honey prices forecast values according to Box Jenkins models Date month/year Predicted honey price (TRY/kg) SARIMA (2,1,2) (1,0,1) Lower confidence limit Upper confidence limit Predicted honey price (US$/kg) SARIMA (0,1,3)(0,0,0) Lower confidence limit Upper confidence limit Jan 2019 34.07 32.12 36.10 6.17 5.55 6.81 Feb 2019 34.43 31.91 37.10 6.08 5.22 6.99 Mar 2019 34.91 31.60 38.47 6.10 5.04 7.22 Apr 2019 35.35 31.50 39.53 6.10 4.95 7.33 May 2019 35.79 31.28 40.78 6.10 4.87 7.43 Jun 2019 36.29 31.22 41.95 6.10 4.79 7.53 Jul 2019 36.96 31.22 43.46 6.11 4.72 7.62 Aug 2019 37.82 31.43 45.13 6.11 4.65 7.71 Sep 2019 38.64 31.54 46.86 6.11 4.58 7.79 Oct 2019 39.33 31.58 48.42 6.11 4.52 7.87 Nov 2019 39.88 31.44 49.88 6.12 4.46 7.95 Dec 2019 40.42 31.34 51.34 6.12 4.41 8.03 Jan 2020 40.88 31.10 52.78 6.12 4.36 8.10 Feb 2020 41.47 30.98 54.38 6.12 4.30 8.17 Mar 2020 41.97 30.76 55.95 6.13 4.25 8.24 Apr 2020 42.62 30.66 57.73 6.13 4.21 8.3 May 2020 43.12 30.43 59.38 6.13 4.16 8.37 Jun 2020 43.83 30.34 61.33 6.13 4.12 8.43 Jul 2020 44.62 30.28 63.47 6.13 4.07 8.50 Aug 2020 45.74 30.43 66.14 6.14 4.03 8.56 Sep 2020 46.73 30.47 68.70 6.14 3.99 8.62 Oct 2020 47.66 30.44 71.21 6.14 3.95 8.68 Nov 2020 48.34 30.24 73.43 6.14 3.91 8.74 Dec 2020 49.08 30.07 75.81 6.15 3.87 8.79
*The calculations made in Turkish Lira (TRY) were converted into US$ using the exchange rate in the relevant period (Avarage exchange rate for 2018: US$1= ₺4.74).
Figure 6. The price of honey Box Jenkins model forecast chart.
Table 2. Box jenkins model fit criteria
Model Model fit statistics Ljung-Box Q(18)
Stationary R-squared
R-squared RMSE MAPE MAE MaxAPE MaxAE Normalized BIC Statistics DF P Honey price TRY SARIMA (2,1,2)(1,0,1) 0.244 0.997 0.392 1.751 0.191 22.392 3.518 -1.741 10.582 12 0.045 Honey price US$ SARIMA (0,1,3)(0,0,0) 0.040 0.979 0.357 3.690 0.252 21.128 1.971 -2.041 45.487 17 0.001
Discussion and Conclusion
In Turkey, the production of apicultural products is one of the branches of production that has a high competitiveness among animal products (24). In order for businesses in this sector to plan their production and manage their risks, they need to have knowledge of apicultural practices as well as forecasts for the future of the sector. The models developed by statistical methods enable such forecasts. Since the data are a series of observations made at certain time intervals, they are modelled by time series analysis (16).
A study forecasting the supply of and demand for honey in Turkey using the Box-Jenkins model predicted that the supply of and demand for honey would increase from 1.54 kg/person to 1.40 kg/person in 2020 and 2023, respectively (26).
Using the time series analysis, it was forecast that honey production would increase to 115 thousand tons and the number of colonies would reach 10 million in 2020 (28). Using the ARIMA model, it was forecast that in 2020 the honey production, number of hives and beeswax production would reach 14.6 thousand tons, 1,226 thousand and 552.9 tons, respectively (18).
In a study conducted to forecast honey production in Turkey and to identify the type of model that gives the most successful results, the most suitable forecast model was found to be ARIMA(0,1,1), and using this model it was forecast that honey production in Turkey would constantly increase, reaching 106.410 tons in 2019 and 107.887 tons in 2020 (9). In a study conducted to forecast honey production using the ARIMA model and time series data, the most suitable forecast model was found to be ARIMA(0,1,1), and using this model it was forecast that honey production in Turkey would constantly increase between 2017 and 2023, reaching 121.216 tons in 2023 (6). Another study conducted in the Czech Republic predicted using the ARIMA model that the number of honey-producing hives would be 529.730, the number of beekeepers 47.373 and the price of honey 132 CZK/kg in 2011-2012 (30).
The present study used the honey prices in TRY and US$ between 1998 and 2018. Honey prices until 2020 were forecast using the SARIMA models selected in the study. According to the results of the analysis, average honey prices in Turkey were forecast to reach 37.82 TRY/kg and 6.11 US$/kg in August 2019 and further increase to 49.08 TRY/kg ve 6.15 US$/kg in December 2020 (Table 1).
Among the model fit criteria in Table 2, MAPE value suggests that the forecast model developed for honey prices has a percentage error of 1.751% for prices in TRY and 3.690% for prices in US$. The main reason for the difference between TRY and dollar MAPE value is that TRY is depreciating against the dollar. Forecasts with an MAPE value below 10% are considered good forecasts (33). So, it may be said that the forecast values obtained from both models developed for honey prices in TRY and US$ have a sufficient level of accuracy.
The top three exporters of honey in the international market are China, Argentina and Mexico. The main reason why they are leaders in this market is that they export at a price level lower than the average world price. While average honey export price in the world was $1.9/kg in 2006, the export prices of China, Argentina and Mexico were $1.3/kg, $1.4/kg and $1.9/kg, respectively (20). In the same year, Turkey exported honey at an average price of $2.3/kg. The price of honey exported by Turkey in 2016 is reported to be $4.11/kg (13).
Although the major factor affecting honey export is reported to be its price (20), increasing concerns, including over food reliability and residues, currently cause trade restrictions to be imposed on many countries in international trade. China is one of the major exporters on which restrictions are imposed (37). The restrictions on China are mostly imposed by European Union countries (20). Additionally, it is noted that consumers are willing to pay higher prices for quality honey (19). Particularly in EU countries, the origin, value and production technique of honey are reported to be the major factors affecting the consumers' decision to purchase honey (4, 21). Although Turkey seems to have disadvantages in honey export from
the perspective of honey price compared to China, Argentina and Mexico, it may gain an advantageous position, particularly in the EU market, as the honey produced in Turkey is of higher quality and the price forecasts in this study suggest that the USD-denominated price of Turkish honey may remain constant.
In conclusion, the forward forecasting of honey prices using time series data and the sharing of the up-to-date data with producers and producer associations at certain intervals will make a significant contribution to the development of a production and marketing strategy in Turkey, which is a leading country in the beekeeping sector. With timely and accurate price forecasts, producers can have the opportunity to develop their migratory beekeeping plans more precisely one year in advance. Additionally, they can increase their total sale revenues by developing a strategy regarding how much of the honey produced they will market via which marketing channel. If the beekeeping registration system is improved, price forecasts for various types of honey as well as other beekeeping products such as pollen and propolis can provide producers with motivating information for the next year with regard to which nectar flow they will go for and what kind of a migratory beekeeping route they will follow. Using the forecasts made with producer associations and public authorities, producers can be prompted to develop a production pattern and plan that is aimed at first meeting the domestic demand and then increasing export of high-quality beekeeping products.
Financial Support
This research received no grant from any funding agency/sector.
Conflict of Interest
The authors declared that there is no conflict of interest.
References
1. Akaike HA (1974): A new look at the statistical model identification. 215-222. In: Selected Papers of Hirotugu Akaike, Springer, New York.
2. Akdi Y (2012): Zaman Serileri Analizi (Birim Kökler ve Kointegrasyon). Gazi Kitabevi, 2. Baskı, Ankara.
3. Arıkan MS, Çevrimli MB, Mat B, et al (2018): Price forecast for farmed and captured trout using box-jenkins method and 2009-2017. 79-90. In: Academic Studies in Health Sciences. Gece Publishing, Ankara.
4. Batt PJ, Liu A (2012): Consumer behaviour towards honey
products in Western Australia. BFJ, 114, 285-297.
5. Box GEP, Jenkins GM, Reinsel GC, et al (2015): Time series analysis: forecasting and control. 5th Edition, John Wiley & Sons, USA.
6. Burucu V, Gülse Bal HS (2017): Türkiye’de arıcılığın
mevcut durumu ve bal üretim öngörüsü. Tar Eko Der, 3,
28-37.
7. Cejvanovic F, Grgic Z, Maksimovic A, et al (2017):
Assumptions of economic model for sustainable productions of beekeeping in the Bosnia and Hercegovina. JASTA, 5,
481-485, 2011.
8. Chatfield C, Yar M (1998): Holt‐Winters forecasting:
some practical issues. The Statistician, 37, 129-140.
9. Çelik Ş (2015): Modelling of honey production by using
time series in Turkey. SAUJS, 19, 377-382.
10. Çevrimli MB, Sakarya E (2018): Türkiye arıcılık
sektöründe mevcut durum, sorunlar ve çözüm önerileri.
Erciyes Üniv Vet Fak Derg, 15, 58-67.
11. Çevrimli MB, Sakarya E (2019): Economic analysis of
beekeeping enterprises in Aegean Region, Turkey. Ankara
Univ Vet Fak Derg, 66, 109-115.
12. FAOSTAT (2018): Food and Agriculture Organization of
the United Nations Statistics Division. Beekeping statictics.
Available at http://faostat3.fao.org/download/Q/*/E. (Accessed Sept 07, 2018).
13. FAOSTAT (2019): Food and Agriculture Organization of
the United Nations Statistics Division. Crops and Livestock Statictics. Available at http://faostat3.fao.org/download
/Q/*/E. (Accessed Aug 29, 2019)
14. Gujarati DN (2009): Temel ekonometri. 6.Baskı, Literatür Yayıncılık, İstanbul.
15. IBM Corp. Released (2013): IBM SPSS statistics for windows, Version 22.0. Armonk, NY: IBM Corp.
16. Kaymaz Ö (2018): Forecasting of commercial egg
production in Turkey with box-jenkins and winter’s exponential smoothing methods. Eurasian J Vet Sci, 34,
142-149.
17. Kaymaz Ö, Tekindal MA, Ateş C, et al (2018): Power
analysis and sample size determination in log-rank (lakatos) test. Biostat Biometrics Open Acc J, 6, 1-4.
18. Koç B, Terin M, Ceylan M, et al (2010): General situation
of beekeeping in the Eastern Anatolian Region of Turkey and ARIMA model with the help of long-term analysis.
AJAVA, 5, 537-546.
19. Kos Skubic M, Erjavec K, Klopčič M (2018): Consumer
preferences regarding national and EU quality labels for cheese, ham and honey: The case of Slovenia. BFJ, 120,
650-664.
20. Ma L (2009): International comparison of the export
competitiveness of Chinese honey. Asian Agric Res, 1,
17-20.
21. Menozzi D, Mora C, Chryssochoidis G, et al (2010):
Traceability, quality and food safety in consumer perception, ECAG, 12, 137-158.
22. Ören MN, Alemdar T, Parlakay O, et al (2011): Adana ilinde arıcılık faaliyetinin ekonomik analizi. Ankara: Tarımsal Ekonomi Araştırma Enstitüsü (TEAE) Publication number:178.
23. Parlakay O, Yılmaz H, Yaşar B, et al (2018): The
situation of beekeeping in Turkey and the future expectations by the trend analysis method. Bursa Uludağ
Üniv Ziraat Fak Derg, 22, 17-24.
24. RTMD (2013): Republic of Turkey Ministry of
Development, 10th Development Plan 2014-2018. Special
report on livestock commission, Ankara, Turkey. Available
at http://www.sbb.gov.tr/wp-content/uploads/2018/10/10 _Hayvancilik.pdf. (Accessed June 07, 2019)
25. Saner G, Engindeniz S, Çukur F et al (2005): İzmir ve Muğla illerinde faaliyet gösteren arıcılık işletmelerinin teknik ve ekonomik yapısı ile sorunların üzerine bir araştırma. T.C. Tarım ve Köyişleri Bakanlığı Tarımsal Ekonomi Araştırma Enstitüsü, Yayın No:126, Ankara. 26. Saner G, Adanacıoğlu H, Naseri Z (2018): Forecasting
honey supply and demand in Turkey. TJAE, 24, 43-51.
27. Schwert GW (1989): Tests for Unit Roots: A Monte Carlo
Investigation. J Bus Econ Stat, 7, 147-160.
28. Semerci A (2017): Overall situation of beekeeping in
Turkey and future prospects. MKUTBD, 22, 107-118.
29. SERKA (2012): Serhat Kalkınma Ajansı. Ardahan Kafkas Arı Irkı ve Arıcılık Çalıştayı Sektör Raporu; 58-59 Kars, Türkiye.
30. Šimpach O (2012): Statistical view of the current situation of beekeeping in the Czech Republic. In: The 6th International Days of Statistics and Economics, Sep 13-15, Czech Republic.
31. Tekin ME, Tekindal MA (2019): Optimum sample size in
group comparisons in animal breeding researches with simulation study. JSTR, 5, 279-286.
32. Tekindal MA, Güllü Ö, Yazıcı AC, et al (2016): The
modelling of time-series and the evaluation of forecasts for the future: the case of the number of persons per physician in Turkey between 1928 and 2010. Biomed Res, 27,
965-971.
33. Temuçin T, Temiz İ (2016): Türkiye dış ticaret ihracat
hacminin projeksiyonu: holt-winters ve box, jenkins modellerinin bir kıyaslaması. SDÜ İİBF Dergisi, 21,
937-960.
34. Terin M, Yıldırım İ, Aksoy A, et al (2018): Competition
power of Turkey’s honey export and comparison with Balkan Countries. Bulg J Agric Sci, 24, 17-22.
35. TURKSTAT (2019): Turkey Statistical Institute Livestock
statistics database. Available at https://biruni.tuik.gov.tr/
hayvancili-kapp/hayvancilik.zul. (Accessed Jan 05, 2019). 36. TURKSTAT (2019): Turkey Statistical Institute.
Agricultural price statistics database. Available at
https://biruni.tuik.gov.tr/medas/?kn=110&locale=tr. (Accessed Feb 22, 2019).
37. Wei GX, Huang JK, Jun Y (2012): Honey safety standards
and its impacts on China's honey export. JIA, 11, 684-693.
38. Wickramarachchi AR, Herath HMLK, Jayasinghe-Mudalige UK, et al (2017): An analysis of price behavior
of major poultry products in Sri Lanka. JAS Sri Lanka, 12,
138-148.
39. Yenice S, Tekindal MA (2015): Forecasting the stock
indexes of fragile five countries through box-jenkins methods. IJBSS, 6,180-191.