T.R.
SELÇUK UNIVERSITY
THE GRADUATE SCHOOL OF NATURAL AND APPLIED SCIENCE
THEORETICAL AND EXPERIMENTAL ANALYSIS OF TURBOCHARGER IN
TRACTOR ENGINES
Zafer ÇANGA
Ph.D THESIS
Department of Agricultural Machineries and Technologies Engineering
March-2016 KONYA All rights reserved
iv
ABSTRACT
Ph.D THESIS
THEORETICAL AND EXPERIMENTAL ANALYSIS OF TURBOCHARGER IN TRACTOR ENGINES
Zafer ÇANGA
THE GRADUATE SCHOOL OF NATURAL AND APPLIED SCIENCE OF SELÇUK UNIVERSITY
THE DEGREE OF DOCTOR OF PHILOSOPHY
IN AGRICULTURAL MACHINERIES AND TECHNOLOGIES ENGINEERING
Advisor: Prof. Dr. Kazım ÇARMAN
2016, 149 Pages
Jury
Advisor Prof.Dr. Kazım ÇARMAN Prof.Dr. Hüseyin ÖĞÜT
Prof.Dr. Cevat AYDIN Assoc.Prof.Dr. Ali KAHRAMAN
Asst.Prof.Dr. Remzi ŞAHİN
Today, in many industrial applications primarily in automotive industry, where the internal combustion engines are employed to produce energy, high power and efficiency demands are encountered increasingly. In addition, there are new regulations and rules purposing on emission reduction in order to decrease environmental pollution. The condition is not different in the tractor industry too. As an important solution technique, turbocharging has been the most effective technology in order to meet the demands for high power, efficiency and low emissions.
In this study, the performance of the SFR1120-W turbocharger, manufactured for using in TUMOSAN tractors, has been investigated through experimental testing and computational fluid dynamics (CFD) analysis.
Performance tests have been carried out at the turbocharger performance test rig in the Saffer Turbocharger company. The turbocharger compressor map was produced at the end of the tests. CFD simulations of the turbocharger have been performed by using the data produced in experiments, afterwards both test results and simulation results have been compared. It was concluded that CFD results showed good similarity to the experimental results.
In the last section of the study, three design parameters of the compressor impeller, which were the leading edge angle, the trailing edge angle and the splitter blade length, were selected in order to examine the effects of these variable on the performance of the compressor. Through using selected parameters of the compressor, 27 new compressors have been designed and simulated in CFD software package Star-SSM+. The best case of the redesigned impellers had an 2,18 % increase in pressure boost at the rotational speed of 100,000 rpm.
v
ÖZET DOKTORA TEZİ
TRAKTÖR MOTORLARINDA TURBOŞARJ UYGULAMASININ TEORİK VE DENEYSEL YÖNTEMLERLE İNCELENMESİ
Zafer ÇANGA
Selçuk Üniversitesi Fen Bilimleri Enstitüsü
Tarım Makineleri ve Teknolojileri Mühendisliği Anabilim Dalı Danışman: Prof. Dr. Kazım ÇARMAN
2016, 149 Sayfa
Jüri
Prof.Dr. Kazım ÇARMAN Prof.Dr. Hüseyin ÖĞÜT
Prof.Dr. Cevat AYDIN Doç.Dr. Ali KAHRAMAN Yrd.Doç.Dr. Remzi ŞAHİN
Günümüzde otomotiv sektörü başta olmak üzere, enerji elde etmede içten yanmalı motorların kullanıldığı birçok alanda yüksek güç ve verimlilik en başta gelen talepler olarak karşımıza çıkmaktadır. Bunun yanısıra, çevre kirliliğinin azaltılması amacıyla egzoz emisyon değerlerinin düşürülmesini zorunlu kılan yasal düzenlemeler de giderek artmaktadır. Otomotiv sektöründe olduğu gibi tarımsal amaçlı olarak kullanılan traktörler için de durum aynıdır. Bahsedilen gereklilikleri karşılamak üzere içten yanmalı motorlarda kullanılan en etkin yöntem turboşarj uygulamasıdır.
Bu çalışmada TÜMOSAN marka traktörlerde kullanılmak üzere imal edilmiş SFR1120-W model turboşarjın performans ölçümleri deneysel ve Hesaplamalı Akışkanlar Dinamiği (HAD) analiz yöntemleriyle gerçekleştirilmiştir.
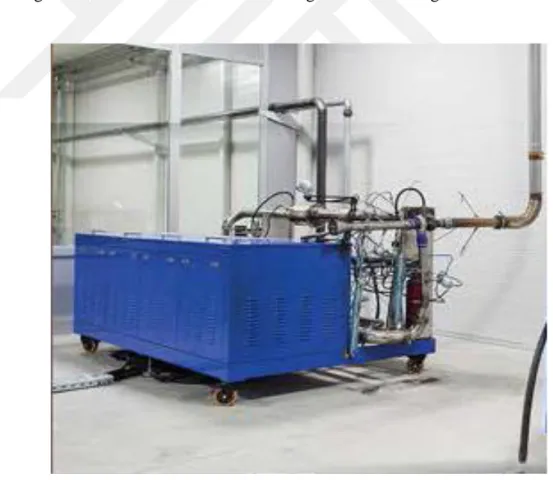
Deneysel çalışmalar turboşarj üreticisi olan Saffer Turbocharger işletmesinde bulunan turboşarj performans test cihazında yapılmıştır. Testler sonucunda turboşarj kompresörüne ait performans haritası elde edilmiştir.
Testler sonucunda elde edilen veriler kullanılarak HAD yöntemiyle turboşarjın akışkan analizleri yapılmış ve deneysel sonuçlarla mukayese edilmiştir. Deneysel ve sayısal sonuçların birbiriyle uyumlu olduğu görülmüştür.
Çalışmanın son kısmında ise kompresörün tasarım değişkenlerinden olan kompressör hava giriş açısı, hava çıkış açısı ve splitter kanat uzunluğunun, kompressör performansına etkileri incelenmiştir. Bunun için her üç değişkene üçer farklı değer verilerek 27 farklı kompresör tasarımı elde edilmiştir. Yeni kompresör tasarımları için Star-CCM+ yazılımı ile HAD analizleri gerçekleştirilerek orjinal kompresörle kıyaslamalar yapılmıştır. Analizler sonucunda, yeni tasarlanan kompresörlerden biri 100,000 d/d hızda orijinal kompresöre göre % 2.18’lik bir basınç artışı sağladığı görülmüştür.
Anahtar Kelimeler: HAD, kompresör, kompresör performans haritası, Star-CCM+, traktör, turboşarj.
vi
ACKNOWLEDGEMENTS
I would like to thank all people who supported me in completing this thesis. First of all, I am deeply indebted to my advisor Prof. Dr. Kazım Çarman for his kind guidance and contribution throughout the period of this study. I would like to thank to Prof. Dr. Hüseyin ÖĞÜT and Assoc. Prof. Dr. Ali Kahraman for their valuable advices during the studies.
I would also like to express my sincere gratitude to Assoc. Prof. Dr. Essam Abo-Serie Abdulfatah for his constructive suggestion and continuous support especially through the challenging CFD studies.
Saffer Turbocharger (Isfur Co.) is to be thanked for the supply of the test facility used in the study of the thesis. I am also grateful to Mr. Zhi Qiang, technician in Beijing Institute of Technology, for teaching the using of the turbocharger test rig.
I would like to thank my colleague Serdar Ferligül for his support and contribution especially in CAD studies.
Thank you to people in CD-Adapco company for supplying the student licence of the STAR-CCM+ used in the CFD studies.
Last but not least, I would like to express my limitless love to my wife, daughter Meryem, son Yusuf for their unconditional support, understanding and long time patience throughout the study.
Zafer ÇANGA KONYA-2016
vii
TABLE OF CONTENTS
ABSTRACT ... iv
ÖZET ...v
ACKNOWLEDGEMENTS ... vi
TABLE OF CONTENTS ... vii
NOMENCLATURE ... ix
1. INTRODUCTION ...1
1.1. Turbocharging And Turbocharger ...3
1.1.1. Turbocharging the internal combustion engine ...3
1.1.2. Definition of turbocharger ...6
1.1.3. Turbocharger matching process ...8
1.1.4. Turbocharger performance ... 10
1.1.5. Turbocharger compressor ... 11
1.2. Computational Fluid Dynamics ... 24
1.2.1. Advantages of CFD ... 25 1.2.2. General CFD procedure ... 25 2. LITERATURE REVIEW ... 30 2.1 Performance testing ... 30 2.2. Surge phenomena ... 32 2.3. CFD simulations ... 33 2.4. Design parameters ... 36
3. MATERIAL AND METHOD ... 40
3.1. Experimental Work ... 45
3.1.1. Description of the test rig ... 45
3.1.2. Compressor performance testing ... 51
3.2. CFD Simulations ... 53
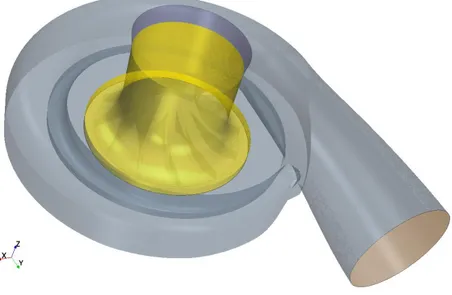
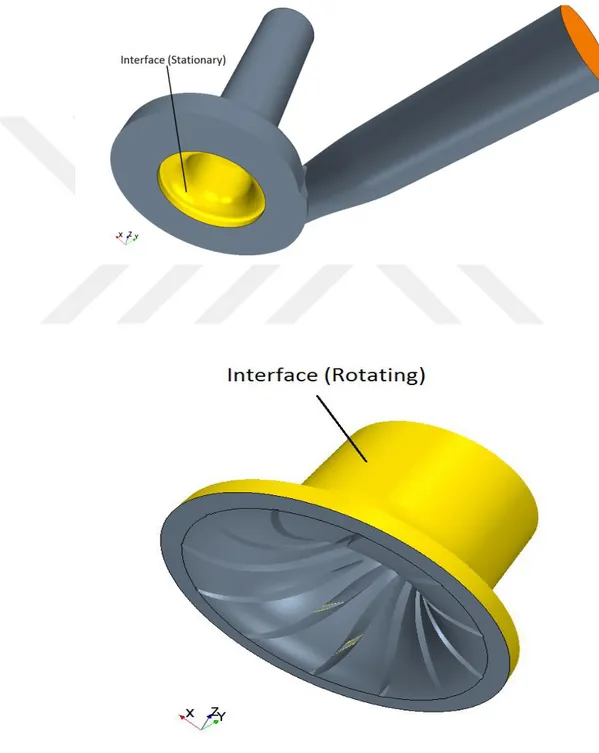
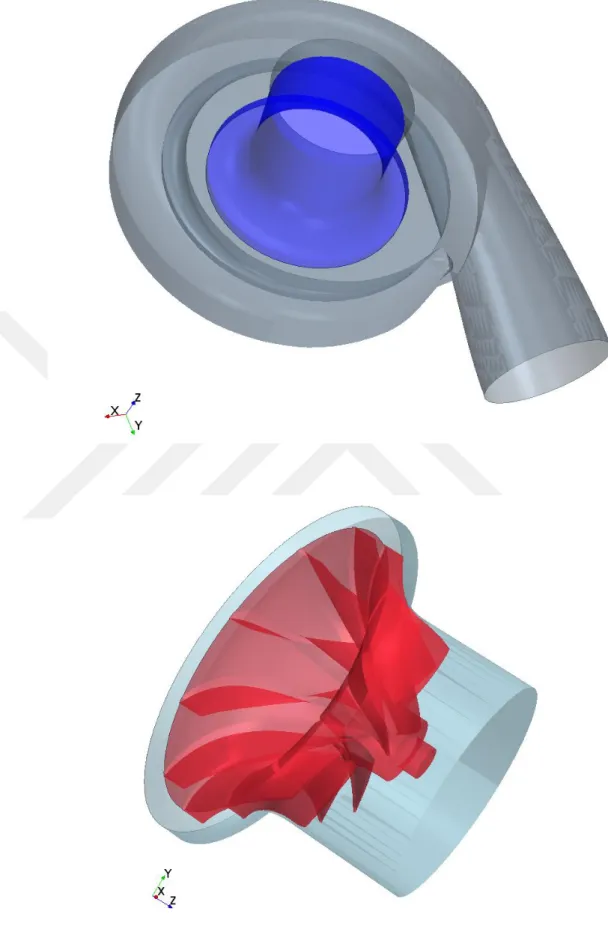
3.2.1. Creating geometry ... 53
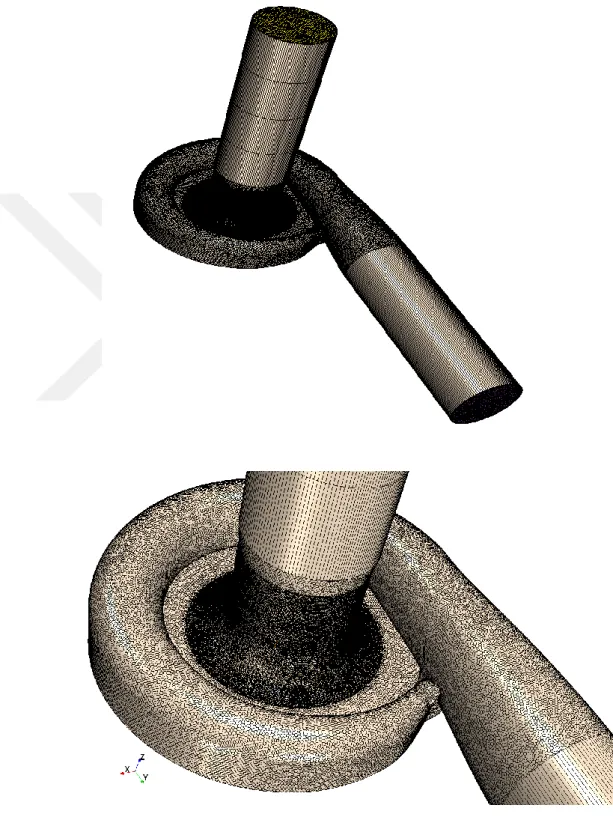
3.2.2. Generating mesh ... 56
3.2.3. Selection of physics ... 64
3.2.4. Specification of boundary conditions ... 65
3.2.5. Initialization and solution control ... 66
3.2.6. Monitoring convergence ... 67
3.2.7. Result report and visualization ... 68
3.3. Compressor Impeller Redesign And Simulations ... 69
4. RESULTS AND DISCUSSIONS ... 72
4.1. Experimental Results ... 72
4.1.1. Pressure boost ... 73
viii
4.1.3. Choke-line and surge-line ... 77
4.1.4. Range and surge margin ... 78
4.2. CFD Simulation Results... 78
4.2.1. Simulation convergence ... 78
4.2.2. Mesh size influence ... 80
4.2.3. Simulation vs. experimental results ... 81
4.2.4. CFD results representations ... 83
4.3. Impeller Redesign ... 89
4.3.1. Leading edge angle ... 90
4.3.2. Trailing edge angle ... 93
4.3.3. Splitter blade length ... 95
4.3.4. Overall results ... 97
4.3.5. Simulation representation of Case T5 ... 99
4.4. Discussions……….101
5. CONCLUSION AND SUGGESTIONS ... 103
REFERENCES ... 105
APPENDICES ... 112
ix
NOMENCLATURE
Symbols
cp : Specific heat constant (J/kgK)
C1 : Absolute velocity (m/s)
D : Diameter (mm)
h : Specific enthalpy (kJ/kg) hs : Isentropic specific work (kJ/kg)
i : Incidence angle (degree) k : Specific heat ratio
ma : Mass flow rate of air (kg/s)
mf : Mass flow rate of fuel (kg/s)
N : Crankshaft speed (rpm) Ns : Specific speed (rpm)
P : Power (kW) pr : Pressure ratio
R : Gas constant ((kj/kmol.K) T : Temperature (C0)
U1 : Rotating local speed (m/s)
V : Volume (m3)
W : Resultant velocity vector
Qf : Energy available in the fuel per unit mass (kJ/kg)
Q : Volumetric flow rate (m3/s) ε : Dissipation rate (J/kg.s) ρa : Air density (kg/m3)
ηf : Fuel conversion efficiency
ηc,tt : Compressor efficiency
ηT,tt : Turbine efficiency
ηvol : Volumetric efficiency
θ : Temperature ratio δ : Pressure ratio
x Subscripts a : Air e : Effective f : Fuel c : Compressor p : Pressure ref : Reference s : Isentropic sw : Swept volume tt : Total-to-total ts : Total-to-static vol : Volume ω : Angular speed Abbreviations
AFR : Air-fuel ratio
ANN : Artificial neural network BMEP : Brake mean effective pressure BSFC : Brake specific fuel consumption CAE : Computer aided engineering CFD : Computational fluid dynamics DoE : Design of experiment
EGR : Exhaust gas recirculation GUI : Graphical user interface IC : Internal combustion IGV : Inlet guide vane
MEP : Mean effective pressure
PISO : Pressure implicit with splitting of operators SAE : Society of automotive engineers
SIMPLE : Semi implicit method for pressure linkage equations SIMPLEC : SIMPLE-Consisten
QUICK : Quadratic upstream interpolation convective kinetics
1D : One-dimensional
1. INTRODUCTION
In the automotive industry, there has been perpetual developments of engines in order to fullfil the demands for high power and efficiency as well as requirements of low emission conditions, besides being competitive at the same time. The same conditions can be mentioned in the tractor industry without any doubt. Different technologies are nowadays used to achieve these goals, but the turbocharging has been the most effective technique for nearly a century.
Turbocharging has itself found a significant place in the automotive internal combustion engines. For long time, internal combustion engines have been improved by the use of turbocharging and the application area of this technology has included many different sectors such as trucks, cars, tractors, off-highway vehicles, ships, etc. Nowadays, related to diesel engines, tractor engines have been turbocharged with an increasing number.
On a diesel engine, the task of the turbocharger is to pressurize the intake manifold with up to 2.5 times more air than the natural aspirated engine. A turbocharger uses two wheels, an exhaust turbine and a compressor wheel, which are connected each other with a shaft. The exhaust turbine is driven by the exhaust gas of the engine. The compressor wheel draws air in through the center and discharges it into the volute which surrounds the wheel. The volute collects the pressurized air and directs it to the engine manifold.
The performance of the turbocharger is tested experimentally and the results are given in special graphs namely turbocharger maps. These maps include both operating parameters of the turbocharger such as pressure boost, efficiency, mass flow rates and information about the compressor behaviour at different working conditions. In the turbocharger industry, performance maps are supplied by the turbo manufacturer company.
The aim of the turbocharger designer is to improve the performance of the turbocharger. Computational Fluid Dynamics (CFD) is a means to analyse the turbocharger in the design stages in order to see whether the new design is met the high performance criteria or not. Morover, nowadays, CFD is applied to the optimization process of the design variables of the turbocharger to compare different solutions with reduced prototyping costs. These types of simulation are indeed essential as they can interact with designing, prototyping and testing steps.
The main motivations and contributions of the study is to investigate the performance of the SFR1120-W turbocharger through experimental testing and computational fluid dynamics (CFD) simulations and to examine the effects of some design parameters of the turbocharger compressor on the performance.
In the literature, there has not been found any thesis in which a tractor engine turbocharger performance is investigated both experimentally and numerically. In addition, the SFR1120-W turbocharger is the first turbocharger, used in tractors, manufactured in Turkey and the first turbocharger performance map is produced in this thesis wrok. In this respect, the study is the first and only study in Turkey in the literature to date. Secondly, CFD simulations of a tractor engine turbocharger have been performed for the first time, and a very good similarity in results are achieved compared to the experimental results.
There are numerious parameters that effect the performance of a turbocharger and many researches have been conducted to clarify the basic variables that have utmost affects. In the thesis, three design parameters of the compressor impeller, which are the leading edge angle, the trailing edge angle and the splitter blade length, are selected in order to examine the effects of these variable on the performance of the compressor. The study is held through redesigning the compressor impeller, simulating in Star-CCM+ software and comparing the results with the original compressor of the turbocharger.
The general work-flow of the thesis can be summarized as the following; in the first section a general information about turbocharging, turbocharger and computational fluid dynamics are given. After the literature review, the general technical information of the SFR1120-W turbocharger and the engine on which the turbocharger mounted is presented briefly in the Material and Method section. In addition, the turbocharger compressor test rig specifications and testing procedure are explained in detail. Then, numerical simulation process in the commercial CFD package Star-SSM+ is expressed. In the last part of this section, design parameters of the compressor impeller and redesign methodology are given. In the fourth part, the results of experimental testings, CFD simulations and the effect of the parameters used in redesigned impeller are presented via graphs and figures.
In the last part there are the conclusions and discussions about the results of the study and possible further work on the subject.
1.1. Turbocharging And Turbocharger
1.1.1. Turbocharging the internal combustion engine
Turbocharging is a technique which uses the engine exhaust gas energy to drive a turbocharger, which is composed of a compressor, a turbine and a shaft combining these two, for increasing the engine intake air density. The result of using turbocharger is that a higher power output of an engine is achieved as more fuel can be injected into a cylinder than a natural aspirated engine. The power of an internal combustion engine can be remarkably boosted and its performance can be improved by using a turbocharger. Nowadays, the great majority of compression ignition engines and an increasing number of spark ignition engines are turbocharged.
The first application of exhaust turbocharging for diesel engines was proposed by Alfred Buchi in 1909, but he achieved this remarkable success in 1925 properly. Since 1945, the power output of diesel engines has rapidly increased due to developments in turbocharging. It is specially true of the engines used for ship and rail propulsion and industrial generating sets.
In the last decades, charging the engine has almost been a principal technology in order to increase the performance. The original and most direct benefit that turbocharging provides is that compression increases the mass of air entering the cylinder. Hence, more fuel can be injected and burnt, consequently there will be a large increase in output power. In a comparison of a turbocharged engine with a naturally-aspirated engine of the same power output, the latter will be significantly larger and heavier and also will require a larger installation space (Baines, 2005).
Historically, turbocharging has been done with a compressor before the intake airbox increasing the air pressure and introducing a higher mass flow rate in the cylinders. In fact, with the same displacement of the cylinder, it’s possible to have a higher power as seen in the following expression:
Pe = V(MEP)(n/ε) (1.1)
This equation shows that there are two chances in order to increase the engine effective power whether acting on the mean effective pressure, or on the rotational speed. The best of two ways is to increase the intake pressure. The break mean
effective pressure BMEP for some highly rated turbocharged diesel engines have achieved ratings for 30 bar. The brake specific fuel consumption BSFC has also been lowered by turbocharging as it improves the combustion in the engine cylinders by achieving both a higher ratio of air to fuel and an increased mechanical efficiency (Capiluppi, 2012).
On the other hand, the mechanical loading capacity of an engine is limited by the maximum cylinder pressure, which is a function of the pre-compression of the intake air, the cylinder pressure ratio, and the pressure rise during combustion. The compression ratio of a turbocharged engine may be lowered to meet the cylinder pressure limit, although in practice the trend is towards maximizing the cylinder pressure to improve the engine cycle efficieny, the fuel ignition and combustion properties.
The thermal loading of the engine is determined by the cylinder gas temperature, and this depends on the intake air temperature and the temperature rise during combustion. The inlet air temperature in a turbocharged engine can be reduced by means of charge air cooling after the compressor, which adds benefit in increasing the air density and so the trapped mass in the cylinder (Baines, 2005).
Turbocharging as well improves the fuel economy because a considerable amount of the exhaust gas energy contributes to the general engine performance.
In an internal combustion engine, the mass flow rate of air into the engine is determined by the trapped mass in the cylinder as:
ma = ηvol ρa Vsw N/2 (1.2)
where ρa is the air density, Vsw is the swept volume of the cylinder, ηvol is the
volumetric efficiency, and N is the crankshaft speed.
The delivered power is determined by the amount of fuel that is burned mf :
P = ηf Qf mf (1.3)
where Qf is the energy available in the fuel per unit mass, and ηf is fuel
conversion efficiency which allows for the incomplete nature of the combustion process.
Hence the power delivered by a four-stroke engine is expressed as:
ηvol ρa Vsw N ηf Qf 1
P = maηf Qf (mf/ma) = ( ) (1.4)
2 AFR
Assuming that the engine combustion system has been well optimized, the only one of these parameters that can be changed in a major way is the inlet air density and it is accomplished through compressing the air before it enters the cylinder.
The simplest method of doing this is by means of a mechanical supercharger, consisting of a piston, sliding vane, or rotary compressor, driven by the crankshaft of the engine. A supercharger enables very considerable increases in output power to be achieved, but at a cost to overall efficiency since the supercharger at the same time consumes shaft power from the engine. The first superchargers were realised with volumetric machines, mechanically driven with belt transmissions directly from the engine crankshaft. This kind of compressor gives pulsating flow to engine, but it has the benefit to give the boost pressure to the air as soon as required without delay. However, tihs compressor connection is always a matter of mechanical losses and the energy spent to rotate it is never recovered. For this reason, another technology came on the market known as turbosupercharger or simyly turbocharger.
This new alternative technology is to drive the compressor using the energy of the engine exhaust gas, which is extracted by expanding that gas through a turbine. The turbine is linked to the compressor by means of a shaft as shown in Figure 1.1. In a typical engine roughly 30-40% of the energy released by combustion of the fuel appears as energy in the exhaust. When this amount of energy is gained from the exhaust gases in a turbine, the compressor then could be driven without any need to take power from the engine shaft.
Figure 1.1. Turbocharged engine (Baines,2005)
1.1.2. Definition of turbocharger
A turbocharger is a compressor which is driven by a turbine. The word turbocharger is an abbreviation of turbosupercharger. A supercharger as mentioned above is a compression device that is used in order to increase the charge of the cylinder of an internal combustion engine. Superchargers are driven from the crankshaft of the engine, however it is possible to avoid extracting power from the engine by driving the compressor with a turbine extracting energy from the exhaust gases. Once the practical means to do this became available, the turbocharger came into existence (Baines, 2005).
The turbocharger has three principal components: a compressor, a turbine to drive the compressor, a shaft that links these two components, and bearing assemblies to support the shaft. In addition, shaft seals are needed to seperate the air and exhaust gases from the bearing lubricant. In addition, high temperature turbochargers may require cooling passages to limit the casing and bearing emperatures, and bleed valves or other active control devices may be included. Figure 1.2 and Figure 1.3 show a small turbocharger for vehicle engines.
Figure 1.2. Turbocharger (Anonymous,2016)
The pressure ratios developed by turbocharger compressors range from low values for small gasoline engines where the boost pressure is limited to about 2, up to about 3,5-4 for vehicle diesel engines, where the operation occurs over a wide range of speeds and flow rates. Turbocharger speeds can range up to about 300,000 rev/min for very small turbochargers, and as low as 10,000 rev/min for large machines.
1.1.3. Turbocharger matching process
Naturally aspirated diesel engines operate through wide speed ranges, while the maximum useful speed will usually be limited by poor volumetric efficiency. It is obvious that a turbomachine is not ideally suited to operate in conjunction with a reciprocating machine, hence the combination of a diesel engine and turbochargers must be taken with care. The turbocharger will not work at its highest efficiency over the complete operating range of the engine, especially if its operational range is large. It is only possible to match the turbocharger correctly at one particular point in the engine operational range. For example, if an engine is required to run for most of its life at its rated speed and full load conditions, the turbocharger will be chosen such that its highest efficiency area coincides with the pressure ratio and mass flow requirement of the engine at that condition. If the engine is required to operate over a broader speed and load range, then a compromise must be made when matching the turbocharger (Ren, 1998).
In order for a turbocharged engine to work successfully, it is necessary for the various components of the system to be correctly matched. For this to happen several compatibility conditions must be satisfied. An obvious requirement is that the mass flow of exhaust passing through the turbine must be equal to the compressor air flow rate plus the mass of fuel added. An energy balance for the turbocharger requires that the power produced by the turbine must equal that absorbed by the compressor plus turbocharger shaft bearing losses.
The efficiencies of the compressor and turbine are critical to the performance of the system. The isentropic efficiency of a compressor is defined as the ratio of the ideal work input, assuming that the compression process is isentropic, to the actual work input:
isentropic work h02s – h01
ηc,tt = = (1.5)
actual work h02 – h01
Enthalpy, h, is related to temperature by the specific heat at constant pressure, h=CpT, and Cp is almost constant for air near ambient conditions, to a very good
T02s – T01
ηc,tt =
T02 – T01
The isentropic exit temperature T02s can be related to the compressor delivery
pressure p02 by
T02s = T01(p02/ p01)(k-1)/k (1.6)
where k is the ratio of specific heats. The efficiency is then
(p02/ p01)(k-1)/k - 1
ηc,tt = (1.7)
(T02/ T01) -1
The isentropic efficiency of the turbine is defined as:
actual work h03 – h04 ηT,tt = = (1.8) isentropic work h03 – h04s 1 - (T04 / T03) ηT,tt = (1.9) 1 - (p4/ p03)(ke-1)/ke
For any given boost pressure and turbine inlet temperature, the turbocharger efficiency must be above a minimum value to provide a positive pressure difference across the engine. For low boost pressures this minimum is of the order of 0.4, but at higher boost pressures it is approximately 0.5. A turbocharger efficiency of 0.5 implies individual compressor and turbine efficiencies of about 0.7, which are far from the state of the art values but cannot be taken for granted in small machines that may be seriously compromised by life, size, and cost limitations. As the turbocharger efficiency isincreased beyond the minimum value, the gains in engine pressure ratio are modest as long as the boost pressure is low, but can be very significant at high boost pressures. By comparison, exhaust gas temperature has a much smaller influence on engine pressure ratio, although again the influence increases with boost pressure ratio (Baines, 2005).
1.1.4. Turbocharger performance
The mass flow rate, pressure ratio, speed, and efficiency (or power) are the fundamental parameters that define the performance of any compressor or turbine. These are all needed for any succesfull matching of the engine and turbocharger, or for predicting the performance of a turbocharged engine system. In fact, the performance of the system is not usually given in terms of the fundamental parameters, but the equivalent nondimensional parameters shown in Table 1.1 are more useful. These parameters take into account of the inlet conditions such as the inlet total pressure and temperature p0 and T0, and the gas properties by including the
specific heat ratio k and the gas constant R. In addition, being nondimensional, they are independent of the system of units used. The same performance maps, plotted using these parameters, may be used for all inlet conditions such as might result from operation on very hot or cold days, or at altitude.
Table 1.1. Compressor and turbine performance parameters
Fundamental parameters m, pr, N, η Nondimensional parameters m√RT0/k ND , pr, , η p0D2 √kRT0 Quasi-nondimensional parameters m√T0 N , pr, , η p0 √T0 Referred parameters m√θ N T0 p0 , pr, , η ; θ = ; δ = δ √θ Tref pref
Compressor and turbine performance maps are generally plotted by using the qusi-nondimensional parameters listed in Table 1.1. These automatically compensate for changes in inlet conditions, but are not dimensionless, and so it is important to document the units that are actually used to define them.
1.1.5. Turbocharger compressor
In turbochargers generally a rotordynamic compressor is employed. It is comperatively small, cheap, efficient, and able to rotate at a high shaft speed so that it can be directly linked to the exhaust gas turbine. Historically, early compressors were axial, but the centrifugal compressor has completely replaced them in last decades because of the advantages mentioned above.
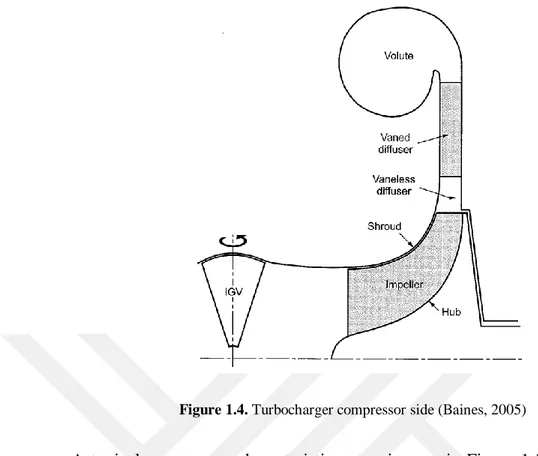
Centrifugal compressors are sometimes called radial compressors as opposed to axial compressors that are also found in many turbomachinery applications. In a centrifugal compressor, the pressure rise is created by the centripetal force applied to the air as the flow is expelled from the rotating impeller in the radial direction, and by the diffusion of the resulting high velocity flow in the impeller and in the diffuser. In general, a centrifugal compressor has rotating and stationary components. The air enters the impeller from the axial direction as seen in Figure 1.4. In some specific conditions inlet guide vanes may be used to preswirl the air before entering the impeller,
The axial flow is diffused when passing through the impeller and turned towards the radial direction. While it’s leaving the impeller it has combination of radial and tangential velocities. At the exit of the impeller, it still has significant amount of kinetic energy, and so for performance reasons this kinetic energy must be recovered in a diffuser. The diffuser may be in a number of different forms, including vaneless, vanes or channels which are used to guide the flow. Finally the air is collected to direct it towards the inlet manifold. This usually happens through using a volute in which some additional diffusion may be accomplished.
Figure 1.4. Turbocharger compressor side (Baines, 2005)
A typical compressor characteristic curve is seen in Figure 1.5. This curve presents the compressor delivery pressure ratio against the inlet mass flow following a constant rotational speed line as done in the experimental tests. It is important to understand this curve when designing a new compressor, especially in terms of choke and surge conditions. On the curve, point A defines the onset of the “choke” regime, where the Mach number reaches the sonic velocity in the impeller or the diffuser. If the delivery valve is closed, the mass flow reduces and the pressure ratio increases until a maximum pressure ratio is reached at point C. The optimum efficiency at point B, often chosen as the operating point, is met shortly before reaching C. If the flow rate is reduced further, the pressure ratio starts to decrease until the compressor enters the “surge” regime (or “stall”) at point D. Surge will be explained in detail in the following sections, but briefly it is an unstable operating mode characterised by the periodic total reversal of the flow in the impeller. In order to preserve the life expentancy of the turbocharger, the user must avoid to enter the surge condition when using the turbocharged engine.
Figure 1.5. Compressor characteristic curve (Anonymous, 2016)
Turbocharger compressor performance:
The performance characteristics of a given turbocharged internal combustion (IC) engine rely on the proper selection and integration of turbomachinery elements, i.e. compressor and turbine. Component efficiency levels and flow capacities influence the overall power output, transient response, and emissions control strategies. To address tightening emissions requirements, most of the emerging clean combustion strategies rely on heavy exhaust gas recirculation (EGR) (Sun, 2009) and subsequently place higher demands on the turbocharger and proper turbocharger-IC engine matching (Japikse et al., 2010).
In general terms regarding compressor performance requirements, the approach for reduced emissions via higher EGR utilization is in direct opposition to achieving a rated engine power condition. Since a portion of the charge air is recycled at high pressure, high EGR has the effect of increasing the required compressor pressure ratio, while reducing the necessary mass flow rate, thus driving the compressor towards or past the stable operating limit. In opposition to the low-flow requirements of the high EGR, low-emissions strategy is the rated power condition. As a result of the need for low emissions and high power capacity for current and future IC engines, a large disparity exists between essential compressor operating points for advanced turbocharger stages. Engine designers are working to get their operating points to fit within viable compressor performance envelopes, which means that their focus is really on the left and right sides of the map. The most important compressor performance parameters are the pressure ratio, which
determines the boost pressure and BMEP of the engine, and the efficiency, which affects the turbocharger efficiency and the overall fuel economy of the system. In addition, engineers are usually concerned with range, which is the range of flow rates over which the compressor will operate stably and with acceptable performance.
A typical compressor performance map is shown in Figure 1.6. The pressure ratio is plotted as a function of the mass flow rate and the speed of rotation, and contours of efficiency are superimposed on this graph. The mass flow and speed parameters used here are corrected for the inlet or ambient pressure p and temperature T.
Figure 1.6. Compressor map
It is evident that both pressure ratio and efficiency are strong functions of mass flow rate and speed. Maximum efficiency occurs over a relatively restricted range of operation, and for efficient operation of a turbocharged engine it is important to ensure that the engine running line is in this region as far as possible.
The actual details of the map, the location of the best efficiency point in relation to the rest of the map, and so on, are functions of the compressor design. A useful way to categorize compressor designs is by means of the dimensionless specific speed, defined as:
ω√Q
Ns = (1.10)
∆h0s3/4
where ω is the rotational speed, Q is the volumeflow rate (usually measured at the compressor inlet), and ∆h0s is the isentropic specific work input. The last of these is
in turn a function of the pressure ratio pr :
∆h0s = CpT0(pr(k-1)/k-1) (1.11)
and so specific speed actually embodies most of the parameters previously shown in Figure 1.5. Compressor applications and designs can therefore be classified by specific speed, and designers will then optimize a compressor for a particular specific speed. The trend in small and medium size engines is towards higher values of specific speed, because this gives a higher mass flow rate for a given compressor or alternatively reduces the turbocharger size for a given engine. In large engines turbocharger size is less critical, though not unimportant.
Modelling compressor performance requires attention to three primary regimes, each with unique challenges as will be discussed later. These are the choke, stall, and nominal operating regimes.
The range of stable operation of a compressor is limited by choke at high flow rates and surge at low flow rates, and is defined as
mchoke - msurge
Range = (1.12)
mchoke
To determine range, surge and choke mass flow rates are usually measured along a line of constant speed, although occasionally constant pressure ratio is used instead.
Choke occurs when the flow becomes sonic at the throat, or point of minimum area, of the gas path. For a compressor with a vaneless diffuser, choking always occurs at the throat of the impeller. For a compressor with a vaned diffuser such as a channel diffuser, the diffuser also has a throat, and depending on the match between the impeller and the diffuser, one or the other component will choke first. Choking sets a maximum limit on the flow capacity of the compressor. As the flow approaches choking, so the aerodynamic losses accumulate, localized patches of sonic and supersonic flow ocur, and the efficiency and pressure raito developed both fall rapidly.
The onset of surge fixes the minimum flow rate of the compressor for any given speed of rotation. Surge is marked by a breakdown of the flow and the initiation of large-scale pressure oscillations which, if unchecked, can cause rapid deterioration and failure of the compressor or the turbocharger bearings. Great care must therefore be taken to avoid running the compressor into surge. Unfortunately the region of maximum efficiency usually occurs close to surge line. The closeness of any stable operating point to surge is the surge margin:
m - msurge
Surge margin = (1. 13)
mchoke - msurge
The causes of surge are complex and not all well understood, but it basically stems from a breakdown in the deceleration of the flow in the compressor. High pressure ratios require more deceleration and compressors are likely to operate closer to this point of breakdown that at low pressure ratios. Compressor designed for high specific speeds are more likely to operate close to surge than for low specific speed.
Impeller design:
The first requirement of the impeller design is to draw the approaching air into the blade passages as smoothly as possible. In order to do so, the blades must be correctly aligned with the incoming velocity vector. The flow approaches the impeller with an absolute velocity C1 in the axial or near-axial direction, but the
Figure 1.7. Impeller inlet velocities (Baines, 2005)
The velocity of flow relative to the blades W1 is the resultant of these two,
and it is the alignment of the relative velocity vectors with the blades that is critical for high efficiency and stable operation. The angle of incidence is the difference between the blade and the flow angles:
i = β1b – β1 (1.14)
and for high performance this should be no more than a few degrees in magnitude. The design incidence angle is an important variable for compressor operation.
Having entered the blade passage, the flow then diffuses through the impeller and leaves at a velocity and in a direction that are controlled by the impeller blades. The degree of backsweep (i.e. the angle at which the blades are inclined to the radial direction at impeller exit) has an important bearing on operation. Figure 1.8 compares the exit velocities for non-backswept and backswept impellers (Baines, 2005).
Figure 1.8. Impeller exit velocities for non-backswept (β2=0) and backswept (β2<0) impellers at
low and high flow rates (Baines, 2005)
For a backswept impeller the work input and hence the pressure ratio falls as the flow rate increases, whereas for a non-backswept impeller they remain largely constant, and this is reflected in the different characteristics of the two types of impeller that are illustrated schematically in Figure 1.9.
Figure 1.9. Characteristic curves of pressure ratio versus flow rate at constant speed fon on- backswpet and backswept impellers.
The effect of backsweep is to enhance the stability and extend the range of operation of the impeller. The use of backsweep can also enhance the compressor efficiency. Backswept impellers are an almost universal choice today forturbocharger
compressors, and where wide range is very important, backsweep angles as high as 40-50o may be employed.
Turbocharger compressor stability: Stall:
Stall can ocur in any part of the compressor. It happens when the combined effect of the adverse pressure gradient that occurs in a diffusing flow and the viscous shear stresses along a solid surface are sufficient to cause the flow a short distance from the surface to come to rest. A region of stagnant flow is thus formed, and the bulk of the flow must seperate from the wall surface just upstream in order to pass around the stalled region. Stall is accompanied by a loss of total pressure, a thickening of the boundary layer and a consequent increase in aerodynamic blockage, and a misalignment between the flow and the guiding surfaces.
Stall in one component by itself may not be enough to cause the whole stage to stall, as long as there is sufficient pressure recovery in the remaining components to compensate for the stalled element. When a stage has a very strong stall in one component or when several components together stall, the pressure ratio developed is severely limited and the slope of the curve of the pressure ratio against flow rate becomes positive (pressure ratio decreases with reducing mass flow rate). The stage is now said to have stalled, and random fluctuations in flow and pressure may ocur. There is an increase in noise generated by the compressor.
At this point the whole compressor system is entering a region of instability. This can be understood by considering a compressor delivering air into the intercooler and inlet manifold, which together have a significant volume. When the compressor is operating at point A to the right of the maximum pressure rise on the characteristic curve in Figure 1.5 and Figure 1.10, the pressure ratio increaes with decreasing mass flow rate. If some disturbance causes the flow rate to be momentarily decreased so that the compressor moves to point B, it attmepts to deliver a larger pressure but also a lower flow rate to the inlet manifold. These effects are self-correcting, and when the flow disturbance is removed the compressor will automatically revert to point A.
Figure 1.10. Compressor instability and surge onset (Anonymous, 2016)
Surge:
If, however, the compressor is operating at point C when thedisturbance occurs, it will move to point D where the pressure ratio decreases with decreasing mass flow rate. The compressor now attempts to deliver flow to the inlet manifold at a pressure that is lower than air pressure in the manifold itself. As a result, a pressure wave will move from the manifold upstream into the compressor. This will exacarbate any existing recirculation in the compressor caused by stall, driving the compressor deeply into stall, and moving the compressor operation down the characteristic, reducing both the flow rate and the pressure ratio until a point is reached where the flow rate is very small. Only when this point is reached can the compressor recover from stall, and during this process the inlet manifold will have partly or wholly emptied, reducing its pressure. The compressor can now recover to the high flow end of the characteristic curve, only to be driven by the turbine back to point C where the whole cycle begins again. This phenomenon, involving large-scale pressure fluctuations between the compressor and the inlet manifold, is compressor surge.
In surge the noise level becomes very high and the pressure waves are sufficiently intence as to cause blade failure through vibration excitation or rotor dynamic failure of the bearings in a short time if unchecked. Operation of a compressor in surge for any significant length of time must be avoided.
Turbocharger performance testing:
Turbocharger compressor testing procedure is standardized by SAE J1826 code (SAE, 1995), where all requirements are defined and outlined to present a compressor performance map. The test procedures outlined in the code are applicable to single rotor turbochargers having either fixed- or variable-geometry turbochargers. The purpose of the document is to provide a recommended laboratory test procedure and presentation format for establishing the component performance for a turbocharger. The resulting data are intended for use in turbocharger component performance assessment and development and for engine/turbocharger matching.
In the code, turbochargers are mainly classified as fixed-geometry and variable-geometry; the first one has no moving parts in the aerodynamic flow path other than the compressor impeller and turbine rotor, while the second one has moving parts such as compressor inlet guide vanes, variable-geometry compressor diffuser, moveable turbine inlet nozzle vanes, and/or a wastegate.
Compressor performance ie determined through investigating the parameters of mass flow rate, pressure ratio, efficiency and speed.
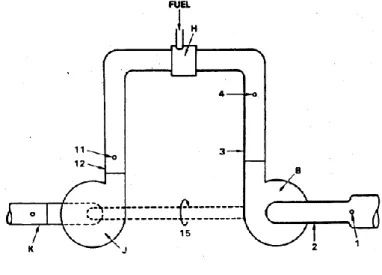
In testing procedure, the most commonly used test stand is the independent gas circuit (2-loop) hot gas stand as shown in Figure 1.11. In Figure 1.12, 1-loop (Bootstrap) hot gas stand that is less frequently used for component development and performance is shown. 1-loop stand is useful for extended durability testing.
Figure 1.12. 1-loop hot gas stand
Components of the gas stands:
A- Compressor inlet flow straightener B- Compressor stage
C- Compressor discharger flow straightener D- Compressor flow measuring section E- Compressor Throttle valve
F- Turbine throttle valve
G- Turbine flow measuring section H- Burner
I – Turbine inlet flow straightener J- Turbine stage
K- Discharge duct L- Dynamometer
M- Load compressor (optional)
Instrumentation:
1- Compressor inlet total temperature 2- Compressor inlet static pressure 3- Compressor discharge static pressure 4- Compressor discharge
6- Pressure differential
7- Flow measuring section total temperature 8- Flow measuring section inlet static pressure 9- Pressure differential
10- Flow measuring section total temperature 11- Turbine inlet total temperature
12- Turbine inlet total pressure
13- Turbine discharge total temperature 14- Turbine discharge static pressure 15- Shaft speed
According to the test code, during the test the operating speeds of the turbocharger and the number of data points per speedline vary with the turbocharger manufacturer. However, good practice dictates that point and line spacing be sufficiently close that undue interpolation is not necessary. Common practice is to begin testing at the lowest desired speed and move from high flow to low flow (surge) on the speed line. At the end of the test, the performance map shown in Figure 1.13 is produced.
1.2. Computational Fluid Dynamics
Computational Fluid Dynamics (CFD) is the analysis of systems involving fluid flow, heat transfer and associated phenomena such as chemical reactions by means of computer-based simulation. The technique is very powerful and spans a wide range of industrial and non-industrial application areas (Versteeg and Malalasekera, 1995). Indeed, CFD has certainly come of age in industrial applications and academia research. In the beginning, this popular field of study was primarily limited to high-technology engineering areas of aeronautics and astronautics, but now it is a widely adopted methodology for solving complex problems in many modern engineering fields (Tu et al., 2008).
Fluid mechanics is dealed with the study of fluids whether in motion or at rest.CFD is particularly suited for the first one, fluids that are in motion, and how the fluid flow behavior effects processes including such as heat transfer, chemical reactions etc. The physical characteristics of the fluid motion is expressed by using fundamental mathematical equations in partial differential form, which govern the solution and are called governing equations in CFD. In order to solve these mathematical equations, they are converted into computer programs or software packages.
CFD is now one of the three basic methods which is used to solve problems in fluid dynamics, the two other of which are analytical and experimental methods. Traditionally, both experimental and analytical methods have been used to study the various aspects of fluid dynamics and to assist engineers in design of equipment and industrial processes involving fluid flow and heat transfer. CFD has entered into the wider industrial community since the 1990s and is today an equal partner with pure theory and pure experiment in the analysis and solution of fluid dynamic problems (Anderson, 1995). Although experimental testing will continue to be importantly carried out, the trend is obviously toward greater reliance on the numerical methods for industrial designs, especially when the fluid flows are very complex.
Computational simulations and analyses are increasingly performed in many fluid engineering applications including aerodynamics of airplanes and motor vehicles, pumps and pipes, hydrodynamicas of ships, power plant (combustion in internal combustion engines and gas turbines), turbomachinery (compressors, turbines), etc. Through CFD, one can gain an increased knowledge of how system
components are expected to perform, so as to make the required improvements for design and optimization studied. In short, CFD is playing a strong role as a research and design tool.
1.2.1. Advantages of CFD
There are many advatages in considering CFD. Firstly, while the development process of the numerical sciences focuses on the general solution of the governing equations, CFD gives significant chance to study specific terms in the governing equations in detail which in turn practically unlimited level of results can be acquired.
CFD provides an alternative means of simulating and analysing real fluid flow systems with substantial reduction of lead times and costs comparing experimental and analytical methods. At the same time itoffers the ability to solve a range of complicated flow problems where the analytical approach is lacking.
Thirdly, CFD has the ability to study systems under hazardous conditions such as nuclear accident scenarios, or the systems that are too huge for experimental tests.
Moreover, by using CFD, the researcher is able to simulate flow conditions that are not reproducible in experimental tests.Finally, CFD provides not only more detailed but also visualized and comprehensive information comparing analytical and experimental fluid dynamics.
CFD allows alternative designs to be evaluated over a range of dimensionless parameters which include the Reynolds number, Mach number, Rayleigh number, and flow orientation. In many cases, where details of fluid flow are important, CFD can provide detailed information and understanding of the flow processes to be obtained, such as the occurence of flow seperation or whether the wall temperature exceeds some maximum limit.
1.2.2. General CFD procedure
CFD codes are structured around the numerical algorithms which can tackle fluid flow problems. In order to facilitate of easy access for the results, all CFD
packages include user-friendly Graphical User Interface (GUI) applications. All codes contain three main elements:
- Pre-processor - Solver
- Post-processor Pre-processor:
The first part of CFD solution set consists of the input data of a problem to a CFD software by using an operatör-friendly interface. It supplies the subsequent transformation of this input into a form suitable for use by the solver. In this stage, a CFD user carry out the following task: Definition of the geometry of the region of interest, grid generation, selection of the physical and chemical phenomena that need to be modelled, definition of fluid properties, specification of boundary conditions.
Solver:
There are mainly three different numerical solution techniques: finite difference, finite element and finite volume methods. Many well-established CFD commercial packages such as STAR-CD, CFX/ANSYS, FLUENT, PHOENICS use finite volume method which is a special finite difference formulation. The numerical algorithm consists of the following procedure: Integration of the governing equations, discretisation (conversion of the resulting integral equations into a system of algebraic equations), solution of the algebraic equations by an iterative method.
Post-processor:
After the solution is obtained, it is reported and visualized including: Domain geometry and grid display, vector plots, contour plots, surface plots, particle tracing, view manupulation.
In solving fluid flow problems one must be aware that the underlying physics is complex and the results generated by a CFD code are at best as good as the physics embedded in it and at worst as good as its operator. In general the following steps are followed to find a reliable solution of the problem (Tu et al., 2008):
Creation of geometry:
The first step in any CFD work is the definition and creation of geometry of the flow region (i.e. the computational domain) for the CFD calculations. The real physical flow representation of the problem is to be solved as demonstrated by the respective physical domain. Another important point in generating the geometry for
computational process in CFD is to allow the flow dynamics to be sufficiently developed across the length of computational domains.
Grid/mesh generation:
This step constitutes one of the most important steps during the pre-process stage. CFD necessitates the sub-domain of the fluid domain into a number of smaller, non-overlapping in order to solve the flow physics within the domain geometry. It results in the generation of a grid (mesh) of cells overlaying the whole domain geometry. The important fluid flows are solved numerically so that the discrete values of the flow properties such as the velocity, pressure, temperature, and other transport parameters of interest are determined.The accuracy level of a CFD solution is determined by the number of grids within the computational domain.The major of the time spent in a CFD work is usually given to generating a mesh for the domain geometry. Most commercial CFD codes have developed their own CAD-style interface and/or facilities to import data from solid modeler packages such as
PARASOLID, PRO/ENGINEER, SOLIDEDGE, SOLIDWORKS, and
UNIGRAPHICS to maximize productivity and allow the ease for geometry creation. It is up to the skills of the CFD user to design a mesh that is a suitable compromise between the desired accuracy and solution cost.
Selection of physics and fluid properties:
Industrial or academic CFD flow problems may require solutions to complicated fluid flow systems. Especially the inclusion of combustion and possibly radiation models in the CFD calculations are generally prerequisites to the successful modeling of these types of flows. It is substantial that a CFD user has to carefully identify the underlying flow physics that is unique to the essential fluid flow system.
Specification of boundary conditions:
The complex nature of many fluid flow behaviors has important implications in which boundary conditions are prescribed for the flow problem. A CFD user needs to define appropriate conditions that mimic the real physical representation of the fluid flow into a solvable CFD problem.
This step deals with the specification of boundary conditions that are available for impending simulations. Obviously, correct fluid flow boundary conditions are required to accommodate the fluid behavior when it enters and leaves the flow domain. Appropriate boundary conditions are also required to be assigned for external stationary solid wall boundaries.
Initialization and solution control:
The underlying physical phenomena in real fluid flows usually require the treatment of the key phenomena to be resolved through an iterative solution approach. Iterative procedure generally involves all the discrete values of the flow properties, such as the velocity, pressure, temperature, and othertransport parameters of interest to be initialized before calculating a solution.
The setting up of appropriate parameters in the solution control usually entails the specification of appropriate discretization (interpolation) schemes and selection of suitable iterative solvers. The algebraic forms of equations governing the fluid flow within CFD codes are usually approximated by the application of finite-difference-type approximations to a finite volume cell in space. Some of the common interpolation schemes are: First-Order Upwind, Order Upwind, Second-Order Central, and Quadratic Upstream Interpolation Convective Kinetics (QUICK). Solution procedures such as SIMPLE, SIMPLEC, or PISO algorithm are popular in many commercial codes.
Monitoring convergence:
The sixth step of the CFD solver involves the interlinking operations of three prerequisite processes: monitoring solution, CFD calculation, and checking for convergence. Two aspects that characterize a successful CFD computational solution are convergence of the iterative process and grid independence.
Convergence can usually be assessed by progressively tracking the imbalances that are accentuated by the advancement of the numerical calculations of the algebraic equations through each iteration step. These imbalances measure the overall conservation of the flow properties, they are also commonly known as the so-called residuals that are generally viewed through commercial code GUIs. These downward tendencies clearly point to be continual removal as opposed to possible accumulation of any unwanted imbalances thereby causing the iterative process to converge rather than to diverge. A converged solution is achieved when the residuals fall below some convergence criteria or tolerance that are preset inside the solver controlling parameters of the iterative solvers.
In addition to monitoring residual and variable histories, the user is well advised to also check the overall mass balance and possibly heat balance for the fluid flow system within the computational domain.
Result report and visualization:
CFD has a reputation of generating vivid graphic images and the ability to present the computational results effectively is an invaluable design tool. Commercial CFD codes often incorporate impressive visualization tools within their user-friednly GUIs to allow users to graphically view the results of a CFD calculation at the end of a computational simulation.
X-Y Plots:
These plots are mainly two-dimensional graphs that represent the variation of one dependent transport variable against another independent variable. They can usually be drawn by hand or more conveniently by many plotting packages. Such X-Y plots are the most precise and quantitative way to present the numerical data. Often, laboratory data is gathered by straight-line traverses. These graphs are therefore a popular way of directly comparing the numerical data with the experimental measured values. These graphs are widely used for presenting line profiles of velocity and for plots of surface quantities such as pressure and skin-friction coefficient.
Vector Plots:
A vector plot provides the means whereby a vector quantity is displayed at discrete points (usually velocity, with arrows) whose orientation indicates direction and whose size indicates magnitude. It generally presents a perspective view of the flow field in two dimensions. In a three-dimensional flow field, different slices of two-dimensional planes containing the vector quantities can be generated in different orientations to better scruntinize the global phenomena. F the mesh densities are considerably high, the CFD user either interpolate or reduce the numbers of output locations to prevent the clustering of those arrows “obliterating” the graphical plot.
Contour Plots:
Contour plotting presents another useful and effective graphic technique that is frequently utilized in viewing CFD results. In CFD, contour plots are one of the most commonly found graphic representation of data. A contour line (also known as isoline) can be described as a line indicative of some property taht is constant in space. The equivalent representation in three-dimensions is an isosurface. In contrast to X-Y plots, contour plots like vector plots provide a global description of the fluid flow encapsulated in one view.
2. LITERATURE REVIEW
There are numerous investigations on turbochargers regarding many different aspects for long years in the literature. Not only academia but also turbocharger manufacturers have been struggling to improve the performance of the turbocharger as a whole and as components like compressor, turbine, shaft etc. We mainly intended to study on both defining and improving the performance of the turbocharger through experimental testing and CFD simulations, then changing some certain design parameters of the compressor impeller. Consequently, literature survey on performance testing, surge phenomena, CFD simulations and design parameter investigations will be constrainted on these subjects.
2.1 Performance testing
Researchers from both manufacturing industry and academia have been used different types of test facilities in order to evaluate the peformance of the turbocharger. Regarding the flow characteristics under which the test carried out, test facilities can be classified as the steady and unstaeady test rigs. In addition, the components of the turbocharger, i.e.compressor and turbine, has been tested at structurally different rigs. Galindo et al. (2006) studied on the characterization of automotive turbochargers through using an experimental facility that was employed to determine turbine and compressor maps from turbochargers. A heavy duty diesel engine equipped with modular joints was used as a flow generator for driving the turbine, while the centrifugal compressor flow was independently fixed. A mathematical tool was developed for marking out surge operation points from stable compressor points. Tancrez et al. (2011) presented a new representation of the turbine performance maps that oriented for turbocharger characterization. The aim of the plot was to provide a more compact and suited form to implement in engine simulation models and to interpolate data from turbocharger test bench. The new map was based on the use of conservative parameters as turbocharger power and turbine mass flow to describe the turbine performance in all variable geometry turbine positions.
Lancel (2002) reported the numerical analysis and experimental test of a centrifugal compressor in order to produce accurate compressor maps and analyze
and test three diffuser designs of different throat area. Further tests were carried out to evaluate the effective performance of the compressor stage in the engine configuration. Computational Fluid Dynamics analysis showed that the reduction of the throat had a direct effect on the inlet flow angle acceptable to the diffusers.
A physically based methodology in order to perform an extrapolation of the radial turbine performance maps, both mass flow charracteristics and the efficiency curve was detailed in the study of Payri et al. (2012).The method takes into account a narrow range of experimental data, which is usually the data available when such turbines are part of a turbocharger. They applied the new procedure to five radial turbines, and results compared to experimental information in the literatüre or provided by the turbine manufacturers showed a good agreement between theoretical and experimentally estimated data.
Marelli et al. (2014), experimentally reported the performance of compressor over an extended range close to surge line. The study was focused essentially to define the surge line by using different methods in stable and unstable operating regions.Dickmann et al. (2005), experimentally analyzed the unsteady flow to obtain detailed insight into the surge and choke mechanism of the compressor through modeling and simulating by means of CFD. They modeled turbocharger compressor impeller and simulated by means of CFD at two operating points for off-design conditions. Transient CFD model was used to simulate the unsteady flow behavior.
Sutton (1986) carried out an investigation into the effects of two types of diffuser variable geometry devices on the performance of the compressor of a diesel engine turbocharger. A compressor test facility was constructed for the purpose, based on the information on surge. Experimental results showed that the two types of variable geometry to be suitable for a practical turbocharger. Theoretical work investigated the prediction of surge from a given compressor characteristic.
Whitfield and Johnson (2002) reported the effect of volute design on the performance of turbocharger compressor through fabricating and testing three different volute geometries. It was reported that the scroll that the larger than the original design gave improved performance, whereas the smaller volute did not perform well at high flow rates.Capobianco and Marelli (2006) used a cold gas test apparatus to analyse the performance of a turbocharger. Venson et al. (2006) performed it through using a hot gas stand.Kusztelan et. al. (2011), aimed to provide
a review on the current testing techniques and validation methods used to analyse different turbocharger types and designs, with discussions on future trends.
2.2. Surge phenomena
Surge has been the most complicated phenomena in turbocharger and investigated in different research programs in order to identify and solve the negative effects of it. Jansen et al. (1980) stated that the occurence of surge in a compressor limited the operating range, restricted to reach the maximum effciency, which lies close to the surge line. As a general phenomenon, the occurence of surge interferes with the nominally axisymmetric flow in the compressor and leads to an unstable condition in which, the delivered flow blocks back through the impeller and out through the intake. Another approach proposed by Mongeau et al. (1993) using low frequency aerodynamic sound generating mechanisms showed that rotating stall dominated the low frequency noise in the vaneless diffuser compressor, which mean that the illustrious peaks acoustic signal was generated to indicate rotating stall.
Cumpsty (1989) showed three different stall and surge behaviors: progressive stall, abrupt stall and surge. Rose et at. (2003) quoted from previous literature and stated that there are at least four different modes, namely: stall, mild surge, surge and a combination of two surges. Kang and Kang (2003) showed that before rotating stall was fully developed, one-, two- and three-cell structural” pre-cells” were formed.
Galindo et al. (2008, 2009) analyzed the surge in small compressors used for turbocharging internal combustion engines. Their experimental work was focused on the measurement of compressor behavior within the surge zone by means of a specifically designed facility. A specific method was presented which based on the introduction of a fluid inertia term taht accounted for the non-quasi-steady effects and the use of a compressor map extended to the surge and negative flows zone obtained from experimental results.
Numerical investigations were performed by Niazi (2000) to study rotating stall and surge and to develop control strategies for alleviation of these phenomena. A three-dimensional unsteady Navier-Stokes analysis capable of modeling multistage turbomachinery components were developed. It was demonstrated that these adverse phenomena might be eliminated, and stable operation restored, by the use of bleed valves located on the diffuser walls.