JHEP05(2018)195
Published for SISSA by SpringerReceived: November 9, 2017 Revised: February 19, 2018 Accepted: March 13, 2018 Published: May 30, 2018
Measurement of inclusive jet and dijet cross-sections
in proton-proton collisions at
√
s = 13 TeV with the
ATLAS detector
The ATLAS collaboration
E-mail:
[email protected]
Abstract: Inclusive jet and dijet cross-sections are measured in proton-proton collisions
at a centre-of-mass energy of 13 TeV. The measurement uses a dataset with an integrated
luminosity of 3.2 fb
−1recorded in 2015 with the ATLAS detector at the Large Hadron
Collider. Jets are identified using the anti-k
talgorithm with a radius parameter value of
R = 0.4. The inclusive jet cross-sections are measured double-differentially as a function
of the jet transverse momentum, covering the range from 100 GeV to 3.5 TeV, and the
ab-solute jet rapidity up to |y| = 3. The double-differential dijet production cross-sections are
presented as a function of the dijet mass, covering the range from 300 GeV to 9 TeV, and
the half absolute rapidity separation between the two leading jets within |y| < 3, y
∗, up to
y
∗= 3. Next-to-leading-order, and next-to-next-to-leading-order for the inclusive jet
mea-surement, perturbative QCD calculations corrected for non-perturbative and electroweak
effects are compared to the measured cross-sections.
Keywords: Hadron-Hadron scattering (experiments)
JHEP05(2018)195
Contents
1
Introduction
1
2
ATLAS detector
2
3
Cross-section definitions
3
4
Dataset and Monte Carlo simulations
4
5
Event and jet selection
5
6
Jet energy calibration and resolution
5
6.1
Jet reconstruction
5
6.2
Jet energy calibration
6
6.3
Jet energy scale uncertainties
7
6.4
Jet energy resolution and its uncertainties
8
6.5
Jet angular resolution and its uncertainties
8
7
Unfolding of detector effects
9
8
Propagation of the uncertainties to the cross-sections
10
9
Theoretical predictions
11
9.1
Next-to-leading-order pQCD calculations
11
9.2
Non-perturbative corrections
13
9.3
Electroweak corrections
14
9.4
Next-to-next-to-leading-order pQCD calculations
14
10 Results
16
11 Conclusion
22
The ATLAS collaboration
30
1
Introduction
Precise measurements of jet cross-sections are crucial in understanding physics at hadron
colliders. In quantum chromodynamics (QCD), jets are interpreted as resulting from the
fragmentation of quarks and gluons produced in a short-distance scattering process. Jet
cross-sections provide valuable information about the strong coupling constant, α
s, and the
JHEP05(2018)195
other processes at hadron colliders. The predictive power of fixed-order QCD calculations
is therefore relevant in many searches for new physics.
Inclusive jet production cross-sections have been measured in collisions of hadrons at
the Sp¯
pS and Tevatron colliders at various centre-of-mass energies. The latest and most
precise results at
√
s = 1.96 TeV are detailed in refs. [
1
,
2
]. At the Large Hadron Collider
(LHC) [
3
] at CERN, the ALICE, ATLAS and CMS collaborations have measured inclusive
jet cross-sections in proton-proton collisions at centre-of-mass energies of
√
s = 2.76 TeV [
4
–
6
] and
√
s = 7 TeV [
7
–
10
]. Recently, the ATLAS and CMS collaborations have measured
the inclusive jet cross-sections at
√
s = 8 TeV [
11
,
12
], and the CMS Collaboration also at
√
s = 13 TeV [
13
]. Dijet production at the LHC has been measured by the ATLAS and
CMS collaborations at a centre-of-mass energy of
√
s = 7 TeV [
7
,
14
], and also by the CMS
Collaboration at
√
s = 8 TeV [
15
].
This paper presents measurements of the inclusive jet and dijet cross-sections in
proton-proton collisions at
√
s = 13 TeV centre-of-mass energy by the ATLAS Collaboration at
the LHC, using data collected in 2015 and corresponding to an integrated luminosity of
3.2 fb
−1. The inclusive jet cross-sections are measured double-differentially as a function of
the jet transverse momentum, p
T, and absolute jet rapidity, |y|.
1In addition, the
double-differential dijet production cross-sections are presented as a function of the invariant mass
of the dijet system, m
jj, and as a function of half the absolute rapidity separation between
the two highest-p
Tjets satisfying |y| < 3, denoted y
∗.
2Jets are reconstructed using the
anti-k
tjet clustering algorithm [
16
] with a radius parameter value of R = 0.4. The measurements
cover the kinematic region of 100 GeV < p
T< 3.5 TeV and |y| < 3 for the inclusive jet
cross-section, and of 300 GeV < m
jj< 9 TeV and y
∗< 3 for the dijet cross-section.
Next-to-leading-order (NLO) perturbative QCD (pQCD) predictions calculated
us-ing several parton distribution function (PDF) sets, corrected for electroweak and
non-perturbative effects, are quantitatively compared to the measurement results. In addition,
the inclusive jet cross-sections are compared to the recently published complete
next-to-next-to-leading-order (NNLO) pQCD calculation [
17
,
18
].
2
ATLAS detector
The ATLAS experiment [
19
,
20
] at the LHC is a multi-purpose particle detector with a
forward-backward symmetric cylindrical geometry and a near 4π coverage in solid angle.
3It consists of an inner tracking detector, electromagnetic and hadron calorimeters, and a
muon spectrometer. The inner tracking detector covers the pseudorapidity range |η| < 2.5
1The rapidity is defined as y = 0.5 × ln[(E + p
z)/(E − pz)], where E denotes the energy and pz is the
component of the momentum along the beam direction.
2The variable y∗
is defined as |y1− y2| /2, where the subscripts 1,2 label the highest and second
highest-pTjet in the event satisfying |y| < 3.0, respectively. This quantity is invariant under a Lorentz boost along
the z-direction and is equal to the absolute rapidity of each jet in the dijet rest frame.
3ATLAS uses a right-handed coordinate system with its origin at the nominal interaction point (IP) in
the centre of the detector and the z-axis along the beam pipe. The x-axis points from the IP to the centre of the LHC ring, and the y-axis points upward. Cylindrical coordinates (r, φ) are used in the transverse plane, φ being the azimuthal angle around the z-axis. The pseudorapidity is defined in terms of the polar angle θ as η = − ln tan(θ/2).
JHEP05(2018)195
and is used to reconstruct tracks and vertices. It consists of silicon pixel, silicon microstrip,
and transition radiation tracking detectors, surrounded by a thin superconducting solenoid
providing a 2 T axial magnetic field. Lead/liquid-argon (LAr) sampling calorimeters
pro-vide electromagnetic (EM) energy measurements with high granularity. They consist of a
barrel (|η| < 1.475) and two endcap (1.375 ≤ |η| < 3.2) regions. The hadron calorimeters
are divided into five distinct regions: a barrel region (|η| < 0.8), two extended barrel regions
(0.8 ≤ |η| < 1.7) and two endcap regions (1.5 ≤ |η| < 3.2). The barrel and extended barrel
regions are instrumented with steel/scintillator tile calorimeters. The endcap regions are
instrumented with LAr calorimeters for both the EM and hadronic energy measurements.
The ATLAS calorimeters have very high lateral granularity and several samplings in depth
over |η| < 3.2. The muon spectrometer surrounds the calorimeters and features three large
air-core toroid superconducting magnets with eight coils each. The field integral of the
toroids ranges between 2.0 and 6.0 Tm across most of the detector. It includes a system
of precision tracking chambers for track measurement in the principal bending direction
and fast detectors for triggering and measurement of the muon coordinate in the direction
orthogonal to that determined by the precision-tracking chambers. A two-level trigger
sys-tem is used to select events. The first-level trigger is implemented in hardware and uses a
subset of the detector information. This is followed by the high-level trigger system [
21
],
which is software-based and can run the offline reconstruction and calibration software,
further reducing the event rate to an average of 1 kHz.
3
Cross-section definitions
The jet cross-sections are determined for so-called particle jets. These jets are built at
the event generator level from stable particles, i.e. those fulfilling cτ > 10 mm, where τ
is the proper lifetime. This definition includes muons and neutrinos. Jets are identified
using the anti-k
tjet algorithm [
16
] as implemented in the FastJet [
22
] package with radius
parameter R = 0.4. The use of the anti-k
talgorithm is well motivated since it is
infrared-and collinear-safe, infrared-and produces geometrically well-defined (“cone-like”) jets.
Inclusive jet double-differential cross-sections are measured as a function of jet p
Tin six equal-size bins of the absolute jet rapidity, |y|. Only jets in the kinematic range
p
T> 100 GeV and |y| < 3.0 are considered, to ensure that the jet energy scale is well
understood, as described in section
6
. The inclusive jet production cross-section can be
expressed as a ratio of the number of jets in data after correcting for detector effects, N
jets,
to the integrated luminosity of the data, L, in a given interval of momentum and rapidity,
∆p
Tand ∆y respectively:
d
2σ
dp
Tdy
=
N
jetsL∆p
T∆y
.
The dijet double-differential cross-section is measured as a function of the invariant
mass of the dijet system, m
jj, in six equal-size bins of y
∗, for events with at least two jets
with p
T> 75 GeV and |y| < 3.0. In addition, the scalar sum of the p
Tof the first and second
leading jets, H
T,2= p
T1+ p
T2, is required to be above 200 GeV. This requirement avoids
instabilities in the NLO cross-section calculations due to the symmetric p
Trequirement
JHEP05(2018)195
The dijet production cross-section is calculated as the ratio of the number of dijet
events after correcting for detector effects, N
dijet, to the integrated luminosity of the data,
in a given interval of the invariant mass and y
∗, ∆m
jjand ∆y
∗respectively:
d
2σ
dm
jjdy
∗=
N
dijetL∆m
jj∆y
∗.
The H
T,2and p
Tselections on the two leading jets determine the lower edge of the
mass range in each y
∗bin. The p
T(m
jj) binning is chosen according to the detector p
T(m
jj) resolution, such that the bin width is approximately twice the p
T(m
jj) resolution,
with the exception of the highest p
T(m
jj) bins in each rapidity (y
∗) range where the
bin width is enlarged to avoid large statistical fluctuations and non-Gaussian statistical
uncertainties due to a low number of entries per bin; as predicted by a MC simulation (see
section
4
).
4
Dataset and Monte Carlo simulations
The measurements use proton-proton collision data at a centre-of-mass energy of
√
s = 13 TeV collected by the ATLAS detector during the 2015 data-taking period of the
LHC. The LHC beams were operated with proton bunches organised in “bunch trains”,
with a bunch spacing of 25 ns. The integrated collected luminosity is 3.2 fb
−1with an
uncertainty of 2.1%. The uncertainty in the luminosity is derived following a methodology
similar to that detailed in ref. [
25
], from a calibration of the luminosity scale using x-y
beam-separation scans performed in August 2015.
Simulated jet events were produced using three different Monte Carlo event
genera-tors for comparisons to data and to derive corrections. The Pythia 8 program (version
8.186 [
26
]) was used for the baseline comparisons, the deconvolution of detector effects and
the propagation of systematic uncertainties. It uses LO pQCD matrix elements for 2 → 2
processes, along with a leading-logarithmic (LL) p
T-ordered parton shower [
27
] including
photon radiation, underlying event
4simulation with multiple parton interactions [
28
], and
hadronisation with the Lund string model [
29
]. The samples were created using a set of
tuned parameters called the A14 tune [
30
] and the NNPDF2.3LO [
31
] LO PDF set. The
EvtGen 1.2.0 program [
32
] was used to model bottom and charm hadron decays. NLO
samples of simulated events were produced using Powheg [
24
,
33
] and showered with
Pythia 8 for systematic studies as discussed in section
6.3
, and for optimising bin widths.
The A14 tune and the CT10 [
34
] PDF set were used. For the evaluation of non-perturbative
effects, the Pythia 8 and Herwig++ [
35
] (v2.7.1 [
36
]) event generators were also employed
as described in section
9.2
.
In all the samples, the effects of multiple proton-proton interactions in the same and
neighbouring bunch crossings (pile-up) were included by overlaying inelastic minimum-bias
events generated with Pythia 8. The generated events were further weighted to reproduce
the observed distribution of the average number of collisions per bunch crossing in data.
The stable particles from the generated events were passed through the ATLAS detector
4
The term underlying event is used to mean particles produced in the same proton-proton collision, but not originating from the primary hard partonic scatter or its products.
JHEP05(2018)195
simulation [
37
] based on Geant4 [
38
] and were reconstructed with the same version of the
ATLAS software as was used to process the data.
5
Event and jet selection
A suite of single-jet triggers [
21
] with thresholds varying from 55 GeV to 360 GeV are used
to record events with at least one jet with transverse energy, E
T, above the threshold in
the region |η| < 3.2. To keep the trigger rate to an acceptable level, the triggers with lower
E
Tthresholds are prescaled by recording only a predefined fraction of events. The
highest-threshold trigger accepts all events passing the highest-threshold. The effective luminosities range
from 81 nb
−1for 75 < p
T< 100 GeV, where the trigger prescaling is largest, to 3.2 fb
−1for
p
T> 442 GeV, where an unprescaled trigger is used.
A p
T-dependent trigger strategy is adopted in order to optimise the statistical power
of the measurement. In the inclusive jet measurement, each p
Tbin requires the trigger
with the lowest prescale (i.e. with highest effective luminosity) that is fully efficient in that
range. Due to the high prescale factors, trigger efficiencies are studied offline in data as
a function of p
Tand rapidity by emulating the online trigger decision. The efficiency for
jets in a given p
Trange is obtained as the fraction of those that pass the emulated trigger
in an unbiased sample obtained by requiring at least one online jet passing the first-level
trigger with E
T> 15 GeV. The trigger efficiency is always larger than 99.9% in the p
Trange where it is considered.
The trigger strategy for the dijet measurement is slightly different to account for
dif-ferent prescale combinations for dijet events in a given (m
jj, y
∗) bin, which can be accepted
by up to two jet triggers depending on the transverse momenta and pseudorapidities of
the leading and sub-leading jets. Each pairing of triggers has a unique corresponding
lu-minosity, which is used to calculate the differential cross section for that pairing. The
separate cross sections from all pairings are then summed to obtain the final measurement.
This strategy is described in detail in ref. [
39
]. It was carefully validated in the previous
dijet analysis [
7
] using dedicated simulation samples containing a complete set of prescaled
triggers, similar to those used in this measurement.
Events are required to have at least one reconstructed vertex with at least two
associ-ated well-reconstructed tracks. The vertex maximising
P p
2T
, where the sum is performed
over the associated tracks, is chosen as the primary vertex. Quality criteria are applied to
reject events with jets from beam-induced background due to proton losses upstream of the
interaction point, cosmic-ray air showers overlapping with collision events and
calorime-ter noise from large-scale coherent noise or isolated pathological cells. These jet cleaning
criteria are described in ref. [
40
].
6
Jet energy calibration and resolution
6.1
Jet reconstruction
The input objects to the jet algorithm are three-dimensional topological clusters
(topoclus-ters) [
41
,
42
] built from the energy deposits in calorimeter cells. A calibration is applied to
the clusters to give the correct response for the energy deposited in electromagnetic showers,
JHEP05(2018)195
while it does not correct for the lower response to hadronic showers. The four-momentum
of a jet is defined as the sum of the four-momenta of its clusters in the calorimeter, treating
each cluster as a four-momentum with zero mass.
6.2
Jet energy calibration
Jets in data and simulation are calibrated following the procedure described in ref. [
43
].
The four-momenta of the jets are recalculated to originate from the hard-scatter vertex
rather than from the centre of the detector. The jet energy is corrected for the effect of
pile-up in both the collision data and simulated events using the methods described in
ref. [
44
]. In addition, a jet energy- and η-dependent correction is applied to reconstructed
jets in data and Monte Carlo (MC) simulation. It is derived from MC simulation and
is designed to lead to agreement in energy and direction between reconstructed jets and
particle jets on average. Further corrections are applied sequentially (Global Sequential
Calibration [
45
]) using five jet substructure variables to reduce effects from fluctuations in
the flavour composition of particles forming the jets and fluctuations in the hadronic shower
caused by interactions of the hadrons with dead material in the calorimeter. Differences in
energy response between data and simulation are evaluated using in situ techniques, where
the p
Tof the jet to be calibrated is balanced against well-measured objects. The full jet
energy scale (JES) calibration procedure and its associated systematic uncertainties are
described in more detail in the following.
Pile-up correction:
jets are corrected for the contributions from additional
proton-proton interactions within the same (in-time) or nearby (out-of-time) bunch crossings [
44
].
First, a correction based on the jet area and the average transverse energy density of the
event is derived [
46
]. The jet area is a measure of the susceptibility of the jet to pile-up
and is determined jet by jet, while the average energy density serves as a measure of the
pile-up activity and is calculated event by event with k
t-jets with a radius parameter value
of R = 0.4. After this correction, some dependence of the average jet p
Ton pile-up
ac-tivity remains. An additional correction is therefore derived by comparing reconstructed
calorimeter jets to particle jets in simulated inclusive jet events. The correction is
param-eterised as a function of the mean number of interactions per bunch crossing, µ, and the
number of reconstructed primary vertices in the event, N
PV, such that both the out-of-time
and in-time effects are taken into account.
The correction for contributions from additional proton-proton interactions can also
remove part of the soft-physics contributions to the jet energy, e.g. that from the underlying
event. This contribution is restored on average by the MC-based jet energy scale correction
discussed below.
Jet energy scale:
this calibration is derived as a function of the energy and
pseudora-pidity of the jet using simulated samples of inclusive jet events. The jet energy and
pseu-dorapidity are corrected for instrumental effects (non-compensating calorimeter response,
energy losses in dead material and out-of-cone effects) so that they agree on average with
the energy and direction of the matching particle jet.
JHEP05(2018)195
Global sequential calibration:
the topology of the energy deposits in the calorimeter
and of the tracks associated with the jets is exploited to correct for fluctuations in the
jet’s particle content [
43
,
45
]. The calibration is based on the number of tracks, on the p
T-weighted average angular distance between the tracks and the calorimeter jet axis, on the
longitudinal extent of the shower in the calorimeter and on the number of track segments in
the muon spectrometer associated with the jet. This correction is performed such that the
jet energy scale is unaltered on average, but the jet energy resolution is improved and the
sensitivity to jet fragmentation effects such as differences between quark- or gluon-induced
jets is reduced.
In situ techniques:
an in situ calibration is derived to correct for remaining differences
between the jet energy response in data and simulation. This correction is calculated using
γ+jet, Z+jet, dijet and multijet p
T-balance techniques [
43
,
47
,
48
]. Up to a jet p
Tof
about 950 GeV, the p
Tbalance between a photon or a Z boson and a jet is exploited.
The multijet p
T-balance technique calibrates high-p
Tjets (300 < p
T< 2000 GeV) recoiling
against a collection of lower-p
Tjets. Beyond 2000 GeV the response is considered constant.
All these corrections are derived for the central jets, with |η| < 1.2. The relative response
of all detector regions is equalised using a p
T-balance method exploiting dijet events
(η-intercalibration) where the two leading jets are in different η-regions.
6.3
Jet energy scale uncertainties
The jet corrections are combined following the procedure described in refs. [
43
,
49
]. The
systematic and statistical uncertainties of each of the above-mentioned calibration steps
contribute to the total JES uncertainty as independent systematic components.
Differences between the calorimeter responses to jets initiated by quarks or gluons and
a lack of knowledge of the flavour composition of the analysed data lead to additional
uncertainties. In order to reduce this contribution, Pythia 8 and Powheg+Pythia 8
Monte Carlo simulations are used to estimate the flavour composition of the sample as a
function of p
Tand rapidity. The result from Pythia 8 is taken as the nominal quark/gluon
composition, and the difference between the two simulations as an estimate of the
compo-sition uncertainty.
A systematic uncertainty is also considered for the muon-segment-based correction,
derived as the maximum difference in the jet response between data and MC dijet events
as a function of the number of muon segments [
45
].
An uncertainty in the jet energy scale at high-p
T, for jets where in situ methods cannot
be used, is derived from single-particle response measurements [
50
].
Four uncertainties are included to account for potential mismodelling of pile-up in the
MC simulation: the number of reconstructed primary vertices, N
PV, the average number of
interactions per bunch crossing, µ, the energy density in jets and the residual dependence
of the jet p
Ton pile-up. The description and evaluation of the pile-up uncertainties are
described in detail in refs. [
43
,
44
].
The measurements presented in this paper use the most detailed description of the
systematic uncertainties considered in ATLAS. There are, in total, 76 independent sources
JHEP05(2018)195
of systematic uncertainty treated as being uncorrelated among each other [
43
]. All of these
are treated as being fully correlated across p
Tand η, with the exception of the statistical
uncertainty of the η-intercalibration which is propagated as being uncorrelated between
the 245 different η and p
Tbins in which it was derived [
43
,
47
]. The JES uncertainty is
1% in the 200 − 600 GeV range of jet p
T, 2% at 2 TeV, and reaches 3% above 3 TeV. The
uncertainty is fairly constant as a function of η and reaches 2.5% at 80 GeV for the most
forward jets [
43
].
6.4
Jet energy resolution and its uncertainties
The fractional uncertainty in the jet p
Tresolution (JER) is derived using the data collected
during 2012. It is obtained in situ from the standard deviation of the ratio of the p
Tof
a jet to the p
Tof other well-measured objects (a photon or a Z boson [
47
,
48
]) in an
event, following techniques similar to those used to determine the JES uncertainty. The
p
T-balance technique in dijet events (η-intercalibration) [
47
] allows a measurement of the
JER at high jet rapidities and for a wide range of transverse momenta. Noise from the
calorimeter electronics and pile-up forms a significant component of the JER at low p
T.
A study in zero-bias data
5allows this contribution to be constrained.
In addition, a
MC simulation is used in each in situ JER to correct for fluctuations present at particle
level due to the underlying event and out-of-cone contributions from QCD radiation and
hadronisation. The results from all these methods are combined in a way similar to that
for the JES [
49
].
The JER uncertainty has in total 11 components. Eight of these components are
obtained by combining the systematic uncertainties associated to the in situ methods. One
component is the uncertainty due to the electronic and pile-up noise measurement. Another
is the absolute JER difference between data and MC simulation as determined with the in
situ methods. Finally, the JER uncertainties are completed with an extra component to
account for the differences between the 2012 and 2015 data-taking conditions [
51
]. Each
JER systematic component describes an uncertainty that is taken to be fully correlated in
jet p
Tand η. The 11 JER components are treated as fully uncorrelated with each other.
6.5
Jet angular resolution and its uncertainties
The jet angular resolution (JAR) is estimated in MC simulation from the differences in
rapidity and azimuthal angle between reconstructed jets and matching particle jets. This
estimate is validated by comparing the standard jets built from calorimeter energy deposits
to those built from tracks in the inner detector [
41
,
52
]. From these studies, the JAR
is assigned an uncertainty of 10% to account for possible differences between data and
MC simulation.
5The zero-bias sample contains data collected by recording events exactly one accelerator turn after a
high pTfirst-level calorimeter trigger. These events will thus be contained in a random filled bunch collision
JHEP05(2018)195
7
Unfolding of detector effects
The reconstructed jet spectra in data are corrected for detector inefficiencies and resolution
effects to obtain inclusive jet and dijet cross-sections that refer to the stable particles
entering the detector. The unfolding of the detector resolution in jet p
Tis based on a
modified Bayesian technique, the iterative dynamically stabilised (IDS) method [
53
]. This
unfolding method uses a transfer matrix constructed using samples of simulated events,
which describes the migrations of jets (events) across p
T(m
jj) bins between particle level
jets and reconstructed level jets. For the inclusive jet measurement, the transfer matrix is
filled jet by jet by matching a particle jet with a reconstruction level jet, when both are
closer to each other than to any other jet, lie within a radius of R = 0.3, have p
T> 75 GeV
and belong to the same rapidity bin. For the dijet case, the transfer matrix is filled event
by event with those events that lie in the same y
∗bin and pass the selection requirements
at both the reconstruction and the particle levels.
The unfolding technique is performed in three steps, correcting for the matching
im-purity at the reconstruction level, the smearing of matched jets (events) between p
T(m
jj)
bins, and the matching inefficiency at the particle level,
N
ipart=
X
k
N
kreco· P
k· U
ik/ E
i,
where i and k are the p
T(m
jj) bin indices of the jets (events) at the particle and
recon-struction levels and N
partand N
recoare the numbers of particle level and reconstruction
level jets (events) in a given bin. The symbols P and E denote respectively the matching
purity and the matching efficiency. The symbol U denotes the unfolding matrix, where
U
ikdescribes the probability for a jet (event) at reconstruction level in p
T(m
jj) bin k to
originate from the particle level in p
T(m
jj) bin i.
For the inclusive jet cross-section measurements, the matching purity, P
k, is defined
as the fraction of reconstruction level jets that are matched to a particle level jet for a
given p
Tbin k. The matching efficiency, E
i, is defined as the fraction of particle level jets
that are matched to a reconstruction level jet for a given p
Tbin i. If matched particle
and reconstructed jets are in different rapidity bins then they are reassigned as being
unmatched. For dijets, the efficiency (purity) is defined as the fraction of events passing
the selection cuts at the particle (reconstruction) level for a given y
∗bin that also pass
the selection cuts and lie in the same y
∗bin at the reconstruction (particle) level. In this
way the migrations across jet |y| and dijet y
∗bins are effectively taken into account by
bin-to-bin corrections. The jet matching efficiency is 98% (96%) at p
T= 100 GeV for low
(high) jet rapidity, and reaches 99.7% at high p
T. The event dijet efficiency is 97% (85%)
at m
jj= 300 GeV (m
jj= 1700 GeV) for low (high) y
∗, and reaches 99.7% at the highest
dijet mass.
The unfolding matrix U depends on the details of the MC model, given that the
transfer matrix is used to build it. This model improves when iterated, where the number
of iterations is chosen such that the residual bias is within a tolerance of 1% in the bins with
less than 10% statistical uncertainty. The residual bias is evaluated through a data-driven
JHEP05(2018)195
closure test [
53
,
54
], in which the particle level spectrum in the MC simulation is reweighted
to improve agreement between data and reweighted MC events in the reconstruction level
spectra. The ratio of the spectra unfolded with reweighted and nominal MC simulation
provides an estimate of the unfolding bias. In these measurements only one iteration is
used, achieving an uncertainty bias of the order of a few per mille, except at high p
T(∼ 1 TeV) and high rapidity where it increases to 5%.
8
Propagation of the uncertainties to the cross-sections
The statistical uncertainties are propagated through the unfolding procedure using an
en-semble of 1000 pseudo-experiments. Each pseudo-experiment is constructed by reweighting
each event in data and simulation according to a Poisson distribution with expectation
value equal to one. This procedure preserves the correlations between jets produced in
the same event. The unfolding is performed for each pseudo-experiment and a
covari-ance matrix is constructed for the cross-section in each |y| or y
∗bin. The total statistical
uncertainty is obtained from the covariance matrix, where bin-to-bin correlations are also
encoded. The separate contributions from the data and from the MC statistics are obtained
from the same procedure by reweighting either the data or the simulated events.
All components of the JES uncertainty (see section
6
) are propagated through the
unfolding procedure using pseudo-data (MC simulations) to avoid the impact of the larger
statistical fluctuations in data. The jet p
Tin pseudo-data is scaled up and down by one
standard deviation of each component. This procedure takes into account the correlations
between various phase-space regions. The resulting pseudo-data spectra are unfolded for
detector effects using the nominal unfolding matrix. The difference between the nominal
unfolded cross-section and the systematically shifted unfolded cross-section is taken as a
systematic uncertainty. The jet energy scale is the dominant uncertainty for p
T< 2500 GeV
(p
T< 700 GeV) in the first (last) rapidity bin for the inclusive jet measurement, and for
m
jj< 4000 GeV in the first y
∗bin for the dijet mass measurement. In the
complemen-tary regions, including the whole m
jjrange for the last y
∗bin, the dominant source of
uncertainty is the limited size of the sample.
The uncertainty in the JER is the second largest individual source of systematic
un-certainty. There are 11 components, some of which can involve a JER degradation in part
of p
T− η phase-space and a JER improvement in the complementary part, which allows
(anti-)correlations to be accounted for. The effect of each of the components is evaluated
by smearing the energy of the reconstructed jets. The degradation of the JER is achieved
by smearing the reconstructed jets in the relevant phase space region in the MC simulation
used as pseudo-data. On the other hand, an effective improvement of the JER is achieved
by smearing the energy of the jets in the MC simulation used in constructing the transfer
matrix. The difference between the modified spectrum unfolded with the systematically
varied transfer matrix to the nominal spectrum unfolded with the nominal transfer matrix
is taken as a systematic uncertainty.
An uncertainty for the jet cleaning procedure described in section
5
is estimated by
measuring in situ the jet selection efficiency.
JHEP05(2018)195
The uncertainty in the luminosity measurement of 2.1% is propagated as being
corre-lated across all measurement bins.
An uncertainty in the beam energy of 0.1% [
55
] is considered when comparing data
with the theory prediction at a fixed beam energy. The induced uncertainty at the
cross-section level is evaluated by comparing the theory predictions at the nominal and shifted
beam energies. For the inclusive jet measurement, it amounts for 0.2% at low p
Tand 0.9%
at high p
Tin the central region and rises to 2% at the highest p
Tand high rapidity. In the
dijet measurement, this uncertainty is 0.2% at low m
jjand 0.8% at high m
jjin the first
y
∗bin and reaches 1% at the highest m
jjand in the last y
∗bin.
In order to assess the statistical precision of the systematic uncertainty estimates, each
component is re-evaluated using a set of pseudo-experiments. The statistical fluctuations
of the systematic uncertainty estimates are minimised using a smoothing procedure. To
achieve this, for each component, the p
T(m
jj) bins are combined until the propagated
uncertainty value in the bin has a Gaussian statistical significance larger than two standard
deviations. A Gaussian kernel smoothing [
52
] is used to obtain the values in the original
fine bins.
Figure
1
shows the individual components of the systematic uncertainties added in
quadrature for the inclusive jet and dijet cross-section measurements in representative
phase-space regions. In the central (forward) region the total uncertainty in the inclusive
jet measurement is about 5% (8%) at medium p
Tof 300–600 GeV. The uncertainty increases
towards both lower and higher pT reaching 6% (10%) at low p
Tand 30% ([-45%,+40%])
at high p
T.
The total uncertainty in the dijet measurement is about 5% (10%) at medium m
jjof
500–1000 GeV (2000–3000 GeV) in the first (last) y
∗bin. The uncertainty increases towards
both lower and higher m
jjreaching 6% at low m
jjand 30% at high m
jjin the first y
∗bin.
In the last y
∗bin no significant dependence on m
jjis observed.
9
Theoretical predictions
Theoretical predictions of the cross-sections are obtained using NLO and NNLO pQCD
calculations with corrections for non-perturbative and electroweak effects.
9.1
Next-to-leading-order pQCD calculations
The NLO pQCD predictions are calculated using NLOJET++ 4.1.3 [
56
] interfaced to
APPLGRID [
57
] for fast and flexible calculations with various PDF sets and various values
of the renormalisation and factorisation scales. The inclusive jet cross-section prediction
is calculated using p
maxT, the transverse momentum of the leading jet in the event, as the
renormalisation scale, µ
R, and the factorisation scale, µ
F. An alternative scale choice,
µ
R= µ
F= p
jetT, the p
Tof each individual jet that enters the cross-section calculation, is
also considered. This scale choice is proposed in ref. [
58
]. Both scale choices were used in
the previous ATLAS analysis at
√
s = 8 TeV [
11
]. For the dijet cross-section calculation the
scale choice is µ
R= µ
F= p
maxTexp(0.3y
∗
), as suggested in ref. [
59
] and previously used in
JHEP05(2018)195
[GeV] T p 2 10 102 × 2 103 103 × 2 Relative uncertainty 0.4 − 0.2 − 0 0.2 0.40.6 Total Sys. UncertaintyJet Energy Scale
Jet Energy Resolution Other Stat. Uncertainty ATLAS s = 13 TeV, 81 nb-1 - 3.2 fb-1 anti-kt R=0.4 |y| < 0.5
(a) Inclusive jet
[GeV] T p 2 10 102 × 2 102 × 3 Relative uncertainty 0.4 − 0.2 − 0 0.2 0.4
0.6 Total Sys. UncertaintyJet Energy Scale
Jet Energy Resolution Other Stat. Uncertainty ATLAS s = 13 TeV, 81 nb-1 - 3.2 fb-1 anti-kt R=0.4 2.5 ≤ |y| < 3.0 (b) Inclusive jet [GeV] jj m 2 10 × 3 103 103 × 2 Relative uncertainty 0.4 − 0.2 − 0 0.2 0.4
0.6 Total Sys. UncertaintyJet Energy Scale
Jet Energy Resolution Other Stat. Uncertainty ATLAS s = 13 TeV, 81 nb-1 - 3.2 fb-1 anti-kt R=0.4 y* < 0.5 (c) Dijet [GeV] jj m 3 10 × 2 103 × 3 103 × 4 104 Relative uncertainty 0.4 − 0.2 − 0 0.2 0.4
0.6 Total Sys. UncertaintyJet Energy Scale
Jet Energy Resolution Other Stat. Uncertainty ATLAS s = 13 TeV, 81 nb-1 - 3.2 fb-1 anti-kt R=0.4 2.5 ≤ y* < 3.0 (d) Dijet
Figure 1. Relative systematic uncertainty for the inclusive jet cross-section as a function of the jet pTfor the first and last rapidity bins ((a) and (b) respectively) and for the dijet cross-section as a
function of mjj for the first and last y∗bins ((c) and (d) respectively). The individual uncertainties
are shown in different colours: the jet energy scale, jet energy resolution and the other uncertainties (jet cleaning, luminosity and unfolding bias). The total systematic uncertainty, calculated by adding the individual uncertainties in quadrature, is shown as a green line. The statistical uncertainty is shown as vertical black lines.
provided by the LHAPDF6 [
60
] library: the NLO CT14 [
61
], MMHT 2014 [
62
], NNPDF
3.0 [
63
], and HERAPDF 2.0 [
64
] sets, and the NNLO ABMP16 [
65
] set. The value of the
strong coupling constant, α
s, is taken from the corresponding PDF set.
The main uncertainties in the NLO predictions come from uncertainties associated
with the PDFs, the choice of renormalisation and factorisation scales, and the uncertainty
in the value of α
s. PDF uncertainties are defined at the 68% CL and propagated through
the calculations following the prescription given for each PDF set, as recommended by
the PDF4LHC group for PDF-sensitive analyses [
66
]. Calculations are redone with varied
renormalisation and factorisation scales to estimate the uncertainty due to missing
higher-order terms in the pQCD expansion. The nominal scales are independently varied up or
down by a factor of two in both directions excluding opposite variations of µ
Rand µ
F.
The envelope of resulting variations of the prediction is taken as the scale uncertainty.
The difference between the predictions obtained with the p
maxTand the p
jetTscale choice is
JHEP05(2018)195
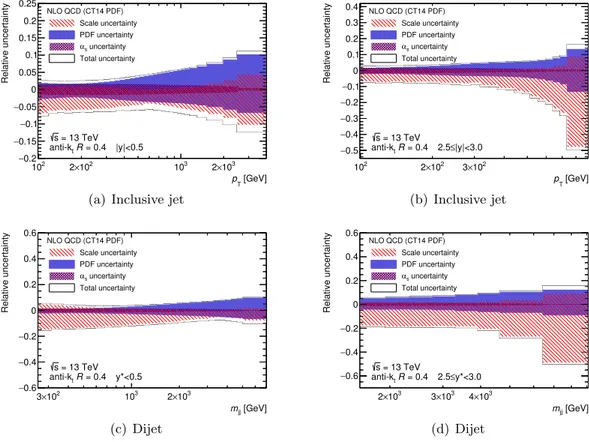
[GeV] T p 2 10 2×10² 103 2×10³ Relative uncertainty 0.2 − 0.15 − 0.1 − 0.05 − 0 0.05 0.1 0.15 0.2 0.25 NLO QCD (CT14 PDF) Scale uncertainty PDF uncertainty uncertainty s α Total uncertainty = 13 TeV s = 0.4 R t anti-k |y|<0.5(a) Inclusive jet
[GeV] T p 2 10 2×10² 3×10² Relative uncertainty 0.5 − 0.4 − 0.3 − 0.2 − 0.1 − 0 0.1 0.2 0.3 0.4 NLO QCD (CT14 PDF) Scale uncertainty PDF uncertainty uncertainty s α Total uncertainty = 13 TeV s = 0.4 R t anti-k 2.5≤|y|<3.0 (b) Inclusive jet [GeV] jj m 2 10 × 3 103 2×10³ Relative uncertainty 0.6 − 0.4 − 0.2 − 0 0.2 0.4 0.6 NLO QCD (CT14 PDF) Scale uncertainty PDF uncertainty uncertainty s α Total uncertainty = 13 TeV s = 0.4 R t anti-k y*<0.5 (c) Dijet [GeV] jj m 3 10 × 2 3×10³ 4×10³ Relative uncertainty 0.6 − 0.4 − 0.2 − 0 0.2 0.4 0.6 NLO QCD (CT14 PDF) Scale uncertainty PDF uncertainty uncertainty s α Total uncertainty = 13 TeV s = 0.4 R t anti-k 2.5≤y*<3.0 (d) Dijet
Figure 2. Relative NLO QCD uncertainties in the jet cross-sections calculated using the CT14 PDF set. Panels a,b (c,d) correspond respectively to the first and last |y| (y∗) bins for the inclusive jet (dijet) measurement. The uncertainties due to the renormalisation and factorisation scale, the αs, the PDF and the total uncertainty are shown. The total uncertainty, calculated by adding the
individual uncertainties in quadrature, is shown as a black line.
treated as an additional uncertainty. The uncertainty from α
sis evaluated by calculating
the cross-sections using two PDF sets that differ only in the value of α
sused and then
scaling the cross-section difference corresponding to an α
suncertainty ∆α
s= 0.0015 as
recommended in ref. [
66
].
The uncertainties in the NLO QCD cross-section predictions obtained with the CT14
PDF set are shown in figure
2
for representative phase-space regions. The uncertainty due
to the choice of renormalisation and factorisation scale is dominant in most phase-space
regions, rising from 10% (20%) at about p
T= 100 GeV (m
jj= 300 GeV) in the central
rapidity (y
∗) bin to about 50% in the highest p
T(m
jj) bins in the most forward rapidity
(large y
∗) region. The PDF uncertainties vary from 2% to 12% depending on the jet p
Tand rapidity (m
jjand y
∗). The contribution from the α
suncertainty is about 2% at low
p
T(m
jj) and negligible for the highest p
T(m
jj) bin in each rapidity (y
∗) range.
9.2
Non-perturbative corrections
Non-perturbative corrections are applied to the parton-level cross-sections from the NLO
pQCD calculations. The correction factors are calculated using LO MC event generators, as
JHEP05(2018)195
CTEQ6L1 [67] CTEQ6L1 [67] MSTW2008LO [68] CT10 NNPDF2.3LO NNPDF2.3LO CTEQ6L1 [67] Pythia 8 4C [69] AU2 [70] A14 [30] AU2 [70] MONASH [71] A14 [30] A14 [30] Herwig++ UE-EE-5 [72,73] UE-EE-4 [72,73] UE-EE-5 [72,73]
Table 1. Summary of the soft-physics model tunes used for the evaluation of the non-perturbative corrections for each event generator and PDF set.
the bin-by-bin ratio of the nominal particle-level MC cross-sections to the MC cross-section
derived from the partons remaining after showering, when the modelling of hadronisation
and the underlying event are switched off. The correction factors are evaluated using
several event generators and tunes, which are listed in table
1
. The baseline correction is
taken from Pythia 8 using the A14 tune with the NNPDF2.3 LO PDF set. The envelope
of all corrections is considered as a systematic uncertainty.
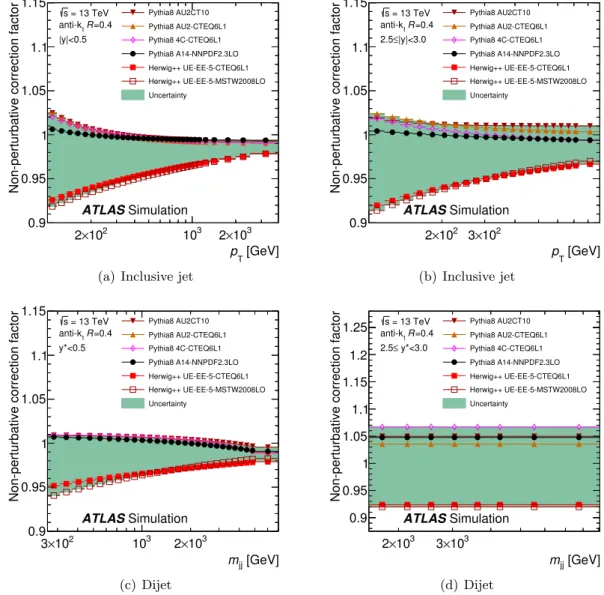
The correction factors for a set of representative event generators and tunes for the
inclusive jet (dijet) cross-section are shown in figure
3
in illustrative |y| (y
∗) bins as a
function of p
T(m
jj). The values of the correction are in the range 0.92-1.03 at low p
Tand 0.98-0.99 (0.97-1.01) at high p
Tfor the first (last) rapidity bin in the inclusive jet
measurement, and 0.94-1.01 (0.98-0.99) at low (high) m
jjfor the first y
∗bin. For the last
y
∗bin in the dijet measurement, a fixed range 0.92-1.07 is conservatively taken for all m
jjbins due to lack of statistical precision at large m
jj.
9.3
Electroweak corrections
The NLO pQCD predictions are corrected for the effects of γ and W
±/Z interactions
at tree and one-loop level. They are derived using an NLO calculation of electroweak
(EW) contributions to the LO pQCD process. The correction is defined as the ratio of a
2 → 2 calculation including tree-level effects of order α
s2, α
2, and α
sα (from interference
of QCD and EW diagrams), plus weak loop corrections of order α
2sα to the LO QCD
2 → 2 calculation.
The correction factors are derived in the phase space considered for the measurements
presented here and were provided by the authors of ref. [
74
]. No uncertainty associated
with these corrections is presently estimated.
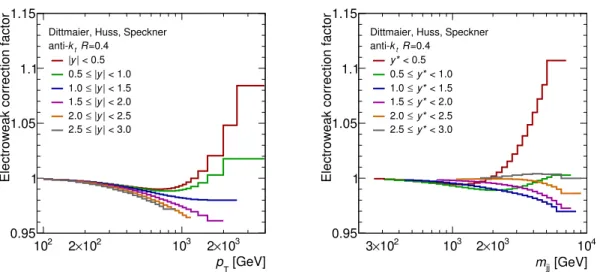
The electroweak correction factors for the inclusive jet (dijet) cross-section as a function
of the jet p
T(event m
jj) in bins of |y| (y
∗) are shown in figure
4
. The electroweak correction
is small for low jet transverse momenta and for low m
jj. The correction reaches 8% at the
highest p
T(3 TeV) for the central |y| bin and is less than 4% for the rest of the |y| bins.
For dijets, the electroweak correction reaches 11% at m
jj= 7 TeV for the central y
∗bin.
For the rest of the y
∗bins the correction is less than 3%.
9.4
Next-to-next-to-leading-order pQCD calculations
The NNLO pQCD predictions were provided by the authors of refs. [
17
,
18
] using the
NNLOJET program and the MMHT 2014 NNLO PDF set for two different choices of
the µ
Rand µ
Fscales, respectively p
jetTand p
maxT. The non-perturbative and electroweak
JHEP05(2018)195
[GeV] T p 2 10 × 2 103 2×10³Non-perturbative correction factor
0.9 0.95 1 1.05 1.1 1.15 Pythia8 AU2CT10 Pythia8 AU2-CTEQ6L1 Pythia8 4C-CTEQ6L1 Pythia8 A14-NNPDF2.3LO Herwig++ UE-EE-5-CTEQ6L1 Herwig++ UE-EE-5-MSTW2008LO Uncertainty = 13 TeV s =0.4 R t anti-k |y|<0.5 ATLAS Simulation
(a) Inclusive jet
[GeV] T p 2 10 × 2 3×10²
Non-perturbative correction factor
0.9 0.95 1 1.05 1.1 1.15 Pythia8 AU2CT10 Pythia8 AU2-CTEQ6L1 Pythia8 4C-CTEQ6L1 Pythia8 A14-NNPDF2.3LO Herwig++ UE-EE-5-CTEQ6L1 Herwig++ UE-EE-5-MSTW2008LO Uncertainty = 13 TeV s =0.4 R t anti-k |y|<3.0 ≤ 2.5 ATLAS Simulation (b) Inclusive jet [GeV] jj m 2 10 × 3 103 2×10³
Non-perturbative correction factor
0.9 0.95 1 1.05 1.1 1.15 Pythia8 AU2CT10 Pythia8 AU2-CTEQ6L1 Pythia8 4C-CTEQ6L1 Pythia8 A14-NNPDF2.3LO Herwig++ UE-EE-5-CTEQ6L1 Herwig++ UE-EE-5-MSTW2008LO Uncertainty = 13 TeV s =0.4 R t anti-k y*<0.5 ATLAS Simulation (c) Dijet [GeV] jj m 3 10 × 2 3×10³
Non-perturbative correction factor
0.9 0.95 1 1.05 1.1 1.15 1.2 1.25 Pythia8 AU2CT10 Pythia8 AU2-CTEQ6L1 Pythia8 4C-CTEQ6L1 Pythia8 A14-NNPDF2.3LO Herwig++ UE-EE-5-CTEQ6L1 Herwig++ UE-EE-5-MSTW2008LO Uncertainty = 13 TeV s =0.4 R t anti-k y*<3.0 ≤ 2.5 ATLAS Simulation (d) Dijet
Figure 3. Non-perturbative correction factors for the (inclusive jet, dijet) NLO pQCD prediction as a function of (jet pT, mjj) for ((a), (c)) the first (rapidity, y∗) bin and for ((b), (d)) the last (rapidity,
y∗) bin. The corrections are derived using Pythia 8 with the A14 tune with the NNPDF2.3 LO PDF set. The envelope of all MC configuration variations is shown as a band.
In addition to the statistical uncertainties on the calculations, which are larger for higher
p
Tand high rapidities, two sources of uncertainty are considered in this NNLO calculation:
the scale uncertainty and the systematic uncertainty in the non-perturbative correction.
To obtain the scale uncertainty, both scales (renormalisation and factorisation) are varied
simultaneously by a factor of 0.5 or 2.
6If both variations yield changes with the same sign,
the scale uncertainty is obtained from the larger change.
6A different approach to estimate the scale uncertainty was used for NNLO due to computing time
limitations. At NLO the simultaneous variations are not always the dominant ones, although they are at high pT.
JHEP05(2018)195
[GeV] T p 2 10 2×10² 103 2×10³Electroweak correction factor
0.95 1 1.05 1.1 1.15
Dittmaier, Huss, Speckner =0.4 R t k anti-| < 0.5 y | | < 1.0 y | ≤ 0.5 | < 1.5 y | ≤ 1.0 | < 2.0 y | ≤ 1.5 | < 2.5 y | ≤ 2.0 | < 3.0 y | ≤ 2.5 [GeV] jj m 2 10 × 3 103 2×10³ 104
Electroweak correction factor
0.95 1 1.05 1.1 1.15
Dittmaier, Huss, Speckner =0.4 R t k < 0.5 y* < 1.0 y* ≤ 0.5 < 1.5 y* ≤ 1.0 < 2.0 y* ≤ 1.5 < 2.5 y* ≤ 2.0 < 3.0 y* ≤ 2.5
Figure 4. Electroweak correction factors for the inclusive jet (dijet) cross-section as a function of the jet pT (mjj) for all |y| (y∗) bins.
10
Results
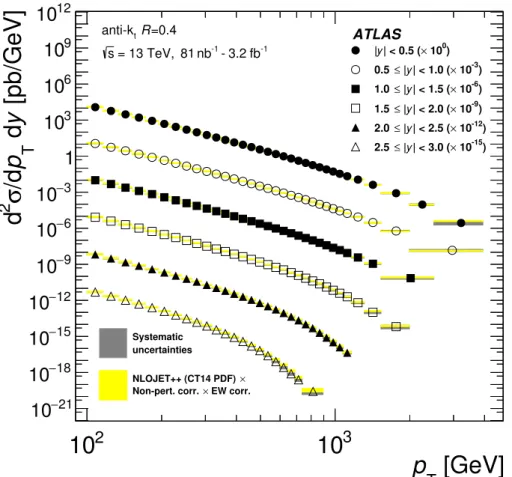
The measured double-differential inclusive jet cross-sections are shown in figure
5
as a
function of p
Tfor the six jet rapidity bins, and the measured double-differential dijet
cross-sections are shown in figure
6
as a function of m
jjfor the six y
∗bins. The measurements
respectively cover the jet p
Trange from 100 GeV to 3.5 TeV for |y| < 3.0, and the m
jjrange from 300 GeV to 9 TeV for y
∗< 3.0, thus attaining a significantly higher reach than
the previous ATLAS measurements [
11
,
75
,
76
]. The NLO pQCD predictions using the
CT14 PDF set corrected for non-perturbative and electroweak effects are also shown in
both figures.
The ratios of the NLO pQCD predictions to the measured inclusive jet cross-sections
as a function of p
Tin the six jet rapidity bins are shown in figure
7
(figure
8
) for the CT14,
MMHT 2014 and NNPDF 3.0 (CT14, ABMP16 and HERAPDF 2.0) PDF sets. The CT14
case is repeated in both figures to serve as a reference for comparison. No significant
deviation of the data points from the predictions is seen; the NLO pQCD predictions
and data agree within uncertainties. This behaviour is compatible with the results of the
comparison between data and the pQCD predictions in the previous ATLAS measurement
at
√
s = 8 TeV [
11
]. In the forward region (|y| > 2) there is a tendency for the NLO pQCD
prediction using the CT14, MMHT 2014 and NNPDF 3.0 PDF sets to overestimate the
measured cross-section in the high p
Trange, although the difference from data does not
exceed the range covered by the experimental and theoretical uncertainties.
The ratios of the NLO pQCD predictions to the measured dijet cross-sections as a
function of m
jjin the six y
∗bins are shown in figures
9
and
10
. No significant deviation
of the data points from the predictions is seen, the NLO pQCD predictions and data agree
within uncertainties.
The ratios of the NNLO pQCD predictions to the measured inclusive jet cross-sections
as a function of p
Tin the six jet rapidity bins are shown in figures
11
and
12
for the
JHEP05(2018)195
[GeV]
T
p
2
10
10
3
[pb/GeV]
y
d
T
p
/d
σ
2
d
21 −10
18 −10
15 −10
12 −10
9 −10
6 −10
3 −10
1
310
610
910
1210
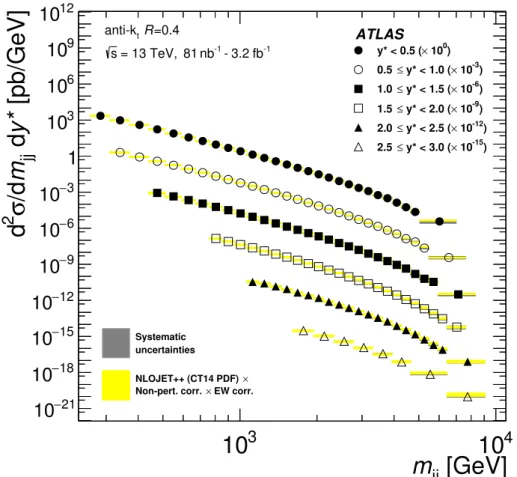
201803290937 ATLAS -1 fb 3.2 --1 nb 81 = 13 TeV, s =0.4 R t anti-k uncertainties Systematic EW corr. × Non-pert. corr. × NLOJET++ (CT14 PDF) ) 0 10 × | < 0.5 ( y | ) -3 10 × | < 1.0 ( y | ≤ 0.5 ) -6 10 × | < 1.5 ( y | ≤ 1.0 ) -9 10 × | < 2.0 ( y | ≤ 1.5 ) -12 10 × | < 2.5 ( y | ≤ 2.0 ) -15 10 × | < 3.0 ( y | ≤ 2.5Figure 5. Inclusive jet cross-sections as a function of pT and |y|, for anti-kt jets with R = 0.4.
The statistical uncertainties are smaller than the size of the symbols used to plot the cross-section values. The dark gray shaded areas indicate the experimental systematic uncertainties. The data are compared to NLO pQCD predictions calculated using NLOJET++ with pmax
T as the QCD
scale and the CT14 NLO PDF set, to which non-perturbative and electroweak corrections are applied. The light gray (yellow in the online version) shaded areas indicate the predictions with their uncertainties. At low and intermediate pTbins the experimental systematic uncertainties are
comparable to the theory uncertainties (drawn on top) and therefore are barely visible.
two different scale choices, respectively p
jetTand p
maxT, together with the NLO case for
comparison. When using p
jetTas a scale, the NNLO pQCD predictions describe the data
within uncertainties, with the exception of the forward (|y| > 2) high p
Trange where it
tends to overestimate the measured cross-section. The predictions using p
maxTas the scale
overestimate the measured cross-section.
The NLO pQCD predictions, corrected for non-perturbative and electroweak effects,
are quantitatively compared to the measurement using the method described in ref. [
76
].
The χ
2value and the corresponding observed p-value, P
obs, are computed taking into
account the asymmetries and the (anti-)correlations of the experimental and theoretical
uncertainties. The individual experimental and theoretical uncertainty components are
assumed to be uncorrelated among each other and fully correlated across the p
Tand |y|
JHEP05(2018)195
[GeV]
jj
m
3
10
10
4
[pb/GeV]
y*
d
jj
m
/d
σ
2
d
21 −10
18 −10
15 −10
12 −10
9 −10
6 −10
3 −10
1
310
610
910
1210
201803290937 ATLAS -1 fb 3.2 --1 nb 81 = 13 TeV, s =0.4 R t anti-k uncertainties Systematic EW corr. × Non-pert. corr. × NLOJET++ (CT14 PDF) ) 0 10 × y* < 0.5 ( ) -3 10 × y* < 1.0 ( ≤ 0.5 ) -6 10 × y* < 1.5 ( ≤ 1.0 ) -9 10 × y* < 2.0 ( ≤ 1.5 ) -12 10 × y* < 2.5 ( ≤ 2.0 ) -15 10 × y* < 3.0 ( ≤ 2.5Figure 6. Dijet cross-sections as a function of mjj and y∗, for anti-kt jets with R = 0.4. The
statistical uncertainties are smaller than the size of the symbols used to plot the cross-section values. The dark gray shaded areas indicate the experimental systematic uncertainties. The data are compared to NLO pQCD predictions calculated using NLOJET++ with pmax
T exp(0.3y
∗) as the
QCD scale and the CT14 NLO PDF set, to which non-perturbative and electroweak corrections are applied. The light gray (yellow in the online version) shaded areas indicate the predictions with their uncertainties. In most mjj bins the experimental systematic uncertainty is smaller than the
theory uncertainties and is therefore not visible.
(m
jjand y
∗for dijets) bins. The correlations of the statistical uncertainties across different
phase-space regions are taken into account using covariance matrices derived from 1000
pseudo-experiments obtained by fluctuating the data and the MC simulation (see section
8
).
For the theoretical prediction and separately for each scale choice (p
maxTand p
jetT), the
uncertainties related to the scale variations, the PDF eigenvectors, the non-perturbative
corrections and the strong coupling constant are treated as additional uncertainty
compo-nents. In the case of the NNPDF 3.0 PDF set, the replicas [
63
] are used to evaluate a
covariance matrix, from which the eigenvectors are then determined.
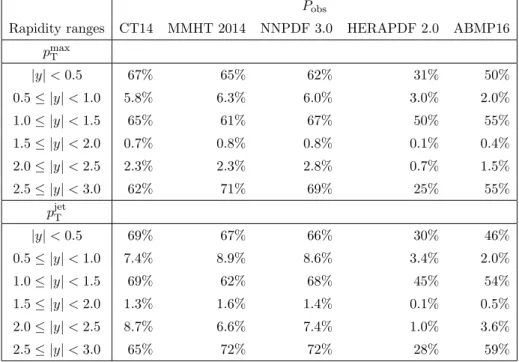
Table
2
shows the summary of the observed P
obsvalues for each individual rapidity bin
of the inclusive jet measurement. Table
3
reports the results obtained from a global fit to
all the p
Tand rapidity bins of the measurement. Given that in this case the observed P
obsJHEP05(2018)195
[GeV] T p 2 10 2×10² 103 103 × 2 0.8 0.9 1 1.1 1.2 1.0≤|y|<1.5 3 3 0.8 0.9 1 1.1 1.2 0.5≤|y|<1.0 Theory/Data 0.6 0.8 1 1.2 1.4 1.6 |y|<0.5 [GeV] T p 2 10 2×10² 103 103 × 2 0.5 1 1.5 2 2.5 2.5≤|y|<3.0 3 3 0.6 0.8 1 1.2 1.4 1.6 2.0≤|y|<2.5 Theory/Data 0.6 0.8 1 1.2 1.4 1.5≤|y|<2.0ATLAS
-1 fb 3.2 --1 nb 81 = L = 13 TeV s =0.4 R t anti-k Data NLO QCD NP k ⊗ EW k ⊗ max T p = F µ = R µ CT14 MMHT 2014 NNPDF 3.0Figure 7. Comparison of the measured inclusive jet cross-sections and the NLO pQCD predictions shown as the ratios of predictions to the measured cross-sections. The ratios are shown as a function of the jet pT in six |y| bins for anti-kt jets with R = 0.4. The predictions are calculated
using NLOJET++ with three different PDF sets (CT14, MMHT 2014, NNPDF 3.0) and non-perturbative and electroweak corrections are applied. The uncertainties of the predictions, shown by the coloured lines, include all the uncertainties discussed in section9. The grey bands show the total data uncertainty including both the systematic (JES, JER, unfolding, jet cleaning, luminosity) and statistical uncertainties.
[GeV] T p 2 10 2×10² 103 2×10³ 0.8 0.9 1 1.1 1.2 1.0≤|y|<1.5 3 3 0.8 0.9 1 1.1 1.2 0.5≤|y|<1.0 Theory/Data 0.6 0.8 1 1.2 1.4 1.6 |y|<0.5 [GeV] T p 2 10 2×10² 103 2×10³ 0.5 1 1.5 2 2.5 2.5≤|y|<3.0 3 3 0.6 0.8 1 1.2 1.4 1.6 2.0≤|y|<2.5 Theory/Data 0.6 0.8 1 1.2 1.4 1.5≤|y|<2.0
ATLAS
-1 fb 3.2 --1 nb 81 = L = 13 TeV s =0.4 R t anti-k Data NLO QCD NP k ⊗ EW k ⊗ max T p = F µ = R µ CT14 HERAPDF 2.0 ABMP16Figure 8. Comparison of the measured inclusive jet cross-sections and the NLO pQCD predictions shown as the ratios of predictions to the measured cross-sections. The ratios are shown as a function of the jet pT in six |y| bins for anti-kt jets with R = 0.4. The predictions are calculated
using NLOJET++ with three different PDF sets (CT14, HERAPDF 2.0, ABMP16) and non-perturbative and electroweak corrections are applied. The uncertainties of the predictions, shown by the coloured lines, include all the uncertainties discussed in section9. The grey bands show the total data uncertainty including both the systematic (JES, JER, unfolding, jet cleaning, luminosity) and statistical uncertainties.
JHEP05(2018)195
[GeV] jj m 2 10 × 3 103 2×10³ 104 0.6 0.8 1 1.2 1.4 1.0≤ y*<1.5 3 3 0.6 0.8 1 1.2 1.4 0.5≤ y*<1.0 Theory/Data 0.6 0.8 1 1.2 1.4 y*<0.5 [GeV] jj m 2 10 × 7 103 2×10³ 104 0.5 1 1.5 2 2.5≤3 y*<3.0 3 0.8 1 1.2 1.4 1.6 2.0≤ y*<2.5 Theory/Data 0.6 0.8 1 1.2 1.4 1.5≤ y*<2.0ATLAS
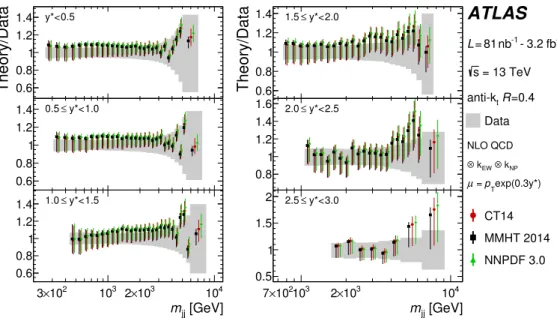
-1 fb 3.2 --1 nb 81 = L = 13 TeV s =0.4 R t anti-k Data NLO QCD NP k ⊗ EW k ⊗ exp(0.3y*) T p = µ CT14 MMHT 2014 NNPDF 3.0Figure 9. Comparison of the measured dijet cross-sections and the NLO pQCD predictions shown as the ratios of predictions to the measured cross-sections. The ratios are shown as a function of the jet mjj in six y∗ bins for anti-kt jets with R = 0.4. The predictions are calculated using
NLOJET++ with three different PDF sets (CT14, MMHT 2014, NNPDF 3.0) and non-perturbative and electroweak corrections are applied. The uncertainties of the predictions, shown by the coloured lines, include all the uncertainties discussed in section 9. The grey bands show the total data uncertainty including both the systematic (JES, JER, unfolding, jet cleaning, luminosity) and statistical uncertainties. [GeV] jj m 2 10 × 3 103 2×10³ 104 0.6 0.8 1 1.2 1.4 1.0≤ y*<1.5 3 3 0.6 0.8 1 1.2 1.4 0.5≤ y*<1.0 Theory/Data 0.6 0.8 1 1.2 1.4 y*<0.5 [GeV] jj m 2 10 × 7 103 2×10³ 104 0.5 1 1.5 2 2.5≤3 y*<3.0 3 0.8 1 1.2 1.4 1.6 2.0≤ y*<2.5 Theory/Data 0.6 0.8 1 1.2 1.4 1.5≤ y*<2.0
ATLAS
-1 fb 3.2 --1 nb 81 = L = 13 TeV s =0.4 R t anti-k Data NLO QCD NP k ⊗ EW k ⊗ exp(0.3y*) T p = µ CT14 HERAPDF 2.0 ABMP16Figure 10. Comparison of the measured dijet cross-sections and the NLO pQCD predictions shown as the ratios of predictions to the measured cross-sections. The ratios are shown as a function of the jet mjj in six y∗ bins for anti-kt jets with R = 0.4. The predictions are calculated
using NLOJET++ with three different PDF sets (CT14, HERAPDF 2.0, ABMP16) and non-perturbative and electroweak corrections are applied. The uncertainties of the predictions, shown by the coloured lines, include all the uncertainties discussed in section9. The grey bands show the total data uncertainty including both the systematic (JES, JER, unfolding, jet cleaning, luminosity) and statistical uncertainties.
JHEP05(2018)195
[GeV] T p 2 10 2×10² 103 103 × 2 0.8 0.9 1 1.1 1.2 1.3 1.4 1.0≤|y|<1.5 3 3 0.8 0.91 1.1 1.2 1.3 1.4 0.5≤|y|<1.0 Theory/Data 0.6 0.8 1 1.2 1.4 1.6 1.8 0.5 < |y| [GeV] T p 2 10 2×10² 103 103 × 2 0.5 1 1.5 2 2.5 2.5≤|y|<3.0 3 3 0.6 0.8 1 1.2 1.4 1.6 2.0≤|y|<2.5 Theory/Data 0.6 0.8 1 1.2 1.4 1.5≤|y|<2.0ATLAS
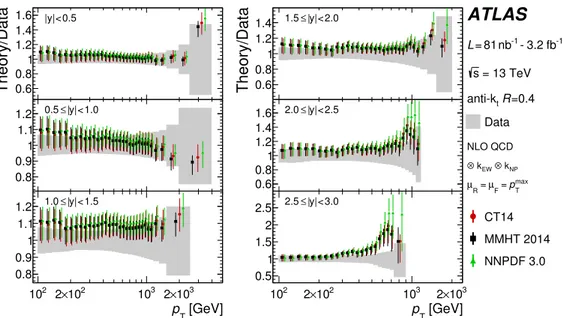
-1 fb 3.2 --1 nb 81 = L = 13 TeV s =0.4 R t anti-k Data NLO QCD NP k ⊗ EW k ⊗ NNLO QCD NP k ⊗ EW k ⊗ jet T p = F µ = R µ NLO MMHT 2014 NLO NNLO MMHT 2014 NNLOFigure 11. Ratios of the NLO and NNLO pQCD predictions to the measured inclusive jet cross-sections, shown as a function of the jet pTin six |y| bins for anti-kt jets with R = 0.4. The NLO
predictions are calculated using NLOJET++ with the MMHT 2014 NLO PDF set. The NNLO predictions are provided by the authors of refs. [17,18] using NNLOJET with pjetT as the QCD scale and the MMHT 2014 NNLO PDF set. Non-perturbative and electroweak corrections are applied to the predictions. The NLO and NNLO uncertainties are shown by the coloured lines, including all the uncertainties discussed in section9. The grey bands show the total data uncertainty including both the systematic (JES, JER, unfolding, jet cleaning, luminosity) and statistical uncertainties.
[GeV] T p 2 10 2×10² 103 2×10³ 0.8 0.9 1 1.1 1.2 1.3 1.4 1.0≤|y|<1.5 3 3 0.8 0.91 1.1 1.2 1.3 1.4 0.5≤|y|<1.0 Theory/Data 0.6 0.8 1 1.2 1.4 1.6 1.8 0.5 < |y| [GeV] T p 2 10 2×10² 103 2×10³ 0.5 1 1.5 2 2.5 2.5≤|y|<3.0 3 3 0.6 0.8 1 1.2 1.4 1.6 2.0≤|y|<2.5 Theory/Data 0.6 0.8 1 1.2 1.4 1.5≤|y|<2.0
ATLAS
-1 fb 3.2 --1 nb 81 = L = 13 TeV s =0.4 R t anti-k Data NLO QCD NP k ⊗ EW k ⊗ NNLO QCD NP k ⊗ EW k ⊗ max T p = F µ = R µ NLO MMHT 2014 NLO NNLO MMHT 2014 NNLOFigure 12. Ratios of the NLO and NNLO pQCD predictions to the measured inclusive jet cross-sections, shown as a function of the jet pTin six |y| bins for anti-kt jets with R = 0.4. The NLO
predictions are calculated using NLOJET++ with the MMHT 2014 NLO PDF set. The NNLO predictions are provided by the authors of refs. [17,18] using NNLOJET with pmaxT as the QCD scale and the MMHT 2014 NNLO PDF set. Non-perturbative and electroweak corrections are applied to the predictions. The NLO and NNLO uncertainties are shown by the coloured lines, including all the uncertainties discussed in section9. The grey bands show the total data uncertainty including both the systematic (JES, JER, unfolding, jet cleaning, luminosity) and statistical uncertainties.