No Growth in the Second Quarter
Zümrüt İmamoğlu* ve Barış Soybilgen
†Executive Summary
According to new data released for June, Betam revised all its economic indicators for the second quarter. We expect the real GDP in the second quarter to be close to its first quarter level. Betam forecasts a real GDP growth of 0.1 percent in the second quarter from the previous quarter. We expect the change from the same quarter of the previous year to be 6.4 percent. We believe that the increase in consumption and net exports were offset by the decrease in investment.
Trade deficit in volume decreased in the second quarter; however, in nominal terms current account deficit continued to rise. Betam’s current account deficit forecast for the end of second quarter is 9.3 percent of GDP. July data, the first signs for third quarter economic activity, reveals a negative outlook for quarterly GDP growth in the third quarter. On the other hand, the Central Bank’s new expansionary monetary policy can help change that outlook to positive in the coming months. The downside risk is that if the new expansionary monetary policy fuels domestic demand, we might see further increases in the current account deficit.
* Dr. Zümrüt İmamoğlu, Betam, Research Associate. [email protected]
† Barış Soybilgen, Betam, Research Assistant,
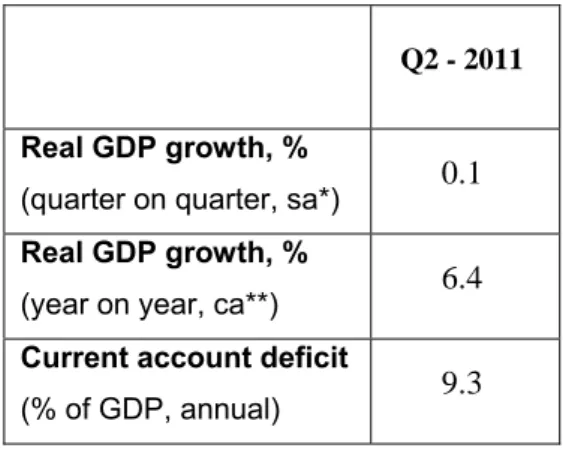
Table 1. Betam’s quarterly and annual growth rate forecasts
Source: Betam
*sa: seasonally and calendar day adjusted
**ca: calendar day adjusted
Stagnation in economy
Second quarter economic outlook is almost stagnant. We expect quarter on quarter real GDP growth to be only 0.1 percent. The confidence interval for our forecast, of course, includes negative figures as well, so it’s possible that a small contradiction might have occurred in the second quarter as well. We will know the actual figures when TurkStat releases the data mid-September. However, it should be obvious that a small contradiction or stagnation in GDP doesn’t mean that there is a recession in Turkey. It only shows that the economy that grew above its long-run trend last year finally began to return to its more stable path.
Q2 - 2011 Real GDP growth, %
(quarter on quarter, sa*) 0.1
Real GDP growth, %
(year on year, ca**) 6.4
Current account deficit
(% of GDP, annual) 9.3
Economic Outlook and Forecasts:
August 2011
Due to base effects the year on year GDP growth is still high. We expect the YoY GDP growth in the second quarter to be 6.4 percent. This number is above long run trend of Turkish GDP growth which is a little less than 5 percent. Given the strong correlation between the current account deficit and the growth rate in Turkey, it’s not surprising to see that the current account deficit is still high. For the current account deficit to return to a more stable level, GDP growth should be closer to its long-run trend.
In August, new expansionary money policy of Turkish Central Bank emerged as a counter measure for foreign originated shocks. However, the move is critically important for its effects on domestic demand. An expansionary policy that fuels domestic demand can have adverse affects on the current account deficit. On the other hand, there is no sign of loosening in the fiscal stance which is good news. Finally, if the latest depreciation in the Turkish Lira becomes permanent, this might help decreasing the current account deficit but on a small scale.
Acceleration in June Consumption
Turkey held its general election mid-June. Before the election, the common expectation was that the government might increase the special consumer tax (SCT) which is levied on durable consumption goods such as cars, right after the election. Therefore, we believe that the increase in consumer spending in early June was mostly due to tax evading strategy. In fact, high growth in automobile production and consumer goods imports increased SCT revenues by 10.9 percent. After the election, the landslide victory of AKP boosted consumer confidence. The consumer confidence index increased 4.3 percent in June.
Therefore June data increased our consumption forecast for the second quarter. It seems that the second quarter growth was mainly driven by domestic consumption.
Investment decreased
Second quarter investment indicators mainly depicted a gloomy picture. The IPI decreased by 1.7 percent and CUR decreased by 1.4 percentage points in the second quarter from the first quarter. Real sector confidence index also decreased, by 4.3 percent, in the second quarter. The only positive investment indicator was imports of investment goods which increased by 10.6 percent. Looking at these changes, we believe that the investment demand decreased in the second quarter.
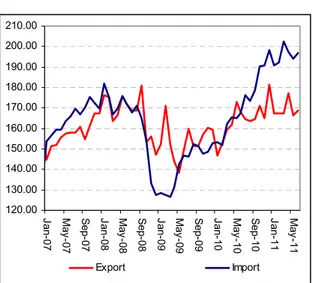
Exports increased more than imports
Figure 2 shows monthly changes of seasonally adjusted import and export volume indices. In the second quarter of 2011, exports increased more than imports in volume. Exports and imports increased by 2.1 and 0.5 percent, respectively. But in nominal terms, imports were higher than exports in the second quarter, so trade deficit continued to rise. We expect the contribution of net exports to GDP to be positive in the second quarter. However, in the coming months, worsening of Europe debt crisis is one of the major threats to the Turkish export sector.
Current account deficit high at 9.3 percent
With the increase in exports in June, trade deficit in volume decreased in the second quarter from to the first quarter. However, in nominal terms, 12 month rolling current account deficit continued to
increase. The trade deficit and current account deficit were $10.2 and $7.2 billion, respectively in June. Betam expects current account deficit to be 9.3 percent of GDP in the end of second quarter. We also forecast that this ratio will stay nearly same until the end of this year and be 9.4 percent by the end of 2011.
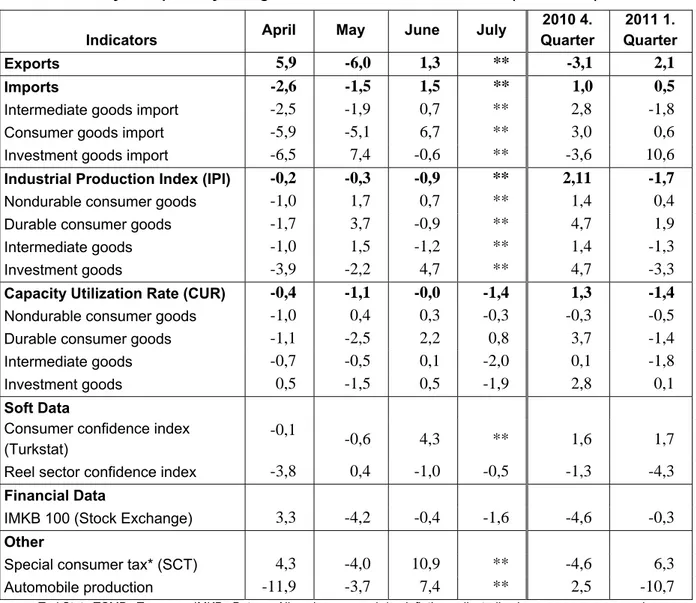
Table 2. Monthly and quarterly changes of Betam’s selected indicators (real and sa)
Indicators April May June July
2010 4. Quarter 2011 1. Quarter Exports 5,9 -6,0 1,3 ** -3,1 2,1 Imports -2,6 -1,5 1,5 ** 1,0 0,5
Intermediate goods import -2,5 -1,9 0,7 ** 2,8 -1,8
Consumer goods import -5,9 -5,1 6,7 ** 3,0 0,6
Investment goods import -6,5 7,4 -0,6 ** -3,6 10,6
Industrial Production Index (IPI) -0,2 -0,3 -0,9 ** 2,11 -1,7
Nondurable consumer goods -1,0 1,7 0,7 ** 1,4 0,4
Durable consumer goods -1,7 3,7 -0,9 ** 4,7 1,9
Intermediate goods -1,0 1,5 -1,2 ** 1,4 -1,3
Investment goods -3,9 -2,2 4,7 ** 4,7 -3,3
Capacity Utilization Rate (CUR) -0,4 -1,1 -0,0 -1,4 1,3 -1,4
Nondurable consumer goods -1,0 0,4 0,3 -0,3 -0,3 -0,5
Durable consumer goods -1,1 -2,5 2,2 0,8 3,7 -1,4
Intermediate goods -0,7 -0,5 0,1 -2,0 0,1 -1,8
Investment goods 0,5 -1,5 0,5 -1,9 2,8 0,1
Soft Data
Consumer confidence index (Turkstat)
-0,1
-0,6 4,3 ** 1,6 1,7
Reel sector confidence index -3,8 0,4 -1,0 -0,5 -1,3 -4,3
Financial Data
IMKB 100 (Stock Exchange) 3,3 -4,2 -0,4 -1,6 -4,6 -0,3
Other
Special consumer tax* (SCT) 4,3 -4,0 10,9 ** -4,6 6,3
Automobile production -11,9 -3,7 7,4 ** 2,5 -10,7
Source: TurkStat, TCMB, Treasury, IMKB, Betam. All series are real (or inflation adjusted) wherever necessary and seasonally adjusted.
*This tax is collected on sales of goods such as gas, fuel oils, alcohol, tobacco products and automobiles. **Data not yet released
Figure 1: Capacity utilization rate and industrial production index (sa, left axis for CUR and right axis for IPI)
60 65 70 75 80 85 Ja n-07 Ap r-07 Ju l-0 7 Oct -0 7 Ja n-08 Ap r-08 Ju l-0 8 Oct -0 8 Ja n-09 Ap r-09 Ju l-0 9 Oct -0 9 Ja n-10 Ap r-10 Ju l-1 0 Oct -1 0 Ja n-11 Ap r-11 Ju l-1 1 95 100 105 110 115 120 125 130 CUR IPI
Source : TurkStat, Betam
Figure 2: Volume indices of exports and imports (sa) 120.00 130.00 140.00 150.00 160.00 170.00 180.00 190.00 200.00 210.00 Jan-07 May -07 S ep-07 Jan-08 May -08 S ep-08 Jan-09 May -09 S ep-09 Jan-10 May -10 S ep-10 Jan-11 May -11 Export Import
Source : TurkStat, Betam
Figure 3: Ratio of current account deficit to GDP (yearly) Current Account Deficit (% of GDP)
0.0 1.0 2.0 3.0 4.0 5.0 6.0 7.0 8.0 9.0 10.0 2007( Q 2) 2007( Q 3) 2007( Q 4) 2008( Q 1) 2008( Q 2) 2008( Q 3) 2008( Q 4) 2009( Q 1) 2009( Q 2) 2009( Q 3) 2009( Q 4) 2010( Q 1) 2010( Q 2) 2010( Q 3) 2010( Q 4) 2011( Q 1) 2011( Q 2)
Source: TCMB, TurkStat, Betam * Betam’s forecasts
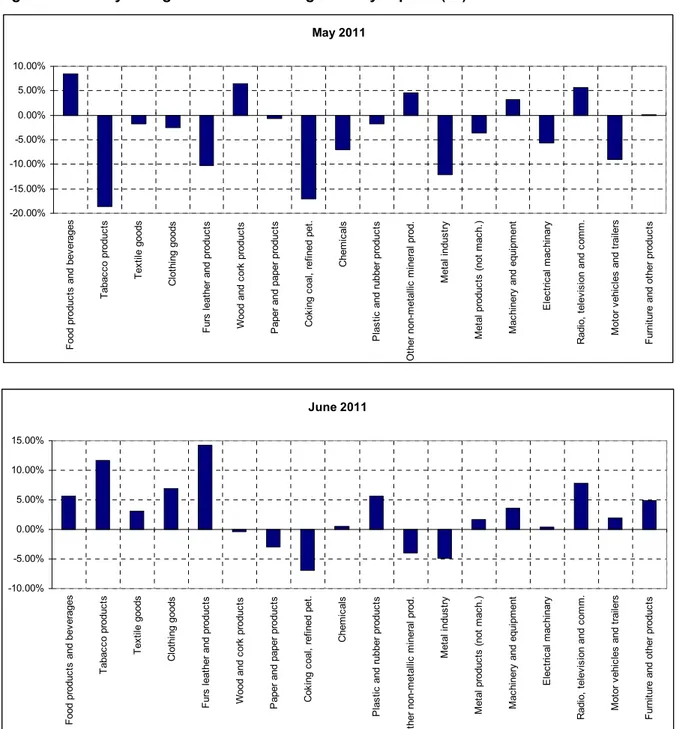
Figure 4: Monthly changes of manufacturing industry exports (sa)
Source: TurkStat, Betam
June 2011 -10.00% -5.00% 0.00% 5.00% 10.00% 15.00% F ood pr oduc ts and bev erages T abac co produc ts T ex til e goods C lot hi ng goods F urs leat her and pr oduc ts Wood and co rk produc ts P aper and paper pr oduc ts C ok ing c oal , ref ine d pet . C hem ic al s P las tic and r ubber pro duc ts O ther non-m et allic m in er al p ro d. M et al indus tr y M et al produc ts (not m ac h. ) M ac hi nery and e qui pm ent E lec tr ic al m ac hi nary R adi o, t el ev is ion and c om m . M ot or v ehi cl es and t rai le rs F urni tur e and ot her pr oduc ts May 2011 -20.00% -15.00% -10.00% -5.00% 0.00% 5.00% 10.00% F ood produc ts and bev erages T abac co produc ts T ex til e goods C lot hi ng goods F urs leat her and produc ts Wood and c or k produc ts P aper and paper produc ts C ok ing c oal , r ef ined pet . C hem ic al s P las tic
and rubber produc
ts O ther non-m et al lic m iner al prod. M et al indus tr y M et al pr oduc ts ( not m ac h. ) M ac hi nery an d equi pm ent E lec tr ic al m ac hi nary R adi o, t el ev is ion and c om m . M ot or v ehi cl es and t rai le rs F ur ni ture and ot her produc ts