REVIVAL IN THE 2
NDQUARTER
Zümrüt İmamoğlu* ve Barış Soybilgen
†Executive Summary
The Industrial Production Index (IPI) increased by 1.4 percent in the second quarter from the previous quarter and compensated the 1.3 percent decline in the first quarter. In the second quarter, export volume index increased by 11.5 percent and import volume index increased by 3.1 percent. On the other hand, increases in gold adjusted exports and imports are limited. Our indicators show a revival in consumption and a fall in investment in the second quarter. Although the economy seemed to recover its loss in the first quarter, the growth rate may still end up way below the government’s end of the year target. Betam’s quarter on quarter (QoQ) growth forecast for the second quarter of 2012 is 1.0 percent. We estimate the corresponding year on year (YoY) growth rate to be 2.0 percent.
The current account deficit continued to decline rapidly. The 12-month current account deficit at the end of the second quarter decreased by $8.6 billion compared to the end of the first quarter and fell to 63.3 billion. At the end of the first quarter, * Dr. Zümrüt İmamoğlu, Betam, Research Associate. [email protected]
† Barış Soybilgen, Betam, Research Assistant, [email protected]
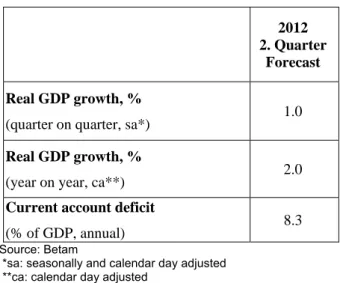
Table 1. Betam’s quarterly and annual growth rate forecasts
Source: Betam
*sa: seasonally and calendar day adjusted **ca: calendar day adjusted
the ratio of current account deficit to GDP was 9.3 percent, we estimate that it has fallen down to 8.3 percent at the end of the second quarter. We also expect that the current account deficit will continue to fall in the third quarter.
Recovery in the second quarter
The second quarter began promising. April and May data of economic indicators were mostly on the positive side. There was a revival both in the IPI and in consumer and investment goods imports. However, some economic indicators for the second quarter deteriorated in June. Due to the decline in IPI in June, QoQ IPI increase fell down to 1.4 percent from 2.2 percent. The investment
2012 2. Quarter
Forecast Real GDP growth, %
(quarter on quarter, sa*) 1.0
Real GDP growth, %
(year on year, ca**) 2.0
Current account deficit
(% of GDP, annual) 8.3
Economic Outlook and Forecasts:
August 2012
goods production was flat and investment goods imports declined. Real sector confidence index deteriorated more in June compared to previous months. After the recovery in May, automobile production declined sharply in June. In spite of these adverse developments in June, we expect that the economy experienced a revival in the second quarter and the 0.4 percent decline in the first quarter will be offset by increases in private consumption expenditure and net exports.
In the second quarter, neither monetary policy nor fiscal policy changed much. Fiscal policy continued its tight stance. Inflation increased less than expected in May and June and this has allowed Turkish Central Bank to loosen interest rates a little. However, Turkish Central Bank (TCMB) hasn’t made any remark on easing monetary policy further to accelerate growth. American and European Central Bank also didn’t engage in a monetary expansion, so expectations for further easing by the Central Bank of Turkey are not high either.
When evaluating all economic developments, we revised our QoQ real GDP growth forecast and increased to 1.0 percent from 0.6 percent. The most important reason for upward revision is the recovery in consumption indicators compared to last quarter. Imports declined in June in spite of the surge in gold imports. Net exports also seem to contribute to the GDP growth positively even excluding high gold trade. We estimate the corresponding year on year (YoY) growth rate to be 2.0 percent.
Increase in consumption expenditure
In the second quarter of 2012, consumer goods imports increased by 2.1 percent from the previous quarter. Durable goods production and nondurable goods production increased by 2.1 percent and 0.1 percent, respectively. These three economic indicators had decreased last quarter. Due to increases in consumption goods production and imports, special consumption tax revenue increased by 4.3 percent in the second quarter. On the other hand, consumption confidence index declined by 2.2 percent. Overall, we expect that private consumption expenditures increased in the second quarter compared to the first quarter.
Brake in investment expenditure
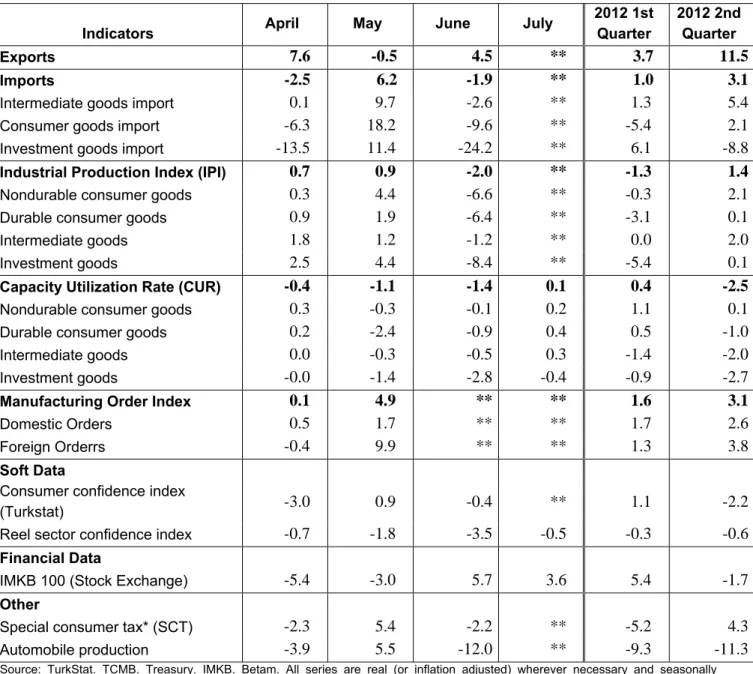
In the second quarter of 2012, IPI increased by 1.4 percent and capacity utilization rate decreased by 2.5 percent. Investment goods imports which is one of the most important economic indicators to forecast private investment expenditure decreased by 8.8 percent in the second quarter from the previous quarter. Real sector confidence index decreased by 0.6 percent. Moreover, automobile production continued to decline. In the second quarter, automobile production decreased by 11.3 percent. Evaluating these investment indicators, we expect a decline in the private investment expenditure in the second quarter.
Net exports is the engine of GDP growth
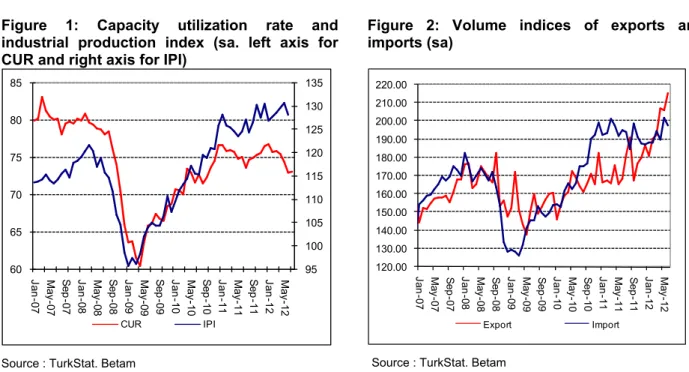
Figure 2 shows monthly changes of seasonally adjusted import and export volume indices. In June, export volume index increased by 4.5
percent whereas import volume index decreased by 1.9 percent. In the second quarter of 2012, export volume index increased by 11.5 percent and import volume index increased by 3.1 percent from the previous quarter. When we adjusted the trade data for high gold trade in the second quarter of 2012, we see that the export volume index increased by 3.3 percent and the import volume index decreased by 0.2 percent. We expect that net exports will continue being the main engine of economic growth in the second quarter.
Current account deficit continues to fall
In June, the current account deficit decreased by $3.5 billion. The 12-month current account deficit fell from $71.6 billion to $63.3 billion in June. The decline in the current account deficit was mainly
caused by the slowdown in imports. We expect that the current account deficit will continue to fall in the third quarter. According to the revival in private consumption expenditure and limited increase in imports, we reduce our current account to GDP ratio forecast at the end of the second quarter to 8.3 percent. At the end of the first quarter, the current account to GDP ratio was 9.3 percent.
Table 2. Monthly and quarterly changes of Betam’s selected indicators (real and sa)
Indicators April May June July
2012 1st Quarter 2012 2nd Quarter Exports 7.6 -0.5 4.5 ** 3.7 11.5 Imports -2.5 6.2 -1.9 ** 1.0 3.1
Intermediate goods import 0.1 9.7 -2.6 ** 1.3 5.4
Consumer goods import -6.3 18.2 -9.6 ** -5.4 2.1
Investment goods import -13.5 11.4 -24.2 ** 6.1 -8.8
Industrial Production Index (IPI) 0.7 0.9 -2.0 ** -1.3 1.4
Nondurable consumer goods 0.3 4.4 -6.6 ** -0.3 2.1
Durable consumer goods 0.9 1.9 -6.4 ** -3.1 0.1
Intermediate goods 1.8 1.2 -1.2 ** 0.0 2.0
Investment goods 2.5 4.4 -8.4 ** -5.4 0.1
Capacity Utilization Rate (CUR) -0.4 -1.1 -1.4 0.1 0.4 -2.5
Nondurable consumer goods 0.3 -0.3 -0.1 0.2 1.1 0.1
Durable consumer goods 0.2 -2.4 -0.9 0.4 0.5 -1.0
Intermediate goods 0.0 -0.3 -0.5 0.3 -1.4 -2.0
Investment goods -0.0 -1.4 -2.8 -0.4 -0.9 -2.7
Manufacturing Order Index 0.1 4.9 ** ** 1.6 3.1
Domestic Orders 0.5 1.7 ** ** 1.7 2.6
Foreign Orderrs -0.4 9.9 ** ** 1.3 3.8
Soft Data
Consumer confidence index
(Turkstat) -3.0 0.9 -0.4 ** 1.1 -2.2
Reel sector confidence index -0.7 -1.8 -3.5 -0.5 -0.3 -0.6
Financial Data
IMKB 100 (Stock Exchange) -5.4 -3.0 5.7 3.6 5.4 -1.7
Other
Special consumer tax* (SCT) -2.3 5.4 -2.2 ** -5.2 4.3
Automobile production -3.9 5.5 -12.0 ** -9.3 -11.3
Source: TurkStat. TCMB. Treasury. IMKB. Betam. All series are real (or inflation adjusted) wherever necessary and seasonally adjusted.
*This tax is collected on sales of goods such as gas. fuel oils. alcohol. tobacco products and automobiles. **Data not yet released
Figure 1: Capacity utilization rate and industrial production index (sa. left axis for CUR and right axis for IPI)
95 100 105 110 115 120 125 130 135 60 65 70 75 80 85 Ja n -0 7 Ma y-0 7 Se p -0 7 Ja n -0 8 Ma y-08 Se p -0 8 Ja n -0 9 Ma y-0 9 Se p -0 9 Ja n -1 0 Ma y-1 0 Se p -1 0 Ja n -1 1 Ma y-1 1 Se p -1 1 Ja n -1 2 Ma y-1 2 CUR IPI
Source : TurkStat. Betam
Figure 2: Volume indices of exports and imports (sa) 120.00 130.00 140.00 150.00 160.00 170.00 180.00 190.00 200.00 210.00 220.00 Ja n -0 7 May -07 Se p -0 7 Ja n -0 8 May -08 Se p -0 8 Ja n -0 9 May -09 Se p -0 9 Ja n -1 0 May -10 Se p -1 0 Ja n -1 1 May -11 Se p -1 1 Ja n -1 2 May -12 Export Import
Source : TurkStat. Betam
Figure 3: Ratio of current account deficit to GDP (yearly)
0.0 2.0 4.0 6.0 8.0 10.0 12.0 200 8( 1) 200 8( 2) 200 8( 3) 200 8( 4) 200 9( 1) 200 9( 2) 200 9( 3) 200 9( 4) 201 0( 1) 201 0( 2) 201 0( 3) 201 0( 4) 201 1( 1) 201 1( 2) 201 1( 3) 201 1( 4) 201 2( 1) 2012( 2) *
Source: TCMB. TurkStat. Betam * Betam’s forecasts
Figure 4: Monthly changes of manufacturing industry exports (sa) -20.00% -10.00% 0.00% 10.00% F o od pr odu ct s a nd be ve ra g es Ta ba cc o pr odu ct s Te xt ile g oods C lot hi ng goo ds F ur s l eat her an d p ro d uc ts W ood a nd c o rk pr o d uc ts P ape r a nd pa pe r pr odu ct s Co ki ng c o al , re fi ne d p et . C hem ic al s P la st ic and ru b b er p ro d uc ts O th er no n-m et al lic m iner al p ro d . Me ta l in d us tr y M et al pr o d uc ts (n ot m ac h. ) M ac hi ner y a nd eq ui p m en t E lec tr ic al m ac hi nar y R adi o, te le vi si o n a nd c o m m . M o to r v ehi cl es and t ra ile rs F ur ni tur e and o ther p ro d uc ts June 2012 -10.00% 0.00% 10.00% 20.00% 30.00% 40.00% 50.00% F ood pr odu ct s a nd be ve ra ge s Ta ba cc o pr o d uc ts Te xt ile goo ds C lot hi ng g oods F ur s l eat he r and p ro d uc ts W o od a nd c o rk p rodu ct s P ap er a nd pa pe r pr odu ct s C o ki ng c o al , r ef in ed p et . C hem ic al s P la st ic a nd ru bbe r pr odu ct s O th er n o n-m et allic m in er al p ro d . M et al in d us tr y M et al pr odu ct s ( not m ac h. ) M ac hi ner y and e q ui p m ent E le ct ric al ma ch in ar y R adi o, te le vi si on a nd c o m m . M o to r v ehi cl es a nd t rai le rs F ur ni tu re a nd ot he r p rod uc ts May 2011