GROWTH WITHOUT INVESTMENT
Seyfettin Gürsel*, Zümrüt İmamoğlu†, ve Barış Soybilgen‡
Executive Summary
According to data released by TurkStat, real GDP in 2013 increased 4 percent. The growth rate in the previous year was 2.1 percent. Growth accelerated in the first half of 2013, but slowed down gradually during the second half. In the fourth quarter, GDP increased by 0.5 percent from the previous quarter. In 2013, the two main sources of growth were private consumption and government expenditure. Private investment and exports' contributions were almost zero, whereas inventory investment contributed positively to the growth. Domestic demand which declined in the previous year revived in 2013. Net exports, which contributed positively to growth in the previous year, turned negative due to excessive gold imports. The ratio of current account deficit to GDP increased from 6.2 percent at the end of 2012 to 7.9 percent at the end of 2013. However, gold excluded current account deficit declined from 6.9 percent to 6.5 percent.
Unlike TurkStat, Betam seasonally adjusts each GDP component separately on a quarterly basis. According to Betam’s analysis, main sources of the growth in the last quarter were private consumption and government expenditure, similar to the rest of the year. Contributions of investment and exports increased but only slightly.
•Prof. Dr. Seyfettin Gürsel, Betam, Director
†Zumrut Imamoglu, Betam, Research Associate
zumrut.ı[email protected]
‡Baris Soybilgen, Betam, Research Assistant
Figure 1: Annual change in GDP components, 2013
Source: Turkstat, Betam. Change in imports is zero.
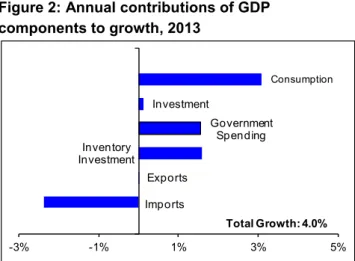
Figure 2: Annual contributions of GDP components to growth, 2013
Source: Turkstat, Betam. Contribution of imports is zero.
Imports Exports Government Spending Investment Consumption -2% 2% 6% 10% 14% 18% Imports Exports Inventory Investment Government Spending Investment Consumption -3% -1% 1% 3% 5% Total Growth:4.0%
Growth Review: 2013, 4
th
Quarter
Domestic demand increased through consumption and government expenditure
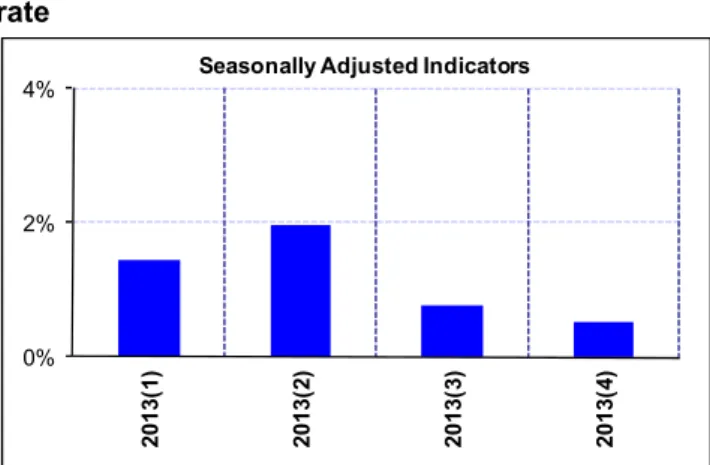
Domestic demand revived in 2013 following the decline in 2012. Monetary loosening in the first half of the year brought down the interest rates to all time lows, and strong capital inflows positively affected growth. Growth rates, quarter on quarter (QoQ), for the first two quarters were 1.4 percent and 2.0 percent, respectively. However, in third and fourth quarters, QoQ growth decelerated to 0.8 percent and 0.5 percent, respectively (Figure 4). The slowdown in the second half was mainly caused by the reversed capital flows and the increase in interest rates due to FED announcements about the timing and scope of tapering.
The main driver of economic growth in 2013 was consumption followed by government expenditures. Consumption increased by 4.6 percent and contributed 3.1 percentage points to growth. Government expenditures grew by 10.6 percent, and contributed 1.6 percentage points to growth. Private investment which declined by 4.9 percent in the previous year increased by 0.7 percent, but contributed only 0.1 percentage points. However, the contribution of inventory investment was 1.6 percentage points.
Exports increased by 0.1 percent annually and exports' contribution to growth was nearly zero. On the other hand, imports increased by 8.5 percent and subtracted 2.4 percentage points from growth. However, one should be cautious when analyzing these numbers as gold trade due to US embargo on Iran in the last couple of years significantly affected import and export figures. Gold exports which increased to its all-time high level in 2012, dropped suddenly in 2013, and this caused the contribution of exports to growth seem high in 2012 and low in 2013. A similar but opposite effect can also be seen in imports. We believe that gold excluded exports increased slightly and made a limited but positive contribution to growth.
Balanced growth in 2013
To analyze the quarterly contributions of GDP components to growth, Betam seasonally adjusts each component of GDP separately. The results of Betam's analysis is not very different from the story that the annual analysis is telling us. Private consumption and government expenditure were main sources of growth in almost all quarters throughout the year (see Table 2). Private consumption increased in all quarters and
contributed positively to GDP growth. Except for the third quarter, quarterly contribution of government expenditures has been positive as well. Exports seemed to improve in the second half of the year though investment remained weak in all quarters. Overall, 2013 growth was above the 3.6 percent target of the medium term program. However, contributions of exports and investment were near zero. Even though the growth rate exceeded the target, its sustainability is doubtful.
On the other hand, 2013 was a year of rebalancing between domestic and foreign demand. Although the ratio of current account deficit to GDP increased from 6.2 percent to 7.9 percent, gold excluded current account deficit declined from 6.9 percent to 6.5 percent. Gold excluded figures show that acceleration in growth in 2013 did not cause an increase in current account deficit, rather the deficit decreased. We believe that the reason could be due to composition of growth. Only 12 percent of Turkey's imports are consumption goods. Growth led by consumption and government expenditures did not cause a large increase in imports.
Nevertheless, improvement in gold excluded current account deficit is not satisfactory. A low growth regime (3-4 percent) coupled with high CA deficit of around 6 percent seems to be the path forward. Turkey still needs to do the long awaited structural reforms to reduce its financial fragility and improve its potential growth.
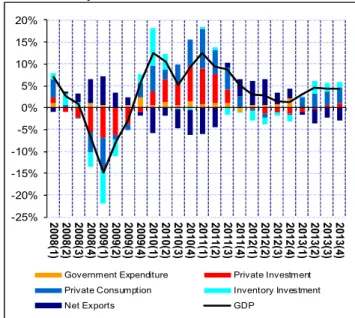
Figure 3: YoY GDP growth rate and contribution of GDP components
Source: Turkstat, Betam. -25% -20% -15% -10% -5% 0% 5% 10% 15% 20% 20 08 (1) 20 08 (2) 20 08 (3) 20 08 (4) 20 09 (1) 20 09 (2) 20 09 (3) 20 09 (4) 20 10 (1) 20 10 (2) 20 10 (3) 20 10 (4) 20 11 (1) 20 11 (2) 20 11 (3) 20 11 (4) 20 12 (1) 20 12 (2) 20 12 (3) 20 12 (4) 20 13 (1) 20 13 (2) 20 13 (3) 20 13 (4)
Government Expenditure Private Investment Private Consumption Inventory Investment Net Exports GDP
2013 forecasts and 2014 expectations Betam, in its Economic Outlook and Forecast briefs (January 2013 and February 2014), forecasted 4.2 percent annual growth which realized as 4.0 percent. Betam also expected QoQ growth to be 0.4 percent which is realized as 0.5 percent. Government expenditure and private consumption increased as we expected. Private investment and net exports realizations were also in line with our expectations. In 2014, we expect exports and government expenditures to be the main sources of growth in the economy. We also expect consumption to contribute positively but private investment to stagnate or contribute negatively in 2014. Data for the first quarter indicates that the contribution of net exports will be positive. Tight monetary policy due to FED policies and tight fiscal policy due to budget constraints might suppress domestic demand. Global risks also continue for the rest of the year.
Municipal elections at the end of March showed support for the ruling party. Following the election results, every government action that will curb political uncertainties and tensions will positively affect investment and consumption behavior. However, ending of FED's tapering by fall 2014 and expected short-term interest rate hike afterwards will negatively affect the Turkish economy. Because of concerns about inflation and financial fragility, we expect monetary stance to remain tight. Spending margin in the fiscal policy has been used by the government for the last two years to support growth without any disturbance to budget performance and will probably continue being used, but it is limited. Therefore, growth in 2014 will mainly be determined by exports which is dependant on recovering European demand.
Figure 4: Quarter-on-quarter real GDP growth rate Source: Turkstat. 0% 2% 4% 20 13 (1 ) 20 13 (2 ) 20 13 (3 ) 20 13 (4 )
Table 1. Contributions of GDP components and GDP growth rate throughout quarters of 2013 compared to the same quarter of previous year.
2013 Q1 Q2 Q3 Q4 Consumption 2.4 3.3 3.1 3.5 Investment -1.0 -0.2 0.7 0.9 Government exp. 2.1 1.9 0.8 1.5 Inventory Inv. 0.1 2.9 1.9 1.4 Net Exports -0.7 -3.4 -2.2 -3.0 Exports 1.3 0.0 -0.6 -0.4 Imports -2.0 -3.4 -1.5 -2.6 Growth Rate 2.9 4.5 4.3 4.4 Source: Turkstat.
Table 2. Contributions of GDP components and GDP growth rate throughout quarters of 2013 compared to the previous quarter.
2013 Q1 Q2 Q3 Q4 Consumption 1.8 0.4 1.1 0.7 Investment 0.6 0.2 0.0 0.2 Government exp. 0.4 0.4 -0.3 1.0 Inventory Inv. 0.7 1.8 -0.7 -0.1 Net Exports -2.4 -1.5 0.7 0.3 Exports -0.7 0.4 -0.7 0.7 Imports -1.7 -1.9 1.4 -0.4 Growth Rate-Betam 1.0 1.2 0.8 2.1 Growth Rate-TurkStat 1.4 2.0 0.8 0.5
Source: Turkstat, Betam. Quarterly indicators are seasonally adjusted and calendar day corrected.
Table 3. Annual changes and contributions of GDP components for 2013 and 2012
2013 Change(%) Contribution(pp) Consumption 4.6 3.1 Investment 0.7 0.1 Government exp. 10.6 1.6 Inventory Inv. -- 1.6 Exports 0.1 0.0 Imports 8.5 -2.4 2012 Change(%) Contribution(pp) Consumption -0.5 -0.3 Investment -4.9 -1.1 Government exp. 7.3 1.0 Inventory Inv. -- -1.5 Exports 16.3 3.9 Imports -0.4 0.1 Source: Turkstat.
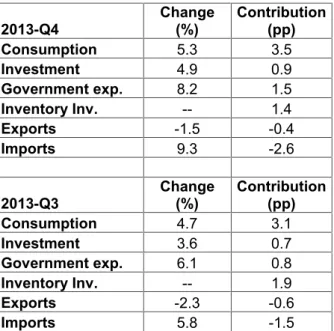
Table 4. Changes and contributions of GDP components for 2013Q4 and 2013Q3, compared to the previous quarters
2013-Q4 Change(%) Contribution(pp) Consumption 5.3 3.5 Investment 4.9 0.9 Government exp. 8.2 1.5 Inventory Inv. -- 1.4 Exports -1.5 -0.4 Imports 9.3 -2.6 2013-Q3 Change(%) Contribution(pp) Consumption 4.7 3.1 Investment 3.6 0.7 Government exp. 6.1 0.8 Inventory Inv. -- 1.9 Exports -2.3 -0.6 Imports 5.8 -1.5
Source: Turkstat, Betam. Quarterly indicators are seasonally adjusted and calendar day corrected
Box 1: Calculation of quarterly GDP growth and contributions.
Sub-components of GDP are grouped into 3 categories:
1.Final domestic demand consist of final consump-tion expenditure of resident households (Con-sumption), sum of government final consumption and investment expenditure (Government ex-penditure), investment expenditure of private sector (Investment)
2.Net foreign demand for goods and services rep-resents the difference between exports and imports of goods and services.
3.Change in inventories (stocks) shows how stocks changes with compared to previous quarter (for details look Box 2)
In order to find quarterly GDP growth, the following formulation is used for all sub components of GDP separately:
Since X represents 'Change in GDP component' Contribution of X to growth can be calculated as follows:
= (Xt– Xt-1) / GDPt-1
Differences between the methodologies used by Betam and TurkStat in seasonally adjusting the real GDP
TurkStat seasonally adjusts and calendar day corrects total GDP series but not its components separately. However, each component of GDP may show different seasonal characteristics. Therefore, Betam eliminates the effects of seasonality and calendar day from the components separately and constructs the adjusted GDP series as the sum of the adjusted components. These two methodologies yield quantitatively different results and both of them are used frequently in the related literature.
Box 2: Change in inventories (stocks) and its contribution to growth
'Stock change' shows that how stocks change compared to previous period
Stock changet= Stockt– Stockt-1
Therefore increase (decrease) in inventories is caused by increase (decrease) in the difference between two period rather than increase (decrease) in stocks. However, TurkStat estimates the change in stocks is as residual between production and expenditure accounts. Moreover this sub-component also includes statistical discrepancy.
Let's say the difference between production and expenditure account t-1, 'stock change' in time t is as follows:
Stock changet= Stockt– Stockt-1+t-1
Finally, contribution of change in 'Stock change' can be found as follows:
Contribution of 'Stock change t = (Stockt– Stockt-1) / GDPt-1
or
Contribution of 'Stock change t = ((Stockt– Stockt-1+t)