Hypoxia parameters, physical variables, and severity
of obstructive sleep apnea
Suat Avc›1, Aynur Y›lmaz Avc›2, Hüseyin Lakadamyal›3, Erdinç Ayd›n1 1
Department of Otolaryngology, Faculty of Medicine, Baflkent University, Ankara, Turkey
2
Department of Neurology, Faculty of Medicine, Baflkent University, Ankara, Turkey
3
Department of Chest Diseases, Faculty of Medicine, Baflkent University, Ankara, Turkey
Correspondence: Suat Avc›, MD. Department of Otolaryngology, Faculty of Medicine, Baflkent University, Saray Mah., Yunusemre Cad., No. 1, 07400, Alanya, Antalya, Turkey.
e-mail: [email protected]
Received: March 23, 2016; Accepted: May 16, 2016
Online available at: www.entupdates.org doi:10.2399/jmu.2016002003 QR code:
Özet: Hipoksi parametreleri, fiziksel de¤iflkenler ve obstrüktif uyku apnesinin fliddet derecesi
Amaç: Farkl› fliddet derecesinde obstrüktif uyku apnesi (OUA) olan hastalarda hipoksiyle fiziksel parametreler aras›ndaki iliflkinin belir-lenmesi.
Yöntem:Bu çal›flma bir gecelik polisomnografik incelemeyle de¤er-lendirilmifl 259 erkekte uygulanan retrospektif çapraz kesitsel bir ça-l›flmad›r. OUA’n›n fliddet derecesi apne/hipopne indeksine (AH‹) gö-re degö-recelendirildi: normal/basit horlama (n=31); hafif degö-recede OU-A (n=70); orta derecede OUOU-A (n=63); fliddetli derecede OUOU-A (n=95). Farkl› fliddet derecesinde OUA’s› olan hastalar, oksijen satürasyonu <%90 (ST90) veya minimal oksijen satürasyonu (min SaO2) olan en uzun veya en k›sa toplam uyku süresine göre altgruplara ayr›ld›.
Bulgular:Ortalama AH‹ 20.4 olay/saat idi. Tek de¤iflkenli analize göre ST90, AH‹ (r=0.772; p≤0.001) ve Epworth uykululuk ölçe¤i (ESS) (r=0.344; p≤0.001) ile korelasyon gösterirken min SaO2, AHI (r=-0.748; p≤0.001) ve ESS (r=-0.319; p≤0.001) ile tersine korelasyon gösterdi. Çok de¤iflkenli do¤rusal regresyon modelinde ST90 ba¤›m-s›z olarak AH‹, ESS ve boyun çevresiyle korele idi, min SaO2ise ba-¤›ms›z olarak AH‹, ESS ve vücut kitle indeksi (VK‹) ile iliflkiliydi. A¤›r derecede OUA geçiren hastalarda en düflük ve en yüksek min Sa-O2’si olan altgruplarda VK‹, modifiye Mallampati skoru, boyun ve bel çevresi ve retroglossal Müller derecesi anlaml› derecede farkl›yd›. Ok-sijen satürasyonu <%90 ile karakterize uyku zaman› yüzdesi (CT90) <%10 hastalarda, ST90’›n üst s›n›r› 36 dakika olup min SaO2’nin alt s›-n›r›n›n %70’ine tekabül etmekteydi.
Sonuç: Hipoksi parametreleri OUA fliddet derecesi kategorilerine göre anlaml› de¤ifliklikler göstermektedir. Fiziksel parametrelerin hiçbiri fliddetli OUA geçiren hastalar d›fl›nda OUA hastalar›nda hi-poksi parametreleriyle klinik aç›dan yararl› iliflkiler içinde de¤ildir.
Anahtar sözcükler:Apne hipopne indeksi, oksijen satürasyonu, fi-ziksel parametreler.
Abstract
Objective:To determine the relation between hypoxia and physical parameters in patients who had different levels of severity of obstruc-tive sleep apnea (OSA).
Methods:This was a retrospective, cross-sectional study of 259 men who were evaluated with overnight polysomnography. Severity of OSA was graded based on the apnea-hypopnea index (AHI): normal/simple snoring (n=31); mild OSA (n=70); moderate OSA (n=63); severe OSA (n=95). Patients with different severity were divided into subgroups, based on having the lowest or highest values of the total sleep time with oxygen saturation <90% (ST90) or mini-mum oxygen saturation (min SaO2).
Results: Median AHI was 20.4 events/hour. Univariate analysis showed that ST90was correlated with AHI (r=0.772; p≤0.001) and Epworth sleepiness scale (ESS) (r=0.344; p≤0.001), and min SaO2was inversely correlated with AHI (r=-0.748; p≤0.001) and ESS (r=-0.319; p≤0.001). Multivariate linear regression showed that ST90was inde-pendently associated with AHI, ESS, and neck circumference, and min SaO2was independently inversely associated with AHI, ESS, and body mass index (BMI). In patients who had severe OSA, the subgroups which had lowest and highest min SaO2differed significantly in BMI, modified Mallampati score, neck and waist circumferences, and ret-roglossal Müller grade. In patients with percentage of sleep time with oxygen saturation below 90% (CT90) <10%, the upper limit of ST90 was 36 minutes and corresponded to 70% lower limit of min SaO2.
Conclusion:Hypoxia parameters show significant variation in OSA severity categories. None of the physical parameters had clinically use-ful relations with hypoxia parameters in OSA patients except patients who had severe OSA.
Keywords:Apnea-hypopnea index, oxygen saturation, physical param-eters.
Pharyngeal airway closure in obstructive sleep apnea (OSA) may involve multiple sites including the retropalatal or ret-roglossal airways.[1–3] There is a fine balance between the
neurophysiologic feedback mechanisms and the absolute anatomic patency of the airway during sleep.[4]
However, no medical history and/or anatomic parameters may distin-guish patients with OSA from patients with snoring. Therefore, patients with snoring should be evaluated at a minimum by a nocturnal screening test for OSA.[5]
The apnea-hypopnea index (AHI) is the frequency of apnea and hypopnea episodes per hour of sleep, regardless of duration and morphology of the episodes. Patients who have similar AHI may have different duration of breathing cessation and depth of oxygen desaturation. These differ-ences may affect the degree of OSA.[6]
Therefore, the pathology of OSA is complex, with contributions from a structurally small airway and inadequate neuromuscular compensation during sleep.[7]
Regardless of the cause, upper airway collapse may cause chronic intermittent hypoxia, oxidative stress, chronic inflammation, and detrimental effects on cardiovascular, neurocognitive, and metabolic function.[8,9]
However, there is no widely accepted quantita-tive clinical test to measure the severity of hypoxia.[6]
In the present study, we divided the patients who had different severity of OSA into subgroups based on the val-ues of total sleep time with oxygen saturation <90% (ST90),
and minimum oxygen saturation (min SaO2). We
hypothe-sized that there may be differences in the severity of hypox-ia parameters and physical abnormalities in patients who have similar AHI. The purpose of this study was to deter-mine the relation between hypoxia and physical parameters on the severity of OSA, and the clinical importance of this relation for treatment.
Materials and Methods
Subjects
In this retrospective, cross-sectional study, consecutive patients were included who had OSA syndrome and sim-ple snoring, who were evaluated in the Department of Otolaryngology-Head and Neck Surgery, Faculty of Medicine, Baflkent University Hospital from 2012 to 2015. Patients who were evaluated with overnight polysomnography met the inclusion criteria (259 men, 0 women; age: mean, 46±11 years; range, 20–79 years). Other patients were excluded due to severe chronic hepat-ic, cardiac, or renal failure, abnormal lung function, or other sleep disorders. The study was classified as exempt from review by the local institutional review board because
the study was designed to collect data during standard treatment of OSA.
Evaluation
All patients had a clinical history and physical and otolaryn-gology examination including (1) determination of body mass index (BMI), (2) measurement of neck and waist cir-cumference, (3) oropharyngeal examination including determination of modified Mallampati (MMP) grade, (4) Müller maneuver (forced inspiratory suction with mouth and nose closed) with fiberoptic endoscopy to determine retropalatal and retroglossal grade, (5) determination of Epworth sleepiness scale (ESS), and (6) polysomnography. Patients were evaluated for hypertension, other cardiovascu-lar diseases, diabetes mellitus, hypothyroidism, nasal obstruction, and allergic rhinitis. Nasal and pharyngeal con-figurations were assessed semiquantitatively. Each patient performed the Müller maneuver in the seated position to estimate the degree of obstruction at the base of the tongue and soft palate. All otolaryngology examinations were per-formed and graded by one examiner [SA] (Table 1).
The BMI was calculated as body weight (kg) divided by the square of body height (m) and graded (Table 1). Neck circumference was measured at the level of the cricothy-roid membrane. Waist circumference was measured at the level of the umbilicus. Tonsil size was classified (Table 1). The oral cavity was inspected for the relative position of the palate and base of the tongue; patients were asked to open the mouth with the tongue relaxed, and examination findings were assessed and graded with MMP score (Table 1). Nasal examination was performed with anterior rhinoscopy using a speculum, with the patient seated and the head tilted slightly backward, and findings were grad-ed according to septal deviation, inferior turbinate hyper-trophy, or other nasal obstructive pathology (Table 1).
The upper airway was evaluated with fiberoptic endoscopy through the nose with the subject seated erect and the head and neck placed in neutral position by aligning the Frankfurt plane between the infraorbital rim of the tragus of the external ear parallel to the floor. Topical nasal anesthesia was achieved with 10% lidocaine spray. The fiberoptic endo-scope was passed through a nostril and advanced until the epiglottis was well visualized. The Müller maneuver was per-formed, and the endoscope was used to inspect the orophar-ynx (at the level of the uvula tip and nasopharorophar-ynx) and hypopharynx (at the level of the supraglottis). The Müller maneuver was repeated ≥3 times until the patient had strong inspiratory suction. Upper airway collapse was graded at the retropalatal space (oropharynx) and retroglossal space (hypopharynx) with Müller grade (Table 1).
Polysomnography
All study participants underwent polysomnography at the Baflkent University Alanya Hospital Chest Disease Sleep Laboratory, using a computerized polysomnography device (Compumedics, E series, 44 channels, Victoria, Australia). The polysomnography study (16 channels) documented the
following parameters: 4-channel electroencephalogram, electro-oculogram, submental and leg electromyogram, electrocardiogram, nasal airflow using nasal pressure cannu-la, airflow at the nose and mouth (thermistors), chest and abdominal respiratory movement, oxygen saturation (pulse oximetry), snoring microphone, and body position. All
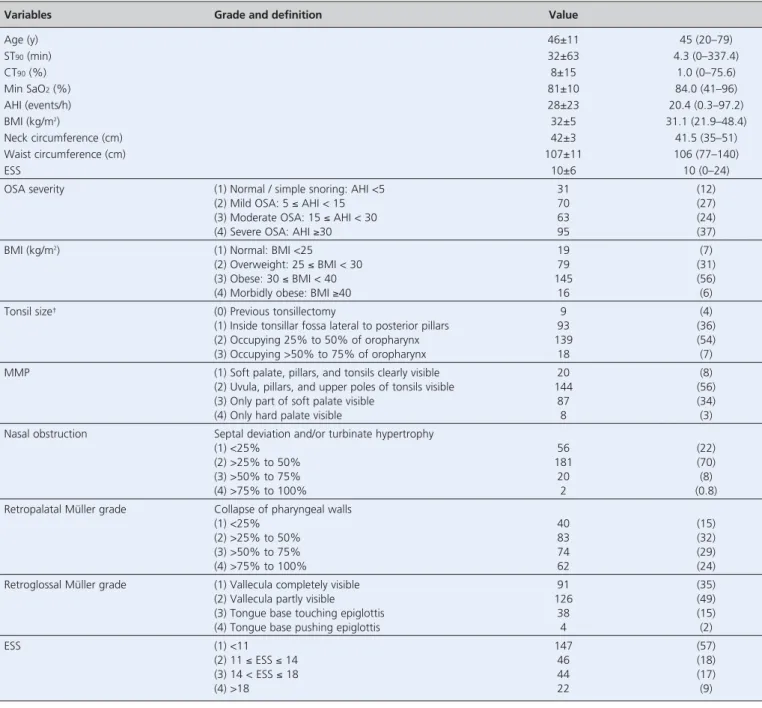
stud-Variables Grade and definition Value
Age (y) 46±11 45 (20–79) ST90(min) 32±63 4.3 (0–337.4) CT90(%) 8±15 1.0 (0–75.6) Min SaO2(%) 81±10 84.0 (41–96) AHI (events/h) 28±23 20.4 (0.3–97.2) BMI (kg/m2) 32±5 31.1 (21.9–48.4) Neck circumference (cm) 42±3 41.5 (35–51) Waist circumference (cm) 107±11 106 (77–140) ESS 10±6 10 (0–24)
OSA severity (1) Normal / simple snoring: AHI <5 31 (12)
(2) Mild OSA: 5 ≤ AHI < 15 70 (27)
(3) Moderate OSA: 15 ≤ AHI < 30 63 (24)
(4) Severe OSA: AHI ≥30 95 (37)
BMI (kg/m2) (1) Normal: BMI <25 19 (7)
(2) Overweight: 25 ≤ BMI < 30 79 (31)
(3) Obese: 30 ≤ BMI < 40 145 (56)
(4) Morbidly obese: BMI ≥40 16 (6)
Tonsil size† (0) Previous tonsillectomy 9 (4)
(1) Inside tonsillar fossa lateral to posterior pillars 93 (36)
(2) Occupying 25% to 50% of oropharynx 139 (54)
(3) Occupying >50% to 75% of oropharynx 18 (7)
MMP (1) Soft palate, pillars, and tonsils clearly visible 20 (8)
(2) Uvula, pillars, and upper poles of tonsils visible 144 (56)
(3) Only part of soft palate visible 87 (34)
(4) Only hard palate visible 8 (3)
Nasal obstruction Septal deviation and/or turbinate hypertrophy
(1) <25% 56 (22)
(2) >25% to 50% 181 (70)
(3) >50% to 75% 20 (8)
(4) >75% to 100% 2 (0.8)
Retropalatal Müller grade Collapse of pharyngeal walls
(1) <25% 40 (15)
(2) >25% to 50% 83 (32)
(3) >50% to 75% 74 (29)
(4) >75% to 100% 62 (24)
Retroglossal Müller grade (1) Vallecula completely visible 91 (35)
(2) Vallecula partly visible 126 (49)
(3) Tongue base touching epiglottis 38 (15)
(4) Tongue base pushing epiglottis 4 (2)
ESS (1) <11 147 (57)
(2) 11 ≤ ESS ≤ 14 46 (18)
(3) 14 < ESS ≤ 18 44 (17)
(4) >18 22 (9)
*N=259 patients. Data reported as mean ± standard deviation, median (range: minimum to maximum), or number (%). †There were no patients who had grade 4 tonsil size. AHI: apnea-hypopnea index; BMI: body mass index; CT90: percentage of cumulative sleep time with oxygen saturation <90%; ESS: Epworth sleepiness scale; min SaO2: min-imum oxygen saturation; MMP: modified Mallampati; OSA: obstructive sleep apnea; ST90: total sleep time with oxygen saturation <90%.
ies were interpreted by a sleep specialist who was blinded to participant characteristics. Apnea was defined as cessation of airflow for ≥10 seconds with continued effort (obstructive) or lack of effort (central) to breathe. Hypopnea was defined as >50% decrease in a valid measure of airflow without a requirement for associated oxygen desaturation or arousal, and with a lesser airflow reduction in association with oxy-gen desaturation >3%, or an arousal for ≥10 seconds. Sleep staging was performed according to American Academy of Sleep Medicine criteria (Table 1).[10]
Statistical analysis
Data analysis was performed with statistical software (IBM SPSS for Windows, Version 22.0, IBM Corp., Armonk, NY, USA). Continuous variables were reported as mean ± standard deviation or median (range, minimum to maxi-mum). Categorical variables were reported as frequencies and percentages. Normality of the continuous variables was evaluated with Shapiro-Wilk test. Differences between the 2 groups according to continuous variables were deter-mined with Mann-Whitney U test. Comparisons of >2 independent groups were performed with Kruskal-Wallis test. Pairwise comparisons were performed with Siegel-Castellan test. Relations between the continuous variables were determined with Spearman correlation coefficient. Multiple stepwise linear regression analysis was used to determine the factors affecting ST90 and min SaO2.
Statistical significance was defined by p≤0.05. Results
Patients were middle aged men, and most patients had mild, moderate, or severe OSA (Table 1). Most patients were overweight or obese and had tonsils that occupied 25% to 50% of oropharynx (Table 1). The median AHI was 20.4 events/hour, ESS was 10, ST90was 4.3 min;
per-centage of sleep time with oxygen saturation below 90% (CT90) was 1.0%, and min SaO2was 84% (Table 1)
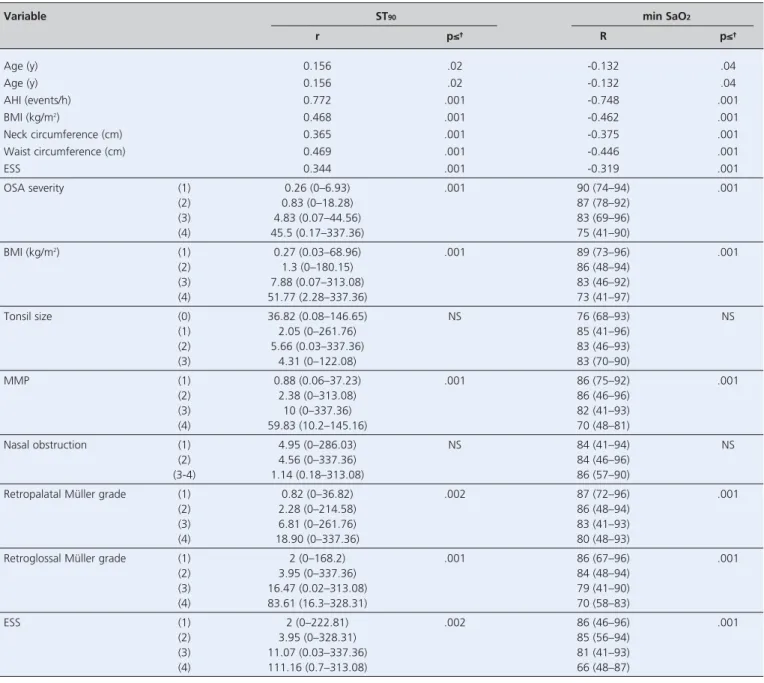
Univariate analysis showed significant correlations between ST90and age, AHI, BMI, neck and waist
circum-ferences, ESS, OSA severity, BMI categories, MMP, retropalatal and retroglossal Müller grades, and ESS grades (Table 2). Univariate analysis showed significant inverse correlations between min SaO2 and age, AHI,
BMI, neck and waist circumferences, ESS, OSA severity, BMI categories, MMP, retropalatal and retroglossal Müller grades, and ESS grades (Table 2).
Multivariate linear regression showed significant inde-pendent association between ST90and AHI, ESS, and neck
circumference (Table 3). The min SaO2was independently
associated with AHI, ESS, BMI, and retropalatal and ret-roglossal Müller grades (Table 3).
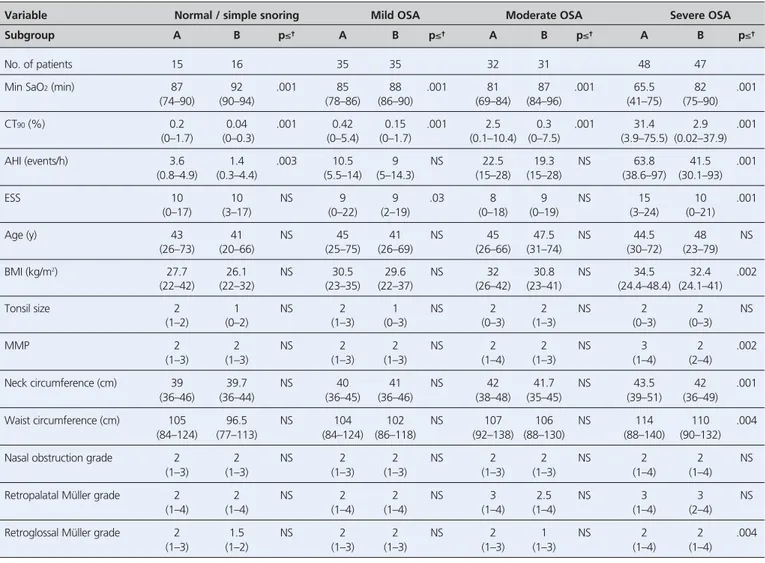
When patients in each category of OSA severity were considered in subgroups who had the lowest (A) and high-est (B) ST90values, the median ST90and CT90were
signifi-cantly different between subgroups A and B in all OSA severity categories (Table 4). Patient subgroups A and B also differed in median BMI (normal/simple snoring), AHI (mild and severe OSA), and ESS and MMP (severe OSA) (Table 4).
When patients in each category of OSA severity were considered in subgroups who had the lowest and highest min SaO2values, the median min SaO2and CT90were
significant-ly different between subgroups A and B in all OSA severity categories (Table 5). Patient subgroups A and B also differed in median AHI (normal/simple snoring), ESS (mild OSA), and AHI, ESS, BMI, MMP, neck and waist circumferences, and retroglossal Müller grade (severe OSA) (Table 5).
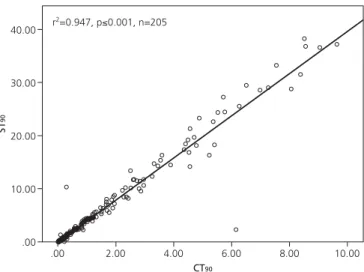
When patients were considered in subgroups who had CT90<10% (n=205) and ≥10% (n=54), significant
correla-tions between CT90and ST90and between CT90and min
SaO2were observed for CT90<10% category (Figs. 1 and
2). In CT90<10% category, the upper limit of ST90was 36
minutes (Fig. 1). Only 1 of 205 patients showed min SaO2
value <70% in the CT90 <10% category (Fig. 2). Three
patients (5%) who had moderate OSA exceeded this threshold, but 51 of 95 patients (54%) who had severe OSA exceeded this threshold, therefore 54 patients were in CT90≥10% category.
Discussion
The traditional AHI and oxygen desaturation index param-eters include the average number of apnea and hypopnea events per hour of sleep, regardless of duration and mor-phology of the apnea and hypopnea events that may have major effects on the induced physiologic stress.[11]
Other workers suggested that the severity of OSA should be strati-fied by a combination of AHI and other hypoxia variables to explore the possible causes of the dissociation between the severity of hypoxemia and AHI in some OSA subjects.[12–14]
The ST90and min SaO2are objective and easily available
parameters that represent the duration and depth of noctur-nal hypoxia. However, there is no consensus about the importance and superiority of these hypoxia parameters. A previous study about the clinical value of ST90in the
evalu-ation of chronic intermittent hypoxia in patients who had OSA showed a larger correlation coefficient between ST90
observed a slightly higher absolute value of the correlation coefficient between ST90and AHI or ESS than between min
SaO2and AHI or ESS (Table 2). Another study showed that
ST90was strongly correlated with AHI and total apnea
dura-tion (r=0.770 and 0.776).[13]
Furthermore, other workers showed that, after adjustment for BMI and other cardiovas-cular risk factors, ST90was the strongest independent
pre-dictor of high-sensitivity C-reactive protein elevation, which is associated with OSA severity; the severity of OSA may be better stratified by combining AHI and nocturnal chronic intermittent hypoxia variables, such as ST90 and
oxygen desaturation index, instead of AHI alone.[14]
In contrast, the 2007 American Academy of Sleep Medicine Manual for the Scoring of Sleep and Associated
Variable ST90 min SaO2
r p≤≤† R p≤≤† Age (y) 0.156 .02 -0.132 .04 Age (y) 0.156 .02 -0.132 .04 AHI (events/h) 0.772 .001 -0.748 .001 BMI (kg/m2) 0.468 .001 -0.462 .001 Neck circumference (cm) 0.365 .001 -0.375 .001 Waist circumference (cm) 0.469 .001 -0.446 .001 ESS 0.344 .001 -0.319 .001 OSA severity (1) 0.26 (0–6.93) .001 90 (74–94) .001 (2) 0.83 (0–18.28) 87 (78–92) (3) 4.83 (0.07–44.56) 83 (69–96) (4) 45.5 (0.17–337.36) 75 (41–90) BMI (kg/m2) (1) 0.27 (0.03–68.96) .001 89 (73–96) .001 (2) 1.3 (0–180.15) 86 (48–94) (3) 7.88 (0.07–313.08) 83 (46–92) (4) 51.77 (2.28–337.36) 73 (41–97) Tonsil size (0) 36.82 (0.08–146.65) NS 76 (68–93) NS (1) 2.05 (0–261.76) 85 (41–96) (2) 5.66 (0.03–337.36) 83 (46–93) (3) 4.31 (0–122.08) 83 (70–90) MMP (1) 0.88 (0.06–37.23) .001 86 (75–92) .001 (2) 2.38 (0–313.08) 86 (46–96) (3) 10 (0–337.36) 82 (41–93) (4) 59.83 (10.2–145.16) 70 (48–81) Nasal obstruction (1) 4.95 (0–286.03) NS 84 (41–94) NS (2) 4.56 (0–337.36) 84 (46–96) (3-4) 1.14 (0.18–313.08) 86 (57–90)
Retropalatal Müller grade (1) 0.82 (0–36.82) .002 87 (72–96) .001
(2) 2.28 (0–214.58) 86 (48–94)
(3) 6.81 (0–261.76) 83 (41–93)
(4) 18.90 (0–337.36) 80 (48–93)
Retroglossal Müller grade (1) 2 (0–168.2) .001 86 (67–96) .001
(2) 3.95 (0–337.36) 84 (48–94) (3) 16.47 (0.02–313.08) 79 (41–90) (4) 83.61 (16.3–328.31) 70 (58–83) ESS (1) 2 (0–222.81) .002 86 (46–96) .001 (2) 3.95 (0–328.31) 85 (56–94) (3) 11.07 (0.03–337.36) 81 (41–93) (4) 111.16 (0.7–313.08) 66 (48–87)
*Data reported as correlation coefficient r or median (range: minimum to maximum). †NS: not significant (p>0.05). AHI: apnea-hypopnea index; BMI: body mass index; ESS: Epworth sleepiness scale; min SaO2: minimum oxygen saturation; MMP: modified Mallampati; OSA: obstructive sleep apnea; ST90: total sleep time with oxygen sat-uration <90%.
Variable Variable r (95% CI) p≤ R2(%)
ST90 AHI 1.724 (1.468 to 1.981) .001 55
ESS 1.738 (0.719 to 2.756) .001
Neck circumference 2.110 (0.020 to 4.201) .05
min SaO2 AHI -0.288 (-0.332 to -0.244) .001 61
ESS -0.208 (-0.359 to -0.058) .007
BMI -0.238 (-0.428 to -0.048) .02
Retropalatal Müller grade 0.976 (0.093 to 1.859) .03 Retroglossal Müller grade -1.231 (-2.387 to -0.075) .04
*Data reported as correlation coefficient r (95% confidence interval). AHI: apnea-hypopnea index; BMI: body mass index; ESS: Epworth sleepiness scale; min SaO2: minimum oxygen saturation; ST90: total sleep time with oxygen saturation <90%.
Table 3. Multivariate linear regression of factors affecting total sleep time with oxygen saturation <90% and minimum oxygen saturation.*
Variable Normal / simple snoring Mild OSA Moderate OSA Severe OSA
Subgroup A B p≤† A B p≤† A B p≤† A B p≤† No. of patients 15 16 35 35 32 31 48 47 ST90(min) 0.13 0.7 .001 0.45 2.3 .001 1.6 13.4 .001 13.2 122 .001 (0–0.23) (0.3–7) (0–0.8) (1–18) (0.1–4.8) (5–45) (0.2–47) (49–337) CT90(%) 0.03 0.25 .001 0.11 0.56 .001 0.3 2.9 .001 3.7 32.2 .001 (0–0.07) (0–1.7) (0–0.2) (0–5) (0–1.3) (0–10) (0.04–19) (11–75) AHI (events/h) 1.4 2.75 NS 8.7 11.4 .005 19.5 22.5 NS 42.7 67.9 .001 (0.3–4.4) (0.8–4.9) (5–14.3) (5–14) (15–28) (15–28) (30.3–93) (30–97) ESS 10 10 NS 8 9 NS 7.5 10 NS 10 15 .002 (0–17) (0–17) (0–19) (2–22) (0–19) (0–18) (0–21) (1–24) Age (y) 39 43 NS 42 44 NS 43 47 NS 49 46 NS (20–66) (26–73) (26–69) (25–75) (30–66) (26–74) (23–79) (30–67) BMI (kg/m2) 26 28.2 .05 29.9 30 NS 30 32.1 NS 32.95 34.1 NS (21.9–29.6) (22–42) (23–37) (22–35) (25.3–42) (23–41) (24–46) (24–48) Tonsil size 1 2 NS 2 2 NS 2 2 NS 2 2 NS (0–2) (1–2) (0–3) (1–2) (1–3) (0–3) (0–3) (0–3) MMP 2 2 NS 2 2 NS 2 2 NS 2 3 .04 (1–3) (1–3) (1–3) (1–3) (1–3) (1–4) (1–4) (2–4) Neck circumference (cm) 39.5 39.7 NS 41 40 NS 41 42 NS 42 43.5 NS (36.5–42) (36–46) (36–45) (36–46) (37–45) (35–48) (36–49) (37–51) Waist circumference (cm) 97 106 .03 102 105 NS 105 110 NS 110 113 NS (77–107) (84–124) (84–118) (86–124) (93–138) (88–130) (96–140) (88–140)
Nasal obstruction grade 2 2 NS 2 2 NS 2 2 NS 2 2 NS
(1–3) (1–3) (1–3) (1–3) (1–3) (1–2) (1–3) (1–4)
Retropalatal Müller grade 2 2 NS 2 2 NS 3 3 NS 3 4 NS
(1–4) (1–4) (1–4) (1–4) (1–4) (1–4) (1–4) (2–4)
Retroglossal Müller grade 2 2 NS 2 1 NS 1 2 NS 2 2 NS
(1–2) (1–3) (1–3) (1–3) (1–3) (1–3) (1–4) (1–4)
*Data reported as median (range: minimum to maximum). The subgroups A and B contained patients with lowest and highest ST90values in the OSA severity category. †NS: not significant (p>0.05). AHI: apnea-hypopnea index; BMI: body mass index; CT90: percentage of cumulative sleep time with oxygen saturation <90%; ESS: Epworth sleepi-ness scale; MMP: modified Mallampati; OSA: obstructive sleep apnea; ST90: total sleep time with oxygen saturation <90%.
Table 4. Relation between measured variables and severity of obstructive sleep apnea for patients who had lowest and highest total sleep time with
Events recommended that nocturnal hypoxia should be classified by min SaO2,[10]and no changes in terminology
or measurement in oxygen saturation (SpO2) were
recom-mended in the 2012 update.[15]
Nocturnal min SaO2may
be an independent predictor of future carotid plaque bur-den, and other nocturnal SaO2parameters are not
associ-ated with carotid intima or media thickness or plaques, after adjusting for traditional cardiovascular disease risk factors.[16]
By analyzing both parameters separately in the present study, we observed that ST90 and min SaO2 were both
associated independently with AHI and ESS (Table 3).
Furthermore, ST90 was independently associated with
neck circumference, and min SaO2 was independently
associated with BMI (Table 3). Although the reliability of flexible pharyngoscopy with the Müller maneuver is con-troversial and potentially subjective, we observed an inde-pendent association between min SaO2 and both
retropalatal and retroglossal Müller grades.
A previous study evaluated the diagnostic potential of several novel parameters incorporating number, duration, and morphology of individual apnea and hypopnea events with complex formulas, to improve on limitations of the traditional AHI.[11]
To provide clinically useful
informa-Variable Normal / simple snoring Mild OSA Moderate OSA Severe OSA
Subgroup A B p≤† A B p≤† A B p≤† A B p≤†
No. of patients 15 16 35 35 32 31 48 47
Min SaO2(min) 87 92 .001 85 88 .001 81 87 .001 65.5 82 .001
(74–90) (90–94) (78–86) (86–90) (69–84) (84–96) (41–75) (75–90) CT90(%) 0.2 0.04 .001 0.42 0.15 .001 2.5 0.3 .001 31.4 2.9 .001 (0–1.7) (0–0.3) (0–5.4) (0–1.7) (0.1–10.4) (0–7.5) (3.9–75.5) (0.02–37.9) AHI (events/h) 3.6 1.4 .003 10.5 9 NS 22.5 19.3 NS 63.8 41.5 .001 (0.8–4.9) (0.3–4.4) (5.5–14) (5–14.3) (15–28) (15–28) (38.6–97) (30.1–93) ESS 10 10 NS 9 9 .03 8 9 NS 15 10 .001 (0–17) (3–17) (0–22) (2–19) (0–18) (0–19) (3–24) (0–21) Age (y) 43 41 NS 45 41 NS 45 47.5 NS 44.5 48 NS (26–73) (20–66) (25–75) (26–69) (26–66) (31–74) (30–72) (23–79) BMI (kg/m2) 27.7 26.1 NS 30.5 29.6 NS 32 30.8 NS 34.5 32.4 .002 (22–42) (22–32) (23–35) (22–37) (26–42) (23–41) (24.4–48.4) (24.1–41) Tonsil size 2 1 NS 2 1 NS 2 2 NS 2 2 NS (1–2) (0–2) (1–3) (0–3) (0–3) (1–3) (0–3) (0–3) MMP 2 2 NS 2 2 NS 2 2 NS 3 2 .002 (1–3) (1–3) (1–3) (1–3) (1–4) (1–3) (1–4) (2–4) Neck circumference (cm) 39 39.7 NS 40 41 NS 42 41.7 NS 43.5 42 .001 (36–46) (36–44) (36–45) (36–46) (38–48) (35–45) (39–51) (36–49) Waist circumference (cm) 105 96.5 NS 104 102 NS 107 106 NS 114 110 .004 (84–124) (77–113) (84–124) (86–118) (92–138) (88–130) (88–140) (90–132)
Nasal obstruction grade 2 2 NS 2 2 NS 2 2 NS 2 2 NS
(1–3) (1–3) (1–3) (1–3) (1–3) (1–3) (1–4) (1–4)
Retropalatal Müller grade 2 2 NS 2 2 NS 3 2.5 NS 3 3 NS
(1–4) (1–4) (1–4) (1–4) (1–4) (1–4) (1–4) (2–4)
Retroglossal Müller grade 2 1.5 NS 2 2 NS 2 1 NS 2 2 .004
(1–3) (1–2) (1–3) (1–3) (1–3) (1–3) (1–4) (1–4)
*Data reported as median (range: minimum to maximum). The subgroups A and B contained patients with lowest and highest min SaO2values in the OSA severity category. †NS: not significant (p>0.05). AHI: apnea-hypopnea index; BMI: body mass index; CT90: percentage of cumulative sleep time with oxygen saturation <90%; ESS: Epworth sleepiness scale; min SaO2: minimum oxygen saturation; MMP: modified Mallampati; OSA: obstructive sleep apnea.
Table 5. Relation between measured variables and severity of obstructive sleep apnea for patients who had lowest and highest minimum oxygen
tion, we used a similar grouping system with easily avail-able, objective hypoxia parameters ST90and min SaO2.
In patients within the OSA severity categories who were divided into subgroups A and B based on the values of ST90 and min SaO2, both ST90 and min SaO2showed
significant variation within OSA severity categories (Tables 4 and 5). However, we observed no significant dif-ferences in most physical variables between subgroup A and B in mild and moderate OSA (Tables 4 and 5). In con-trast, in the severe OSA category, the subgroups A and B based on min SaO2differed significantly in several
physi-cal variables including BMI, MMP, neck and waist cir-cumference and retroglossal Müller grades (Table 5). However, in severe OSA category, according to the ST90,
comparison of A and B subgroups showed no significant differences in physical variables aside from MMP grade (Table 4). Although all these patients were in the same (severe) OSA category, both hypoxia severity and physical abnormalities were associated with large variation in min SaO2. These results suggest that severity of the physical
abnormalities may be associated with the depth more than duration of hypoxia in severe OSA. The clinical utility of these findings may be interpreted by the success of surgi-cal treatment in severe OSA.
In a study of 90 severe OSA patients who underwent multilevel surgery including modified tongue base suspen-sion combined with uvulopharyngopalatoplasty, the ST90
may have enabled better identification of patients in whom surgical success was probable. The ST90≤36 min may be
the best cutoff value for surgical success. They reported that surgical success was 100% in patients who had ST90
≤36 min, but only 8% in patients who had ST90>36 min.[17]
However, another study of 119 OSA patients who under-went velopharyngeal surgery, including uvulopharyn-gopalatoplasty with transpalatal advancement pharyngo-plasty, showed that CT90 rather than AHI was an
inde-pendent predictor of surgical success.[18]
It may be useful to categorize CT90 into level variables containing 4 levels
(CT90: grade 1, <10; grade 2, 10–20; grade 3, 20-40; grade
4 ≥40).[18]
Similar hypoxia levels were observed in both stud-ies[17,18]
as cutoff value of surgical success. In CT90 <10%
category, the upper limit of ST90was 36 minutes (Fig. 1).
Furthermore, in the present study, only 1 of 205 patients showed min SaO2value < 70% in the CT90<10%
catego-ry (Fig. 2). These findings suggested that there is a rela-tion between hypoxia parameters. It can be extrapolated that the cutoff value for CT90 <10% may correspond to
ST90 36 min, and correspond to min SaO270%. Surgical
success rate may decrease markedly when this hypoxia threshold is exceeded, possibly because the balance between neurophysiologic feedback mechanisms and the absolute anatomic patency of the airway during sleep may be impaired remarkably beyond this threshold. In the present study, only 3 patients who had moderate OSA and 51 of 95 patients who had severe OSA exceeded this threshold (CT90≥10%).
Fig. 1.Relation between percentage of cumulative sleep time with
oxy-gen saturation <90% (CT90) and sleep time with oxyoxy-gen saturation <90% (ST90). Variation of ST90with CT90in CT90<10% category.
Fig. 2. Relation between percentage of time with oxygen saturation
<90% (CT90) and minimum oxygen saturation (min SaO2). Variation of min SaO2with CT90in CT90<10% category.
100 90 80 70 60 .00 2.00 4.00 6.00 8.00 10.00 CT90 Min SaO 2 r2=0.553, p≤0.001, n=205
Limitations of the present study include the retrospec-tive design and potential for selection and referral bias asso-ciated with a single-institution analysis. In addition, the study lacked the follow-up data and analysis of other possi-ble confounders such as anthropometric measurements, comorbidities, smoking, and inflammatory markers. Furthermore, the results may not be extended to women because the study included only men.
Conclusion
Hypoxia parameters (ST90, CT90, and min SaO2) show
sig-nificant variation within OSA severity categories and may provide useful information to clinicians about OSA disease severity and risk of health consequences. None of the phys-ical parameters had clinphys-ically useful relations with hypoxia parameters in OSA patients except patients who had severe OSA. According to previously published[17,18]hypoxia
thresh-olds, the probability of surgical success may be high for mild, moderate, and some severe OSA patients. However, for some moderate and severe OSA patients, surgical success may be limited, and these patients may be differentiated by hypoxia parameters. Clinicians should be aware of the rela-tions between different hypoxia parameters to interpret study results and create appropriate treatment strategies.
Conflict of Interest: No conflicts declared.
References
1. Schwab RJ, Goldberg AN. Upper airway assessment: radi-ographic and other imaging techniques. Otolaryngol Clin North Am 1998;31:931–68.
2. Thakkar K, Yao M. Diagnostic studies in obstructive sleep apnea. Otolaryngol Clin North Am 2007;40:785–805.
3. Ryan CM, Bradley TD. Pathogenesis of obstructive sleep apnea. J Appl Physiol (1985) 2005;99:2440–50.
4. Pang KP. Preface. In: Pang KP, Rotenberg BW, Woodson BT, editors. Textbook of advanced surgical techniques in snoring and obstructive sleep apnea. San Diego, CA: Plural Publishing; 2013. p. ix–x.
5. Dreher A, de la Chaux R, Klemens C, et al. Correlation between otorhinolaryngologic evaluation and severity of obstructive sleep apnea syndrome in snorers. Arch Otolaryngol Head Neck Surg 2005;131:95–8.
6. Bostanci A, Turhan M, Bozkurt S. Factors influencing sleep time with oxygen saturation below 90% in sleep-disordered breath-ing. Laryngoscope 2015;125:1008–12.
7. Roeslani RU, Woodson BT. Pathophysiology, signs, and symp-toms of OSA. In: Pang KP, Rotenberg BW, Woodson BT, editors. Textbook of advanced surgical techniques in snoring and obstruc-tive sleep apnea. San Diego, CA: Plural Publishing; 2013. p. 1–14. 8. Lavie L. Obstructive sleep apnoea syndrome – an oxidative stress
disorder. Sleep Med Rev 2003;7:35–51.
9. Prabhakar NR, Kumar GK. Oxidative stress in the systemic and cellular responses to intermittent hypoxia. Biol Chem 2004;385: 217–21.
10. Iber C, Ancoli-Israel S, Chesson AL Jr, Quan SF. The AASM manual for the scoring of sleep and associated events: rules, ter-minology and technical specifications. Westchester, IL: American Academy of Sleep Medicine; 2007.
11. Kulkas A, Tiihonen P, Julkunen P, Mervaala E, Töyräs J. Novel parameters indicate significant differences in severity of obstruc-tive sleep apnea with patients having similar apnea-hypopnea index. Med Biol Eng Comput 2013;51:697–708.
12. Li JR, Sun JJ, Zhang R, Li CF, Hu Y, Sun YM. Clinical value of TS90% in evaluation of hypoxemia in patients with obstructive sleep apnea/hypoventilation syndrome. [Article in Chinese] Zhonghua Yi Xue Za Zhi 2005;85:3115–7.
13. Li Q, Jin XJ. Correlations between the duration and frequency of sleep apnea episode and hypoxemia in patients with obstruc-tive sleep apnea syndrome. [Article in Chinese] Zhonghua Er Bi Yan Hou Tou Jing Wai Ke Za Zhi 2009;44:825–30.
14. Zhang XB, Zen HQ, Lin QC, Chen GP, Chen LD, Chen H. TST, as a polysomnographic variable, is superior to the apnea hypopnea index for evaluating intermittent hypoxia in severe obstructive sleep apnea. Eur Arch Otorhinolaryngol 2014;271: 2745–50.
15. Berry RB, Budhiraja R, Gottlieb DJ, et al.; American Academy of Sleep Medicine. Rules for scoring respiratory events in sleep: update of the 2007 AASM Manual for the Scoring of Sleep and Associated Events. Deliberations of the Sleep Apnea Definitions Task Force of the American Academy of Sleep Medicine. J Clin Sleep Med 2012;8:597–619.
16. Gunnarsson SI, Peppard PE, Korcarz CE, et al. Minimal noctur-nal oxygen saturation predicts future subclinical carotid atheroscle-rosis: the Wisconsin sleep cohort. J Sleep Res 2015;24:680–6. 17. Turhan M, Bostanci A, Bozkurt S. Predicting the outcome of
modified tongue base suspension combined with uvu-lopalatopharyngoplasty. Eur Arch Otorhinolaryngol 2015;272: 3411–6.
18. Zhang J, Li Y, Cao X, et al. The combination of anatomy and physiology in predicting the outcomes of velopharyngeal sur-gery. Laryngoscope 2014;124:1718–23.
This is an open access article distributed under the terms of the Creative Commons Attribution-NonCommercial-NoDerivs 3.0 Unported (CC BY-NC-ND3.0) Licence (http://creativecommons.org/licenses/by-nc-nd/3.0/) which permits unrestricted noncommercial use, distribution, and reproduc-tion in any medium, provided the original work is properly cited.
Please cite this article as: Avc› S, Y›lmaz Avc› A, Lakadamyal› H, Ayd›n E. Hypoxia parameters, physical variables, and severity of obstructive sleep apnea.