Investigation of Mechanical Properties of E-Waste Added Concrete after Exposure to High Temperatures
Ali Serkan SAVAŞ1* and Ahmet Ferhat BİNGÖL1 1Atatürk University, Civil Engineering Department, 25240, ERZURUM
aliserkansavas@hotmail.com afbingol@atauni.edu.tr
Abstract
In this study, certain mechanical behaviors of concretes that were added e-waste instead of fine aggregates under high temperature were investigated. The total binder was kept constant at 340 kg / m3 and the water / binder ratio was 0.51 in all mixtures. Concrete samples in which e-waste were substituted for fine aggregate in the ratios of 5%, 10%, 15% and 20% by weight were produced as well as control samples that do not contain e-waste so that a comparison could be performed. Cube concrete samples produced with the dimensions of 15x15x15 cm were subjected to standard water curing for 28 days, and then each sample was weighed for unit weight. After the samples were exposed to different temperatures, compressive strengths, bending tensile strengths were measured water and water absorption tests were performed. The samples produced were subjected to 100 ° C and 500 ° C temperature effects including the room temperature (25 ° C). As E-Waste ratio increases, compressive strength decreases. The observed decrease in strength increases with increasing temperature. Tensile strength increases as the E-Waste ratio increases, Although the tensile strength increased with increasing E-Waste ratio, the ratio of compressive strength to tensile strength increased with increasing E-waste ratio.This shows that E-Waste increases the ductility even if the material compressive strenght decreases.
Received:04.02.2020 Accepted:02.03.2020 Published:24.06.2020
*Corresponding author: Ali Serkan SAVAŞ, Atatürk Üniversitity Civil Engineering Department E-mail:aliserkansavas@hotmail.com
Cite this article as: A. S. Savaş, A. F. Bingöl Investigation Of Mechanical Properties Of E-Waste Added Concrete After Exposure To High Temperatures, Eastern Anatolian Journal of Science, Vol. 6, Issue 1, 1-10,2020.
Unit weights are measured each time E-Waste ratio increases and unit weights decrease. Water
absorption rates by weight and volume were measured according to the TS 12390-7. Water absorption by volume and weight increases with the e-waste ratio.
Keywords: E-Waste, High Temperature, Concrete
1. Introduction
Concrete is the most frequently used as construction material in civil engineering. Changing concrete components to improve certain characteristics of concrete and improving concrete performance by using different materials as well as using various waste materials to produce economic concretes have been part of the concrete technology for a long time.
The increasing use of electronic devices in today’s world, the need for constant renewal with the common use of electronic devices and the increasing electronic waste amount is an environmental problem that is faced today. From this perspective, research on using e-waste in concretes has received a growing attention lately. With this approach, both e-waste would be eliminated and its damaging effects to the environment would be eliminated, and the amount of aggregate used in concrete would be decreased which would result in more economical productions as well as preserving the limited aggregate resources.
As it is known that there can be changes in both the mechanical and physical characteristics of the concrete exposed to high temperatures. High temperature which is one of the main physical effects that may cause durability problems in structures can lead to permanent damages and malfunctions which would cause loss of life and property.
High temperatures cause impairments in concrete structure. Available water in capillary and gel-spaces evaporates at 100-150°C. When the temperature reaches 150-250°C, capillary cracks occur in concrete due to contraction and the tensile strength of the concrete decreases. With the removal of the water that is chemically bound at 300°C, the extent of damage increases and the compression strength decreases. At temperatures above 400°C, disruptions in the C-S-H structure being and at 900°C the C-S-H
structure is completely disrupted which lead to significant losses (Baradan 2010).
Concretes with e-waste added rather than the coarse aggregate were produced in studies conducted by Lakshima and Nagan (2011). It was reported that e-plastic waste can be used as aggregate in the coarse aggregate up to 15% of the weight and in concrete with fly ash 10% of the weight instead of cement.
In a study conducted by A. Muthadhi (2017) on concrete containing e-plastic waste, concrete was produced using 0%, 10%, and 20% with a grain diameter of maximum 20mm of e-waste as coarse aggregate. They reported that e-waste can be used as a substitute for coarse aggregate with a ratio of 10% and this would not affect processability. At the same time, it was reported that the splitting tensile of concrete may have been affected by the characteristics of the interfacial transition area in the tensile splitting strength experiement and therefore, the free water accumulated on the surfaces of plastic particules and plastic surfaces could lead to a weaker adhesion between the aggregate, cement mortar and E-waste. In a study conducted by Khalid Iqbal , e-waster was added instead of coarse aggregate at a ratio of between 0 and 50%. It was reported that it is possible to use e-waste up to 24% of the coarse aggregate, and that savings could be achieved in the production costs of concrete (3%).
In another study conducted by J Junak, N Junakova1 and V Csiszar (2019) in which e-waste was used instead of aggregate as filling material at the ratios of 5%, 10%, and 20%. Compressive strength and bending tension experiments were performed. It was reported that the compressive strength decreases as e-waste increases while bending tension decreases as the ratio of e-waste increases. With the increase of e-waste ratio, the bending beam fracture is delayed and therefore, provides a partial reinforcement for bending tension.
Senthil Kumar and Baskar(2015) conducted an experimental study on structural concrete in which they used e-plastic waste instead of coarse aggregate. They reported that the processability of the mixture decreases as the ratio of e-plastic waste increases. Also, compressive strength, tensile splitting strength and bending tensile strength decreased and the unit weights decreased in comparison to the control group. It was stated that such concrete can be used in light elements that are non-bearing.
According to a study by Dhanraj & Selvamony (2015) in which fine aggregate was partially replaced by e-waste, e-waste aggregate can be used up to 5% of weight of fine aggregate.
Asha (2015) conducted a study to examine the strength characteristics of concrete with e-waste and used e-waste instead of fine aggregate at the ratios of 10%, 20% and 30%. They showed that compressive, tensile splitting and bending tensile strength decrease with the increase in the amount of e-waste. This decrease in strength causes a weak bond force between cement mortar and e-waste and the decrease in density due to an increase in matrix gaps causes the reduction in strength.
In the current study, mechanical characteristics of e-waste added concrete instead of fine aggregate following high temperature impact were examined. Concrete mixes were produced by mixing fine aggregates and e-waste in different ratios and the samples were kept in curing for 28 days. Within this scope, compressive strengths, bending tension strength, unit weights before and after high temperature, and water absorption rates by weigth and volume according to TSE 12390-7 were compared following an exposure to 100oC and 500oC temperatures.
2. Experimental Study 2.1. Materials Used
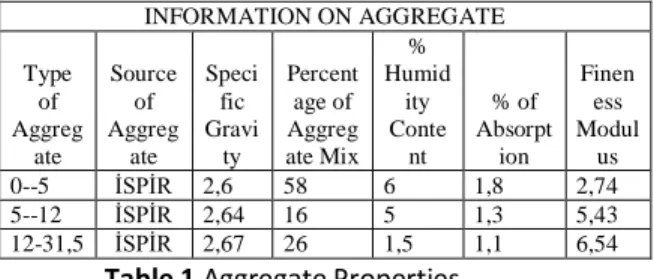
In the study, crushed stones with a grain dimeter of 31.5 mm maximum and crushed sand were used. The saturated surface dry specific gravity, the absorption rates and moisture components of aggregates are presented in Table 1.
Table 1 Aggregate Properties
CEM I 42.5 R type cement obtained from Askale Cement factory was used. The chemical and mechanical characteristics of the cement used are presented in Table 2. INFORMATION ON AGGREGATE Type of Aggreg ate Source of Aggreg ate Speci fic Gravi ty Percent age of Aggreg ate Mix % Humid ity Conte nt % of Absorpt ion Finen ess Modul us 0--5 İSPİR 2,6 58 6 1,8 2,74 5--12 İSPİR 2,64 16 5 1,3 5,43 12-31,5 İSPİR 2,67 26 1,5 1,1 6,54
E-waste with a specific weight of 1.3 gr/ cm3 obtained from Izmit Exitcom recycling facility were granulated and screened in E-waste
Chemical Analysis SiO2(%) 18,59 AlO3(%) 4,75 Fe2O3(%) 3,41 CaO(%) 63,59 MgO(%) 1,11 Na2O(%) 0,49 K2O(%) 0,77 SO3(%) 3,39 Cl(%) 0,016 Ignition Loss 3,03 Free CaO(%) 1,56 Mechanical Characteristics Initial Set (Minute) 160 Final Set (Minute) 203 Density (gr/cm3) 3,15 Volumetric Expansion (cm) 1,1 Specific Surface (blaine cm2/gr) 3740
Table 2 Chemical composition of cement, and certain
physical and mechanical characteristics
2.2. Concrete Designs
The mixture ratios of concrete samples are provided in Table 3. The cement dosage amount in all concrete mixtures was 340 kg/m3 and water amounts was 175 kg/m3. These ratios were kept stable. In each group, 18 cubical samples with the dimensions of 150x150x150 mm and 3 beam samples with the dimensions of 100x100x400 mm were produced. First, a mixture calculation was performed for C25/30 and a sample was poured to identify the 7-day compressive strength. After determining that the mixture would provide the targeted compressive strength, the E-waste containing groups were produced based on the calculations performed previously. The concrete designs were completed to contain E-waste at the ratios of 5% (E5N95), 10% (E10N90), 15% (E15N85) and 20 % (E20N80) of the fine aggregate. Samples were removed from the molds at the end of 24 hours and subjected to standard water treatment for 28 days. The experiments were performed following these procedures.
2.3 Experiments Performed
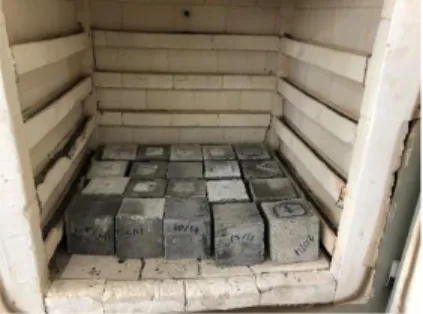
Following the treatment, compressive strength experiments were completed on the samples that were kept in room temperature, and the samples that were exposed to 100°C and 500°C temperatures. The oven used for high temperature application is shown in Figure 1.
Figure 1 Interior of a High Temperature Oven
The concrete compression machine used to identify the compressive strength of cubical samples according to TS EB 12390-3 is shown in Figure 2. The 23°C, 100°C and 500°C used in the graphs refer to compressive strength values respectively. The compression machine used for bending tension strength is shown in Figure 2. Unit weight
Figure 2 Concrete Compression Machine and Bending tension
Table 3. Mixture Ratio of Concrete Samples
3. Experiment Results And Discussion 3.1. Saturated Dry Surface Unit Weight
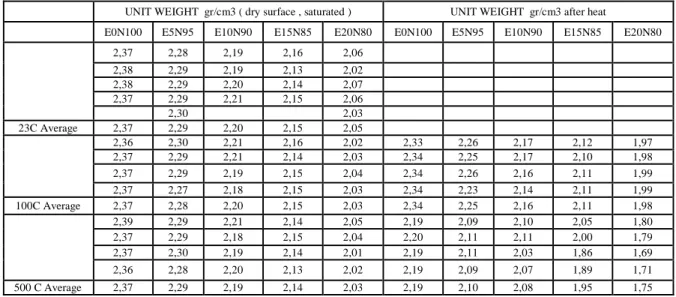
The samples stored in the treatment pool for 28 days were removed from the pool and dried with a towel to obtain a saturated dry surface and their weigths were measured. The samples prepared for 23°C, 100°C and 500°C were weighed both before and after the baking. The unit weights obtained are presented in Table 4. It was found that the unit weights of all the groups with e-waste added were lower than the control group. We can attribute the decrease in unit weights compared to the control sample, respectively, for two reasons. The first is that E-waste has less specific weight, and the second is that as the percentage of E-waste increases, the unit weight decreases.
The unit weights of the E5N95, E10N90, E15N85 and E20N80 groups in room temperature (23°C) were 3.37%, 7.17%, 9.28%. and 13.50% respectively, which are lower than the control group. After the exposure to 100°C, the loss in unit weights for all the groups was between 0.5% and 3%. The loss in the unit weight may be due to the evaporation of the water in the capillary spaces. After the exposure to 500°C, unit weights for each concrete sample showed a decrease in comparison to the previous temperature. The main reason for this is the melting of the e-waste, the decrease in the unit specific gravity, and the evaporation of the gel absorption water.
Table 4. Unit Weight of Samples by Temperature
MATERIALS VOLUME(dm3) DKY Specific Gravity Amount in 1 m3 of Concrete (kg) Surface Moisture Correction Corrected Amount in 1 m3 of Concrete (kg) CEMENT 109 3,11 340 - 340 MIXING WATER 175 1,00 175 56,63 118,37 AIR %2 20 - - - - WATER REDUCING ADMIXTURE 3 1,18 3,4 - 3,4 0--5 aggregate 402 2,6 1045 43,88 1088,88 5--12 aggregate 111 2,64 293 10,83 303,83 12-19 aggregate 180 2,67 481 1,92 482,92 TOTAL 1000 dm3 2337,4 2337,4
UNIT WEIGHT gr/cm3 ( dry surface , saturated ) UNIT WEIGHT gr/cm3 after heat
E0N100 E5N95 E10N90 E15N85 E20N80 E0N100 E5N95 E10N90 E15N85 E20N80 2,37 2,28 2,19 2,16 2,06 2,38 2,29 2,19 2,13 2,02 2,38 2,29 2,20 2,14 2,07 2,37 2,29 2,21 2,15 2,06 2,30 2,03 23C Average 2,37 2,29 2,20 2,15 2,05 2,36 2,30 2,21 2,16 2,02 2,33 2,26 2,17 2,12 1,97 2,37 2,29 2,21 2,14 2,03 2,34 2,25 2,17 2,10 1,98 2,37 2,29 2,19 2,15 2,04 2,34 2,26 2,16 2,11 1,99 2,37 2,27 2,18 2,15 2,03 2,34 2,23 2,14 2,11 1,99 100C Average 2,37 2,28 2,20 2,15 2,03 2,34 2,25 2,16 2,11 1,98 2,39 2,29 2,21 2,14 2,05 2,19 2,09 2,10 2,05 1,80 2,37 2,29 2,18 2,15 2,04 2,20 2,11 2,11 2,00 1,79 2,37 2,30 2,19 2,14 2,01 2,19 2,11 2,03 1,86 1,69 2,36 2,28 2,20 2,13 2,02 2,19 2,09 2,07 1,89 1,71 500 C Average 2,37 2,29 2,19 2,14 2,03 2,19 2,10 2,08 1,95 1,75
3.2. Water absorption by weight and volume
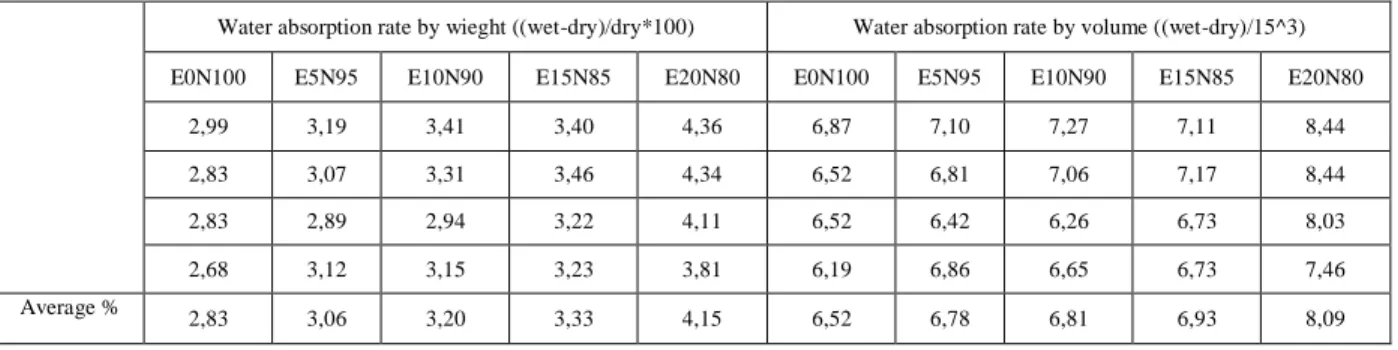
The samples were kept in 1000C three times with 24-hour intervals until the weight loss was 0.2% according to TS 12390-7 and measurements were taken every 24 hours. The water absorption rates by weight and volume are presented in Table 5 and the results are presented in Table 6.
The water absorption rates by weight and volume increase as the amount of e-waste increases. The water absorption rate by weight in the E20N80 group that contains 20% e-waste showed an increase up to 4.15%. This increase can be explained by the strength of adherence of plastic waste with cement mortar. It is thought that the strength is affected by formation of aerated concrete due to e-waste use. The water absorption values by weight and volume are presented in Figure 3.
Table 5 Unit Weights of Samples that are Saturated and Dried in Incubator
Sample weights measured after the first 24 hours (gr)
E0N100 E5N95 E10N90 E15N85 E20N80
7864 7632 7314 7156 6637 7890 7607 7318 7102 6684 7898 7629 7287 7137 6710 7898 7532 7221 7122 6710 AVERAGE 7887,5 7600 7285 7129,25 6685,25 SECOND WEIGHING
E0N100 E5N95 E10N90 E15N85 E20N80
7836 7601 7284 7129 6603 7863 7572 7283 7071 6653 7864 7591 7255 7110 6686 7870 7504 7192 7098 6681 AVERAGE 7858,25 7567 7253,5 7102 6655,75 THIRD WEIGHING
E0N100 E5N95 E10N90 E15N85 E20N80
7754 7523 7206 7063 6537 7786 7496 7215 7006 6581 7791 7511 7197 7053 6611 7794 7433 7134 7043 6619 AVERAGE 7781,25 7490,75 7188 7041,25 6587 FOURTH WEIGHING
E0N100 E5N95 E10N90 E15N85 E20N80
7743,14 7510,21 7196,63 7050,99 6525,23
7775,10 7486,26 7205,62 6994,09 6569,15
7780,09 7501,24 7187,64 7041,01 6599,10
7783,09 7423,34 7124,73 7031,03 6607,09
Water absorption rate by wieght ((wet-dry)/dry*100) Water absorption rate by volume ((wet-dry)/15^3) E0N100 E5N95 E10N90 E15N85 E20N80 E0N100 E5N95 E10N90 E15N85 E20N80
2,99 3,19 3,41 3,40 4,36 6,87 7,10 7,27 7,11 8,44 2,83 3,07 3,31 3,46 4,34 6,52 6,81 7,06 7,17 8,44 2,83 2,89 2,94 3,22 4,11 6,52 6,42 6,26 6,73 8,03 2,68 3,12 3,15 3,23 3,81 6,19 6,86 6,65 6,73 7,46 Average % 2,83 3,06 3,20 3,33 4,15 6,52 6,78 6,81 6,93 8,09
Table 6 Water Absorption Rates by Weight and Volume According to TS 12390-7
Figure 3. Change in Water Absorption by Weight and Volume
3.3. Compressive Strength
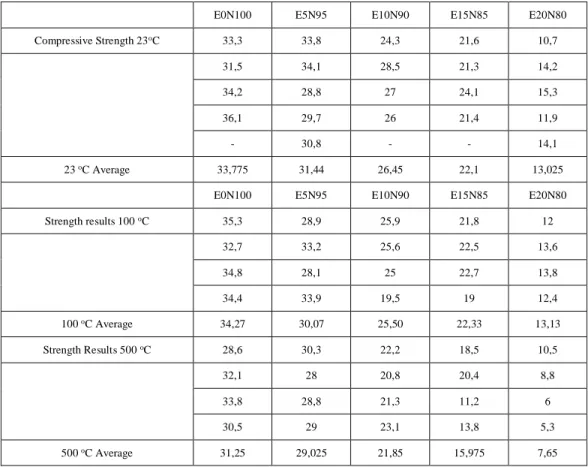
4 samples from each group were kept in the oven at 100°C and 500°C temperature for 3 hours, and then cooled down to room temperature. Compressive strength tests were then performed on these samples. The results of the compressive strength tests on samples exposed to high temperatures and the results of the control group kept in room temperature are provided in Table 7. A graphic representation is presented in Figure 4.
The results in Table 7 shows a systematic decrease in compressive strength with an increase in
the amount of e-waste for all temperatures. The 28-day compressive strength of E5N95, E10N90, E15N85 and E20N80 that were not exposed to high temperatures are 7%, 21.65%, 34.5%, and 60% lower respectively, in comparison to the control group. These results show similarity with the study conducted by Lakshima(2011) on strength of concrete containing e-waste. Similar results are also reported in Senthil Kumar’s (2015) study. The compressive strength results of the same group following an exposure to 1000C were 12.25%, 25.59%, 34.84%, and 61.68% lower, respectively, in comparison to the control group. The decrease rates in the compressive strength 0 1 2 3 4 5 6 7 8 9 E 0 N 1 0 0 E 5 N 9 5 E 1 0 N 9 0 E 1 5 N 8 5 E 2 0 N 8 0 % W AT E R AB SO RPT İO N B Y W E İG H T AND VO L UM E %
results following the exposure to 5000C were 7.12%, 30.08%, 48.88%, and 75.52%, respectively. The lower compressive strength in concrete containing e-waste may be due to two reasons. First reason may be the decrease of strength due to the weak bond between e-waste particules and the cement mortar while the second reason may be low strength because of the increase in spaces. These results show similarity with the study conducted by Asha (2015) on examining the strength characteristics of concrete containing e-waste. Considering the relationship between the water absorption rates by weight and volume, and the compressive strength, the main reason for the decrease in strength may be an increase in space.
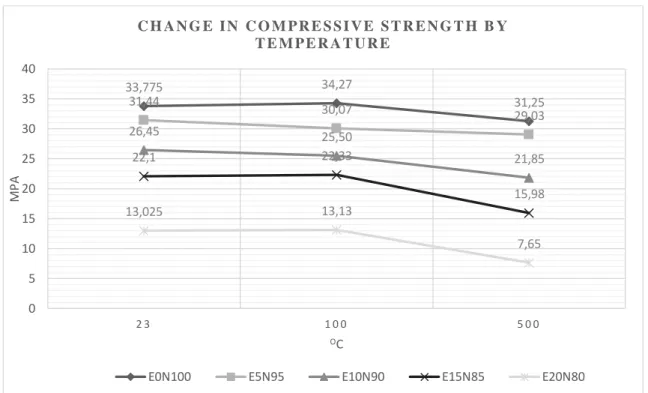
When the temperature effect is examined, although the control sample not containing e-waste showed a little increase at 1000C, the compressive strengths in all other samples decreased as the temperature increased. The reason for this can be said to stem from, as stated by Asha, the decrease in strength due to the weak bond between e-waste particles and the cement mortar, and the increase in spaces due to low strength (Figure 5).
Table 7. Compressive Strength Test Results
E0N100 E5N95 E10N90 E15N85 E20N80 Compressive Strength 23oC 33,3 33,8 24,3 21,6 10,7 31,5 34,1 28,5 21,3 14,2 34,2 28,8 27 24,1 15,3 36,1 29,7 26 21,4 11,9 - 30,8 - - 14,1 23 oC Average 33,775 31,44 26,45 22,1 13,025
E0N100 E5N95 E10N90 E15N85 E20N80
Strength results 100 oC 35,3 28,9 25,9 21,8 12 32,7 33,2 25,6 22,5 13,6 34,8 28,1 25 22,7 13,8 34,4 33,9 19,5 19 12,4 100 oC Average 34,27 30,07 25,50 22,33 13,13 Strength Results 500 oC 28,6 30,3 22,2 18,5 10,5 32,1 28 20,8 20,4 8,8 33,8 28,8 21,3 11,2 6 30,5 29 23,1 13,8 5,3 500 oC Average 31,25 29,025 21,85 15,975 7,65
Figure 4. Change in Compressive Strength by Temperature
3.4 Single Point Bending Tension
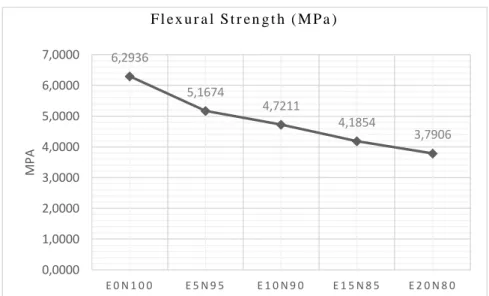
The bending tension strength of the control mixture, E5N95, E10N90, E15N85 and E20N80 are presented in Table 8. The bending tension strengths of the E5N95, E10N90, E15N85 and E20N80 concrete were 18%, 25%, 34%, and 40% lower than the control group, respectively (Figure 5). The decrease in the bending tension can be explained with the decrease in compressive strength.
On the other hand, the ratio of tensile strength to compressive strength for E5N95, E10N90, E15N85 and E20N80 were 18.6%, 16.4%, 17.84%, 18.93%, and 29.10%, respectively (Figure 6). This ratio is thought to increase as the e-waste amount increases. The ratio of tensile strength to compressive strength being 29.10% for the E20N80 sample is due to the ductile behavior of the material. This is explained by the shift from brittle fracture to ductile fracture as the
bending tension fractures increase with the plastic amount. J Junak, N Junakoval, and V Csiszar performed bending tension experiments in their study.
They reported that the bending tension strength decreased as the e-waste amount increased. These results are similar to the results of this study. It was reported that the bending beam fracture is delayed with the increase in the amount of e-waste which provides partial strengthening for bending tension.
The decrease in bending tension is thought to be impacted by the characteristics of the interfacial transition area and therefore, the free water accumulated on the surface of plastic particles and the plastic surface cause a weaker adhesion between the aggregate, cement mortar and the e-waste. Same results were provided in a study conducted by Muthadhi , A. Mohamed Basid , R. Madivarma , J.Satheesh Kumar , R. Raghuvarman (2017) on concrete containing e-plastic waste.
33,775 34,27 31,25 31,44 30,07 29,03 26,45 25,50 21,85 22,1 22,33 15,98 13,025 13,13 7,65 0 5 10 15 20 25 30 35 40 2 3 1 0 0 5 0 0 M P A OC C H A N G E I N C O M P R E S S I V E S T R E N G T H B Y T E M P E R A T U R E
DIMENSIONS MAX FRACTURE FORCE N BENDING STRENGTH N/mm2 (σe= 3PL/2bd2) BENDING STRENGTH average N/mm2 COMPRESSIVE STRENGTH STRENGTH/ COMPRESSİVE RATIO % Base (b, mm) Height (h, mm) Span (L, mm) E0N100 100,00 100,00 350,00 10898,91 1,48 1,63 33,78 0,05 12497,94 1,70 12566,61 1,71 E5N95 100,00 100,00 350,00 9535,32 1,30 1,34 31,44 0,04 10035,63 1,37 9957,15 1,35 E10N90 100,00 100,00 350,00 8829,00 1,20 1,22 26,45 0,05 8976,15 1,22 9172,35 1,25 E15N85 100,00 100,00 350,00 8220,78 1,12 1,08 22,10 0,05 7671,42 1,04 8024,58 1,09 E20N80 100,00 100,00 350,00 7808,76 1,06 0,98 13,03 0,08 7180,92 0,98 6670,80 0,91
Table 8 Calculated Values of Bending Tension Strength
Figure 5. The results of the bending tension strength experiment
Figure 6. Bending Tension Strength/Compressive Strength Ratio
6,2936 5,1674 4,7211 4,1854 3,7906 0,0000 1,0000 2,0000 3,0000 4,0000 5,0000 6,0000 7,0000 E 0 N 1 0 0 E 5 N 9 5 E 1 0 N 9 0 E 1 5 N 8 5 E 2 0 N 8 0 M P A F l e x u r a l S t r e n g t h ( M P a ) 18,6339171 16,4358063 17,84900756 18,9386267 29,10237236 0 5 10 15 20 25 30 35
E0N100 E5N95 E10N90 E15N85 E20N80
%
The Ratio of Bending Strength to
Compressive Strength (%)
4. Conclusion
The results of this experimental study showed that it is possible to use e-waste in certain amounts, particularly in non-structural applications, as a substitute for fine aggregate and that the e-waste can be an alternative material as aggregates. The results of the study are summarized below.
- The weight of the concrete decreases as the e-waste percentage increases. Thus, e-waste added concrete can be used in light concrete effectively.
- The compressive strength of samples with e-waste were 7%, 21.65%, 34.5%, and 60% lower than the control mix. At 1000C, they were 12.25%, 25.59%, 34.84%, and 61.68% lower than the control sample while at 5000C, they were 7.12%, 30.08%, 48.88%, and 75.52% lower. Due to the weak adhesion between e-waste particles and the cement mortar, the strength decreases. Due to the increase in porosity which decreases density, the compressive strength decreases. When the water absorption ratios by weight and volume are compared to compressive strength, the reason for a decrease is the increase in spacing. Particularly, the concrete containing 5% e-waste can be used with different mixture calculations in areas where strength is needed
- The water absorption rate increased as the amount of e-waste used increased. At the same time, the ductility of the material increased. The use of e-waste at a certain ratio increases the space ratio and ductility which increases the material’s ability of fatigue. Therefore, the resistance to freeze and thaw should be researched with freeze-thaw tests.
As the e-waste ratio increases, it can be used in concrete that do not require strength.
5.References
BARADAN, B., Yapı Malzemesi II, s. 1-35, Dokuz Eylül Üniversitesi Mühendislik Fakültesi Yayınları, Yayın no 207, İzmir, 2000.
TOPÇU, İ.B., Beton Teknolojisi, s. 49-55, Osmangazi Üniversitesi, Eskişehir, Haziran, 2006. GÜNER, M. S., SÜME, V. Yapı Malzemesi ve Beton,
s. 33-55, Aktif Yayınevi 3. Baskı, İstanbul, Ağustos, 2001.
ASHA, P., 2015. Study of strength characteristics of concrete with E-waste. International Journal of Earth Sciences and Engineering, 8 (1), 445-449.
LAKSHMIA, R. AND NAGAN, S., 2011. Investigations on durability characteristics of E- plastic waste incorporated concrete. Asian Journal of Civil Engineering, 12 (6), 773-787. DHANRAJ, A.A. AND SELVAMONY, C., 2015. An
experimental study on partial replacement of fine aggregate with E-waste material (Fr-4) in M30 grade of concrete. International Journal of Applied Engineering Research, 10 (9), 22835-22842.
SENTHIL KUMAR, K. AND BASKAR, K., 2015. Development of ecofriendly concrete incorporating recycled high-impact polystyrene from hazardous electronic waste. Journal of Hazardous,Toxic and Radioactive Waste, 19 (3), 04014042.
SENTHIL KUMAR, K. AND BASKAR, K., 2015. Recycling of E-plastic waste as a construction material in developing countries. Journal of Material Cycles and Waste Management, 17 (4), 718-724.
A.MUTHADHI , A. MOHAMED BASID , R. MADIVARMA , J.SATHEESH KUMAR , R. RAGHUVARMAN, June-2017. Experimental investigations on concrete with e-plastic waste. International Journal of Scientific & Engineering Research, 8(6),50-54
KHALID IQBAL , TAUSEEF ANSARI , YAKUB ANSARI , ABDULLAH KHAN , AKRAM MANSOORI, Feb 2019. Partial Replacement of E- Waste with Coarse Aggregate in Concrete: An Investigation. IOSR Journal of Engineering, 21-25
J JUNAK , N JUNAKOVA1 AND V CSISZAR, 2019. Electronic waste as a filler in concrete. IOP Conference Series: Materials Science and Engineering. A
TSE 12390, (2019). Testing hardened concrete. TSE, Ankara.
TS EN 206,(2017). Concrete - Specification, performance, production and conformity. TSE, Ankara.