BURSA TECHNICAL UNIVERSITY ❖ GRADUATE SCHOOL OF NATURAL AND APPLIED SCIENCE
M.Sc. THESIS
AUGUST 2019
OPTIMIZATION OF ASA EMULSIFICATION IN INTERNAL SIZING OF PAPER AND PAPERBOARD
Duygu Özlem DOĞAN
AĞUSTOS 2019
BURSA TEKNİK ÜNİVERSİTESİ ❖ FEN BİLİMLERİ ENSTİTÜSÜ
YÜKSEK LİSANS TEZİ Duygu Özlem DOĞAN
(141081302)
Orman Ürünleri Anabilim Dalı
Tez Danışmanı: Prof. Dr. Arif KARADEMİR
KAĞIT VE KARTON ÜRETİMİNDE İÇ TUTKALLAMADA KULLANILAN ASA EMÜLSİYONUNUN OPTİMİZASYONU
Thesis Advisor : Prof. Dr. Arif KARADEMİR Bursa Technical University
Jury Members : ………. ... ………. ……… ... ……… ……… ... ……… ……… ... ……… ……… ... ………
Duygu Özlem DOĞAN, a M.Sc. student of BTU Graduate School of Natural and Applied Science student ID 141081302 succesfully defended the thesis/dissertation entitled “OPTIMIZATION OF ASA EMULSIFICATION IN INTERNAL SIZING OF PAPER AND PAPERBOARD”, which he/she prepared after fullfilling the requirements specified in associated legislations, before the jury whose signatures are below.
Defence of Date : 29 August 2019
Manager of Institute: Doç. Dr. Murat ERTAŞ ... Bursa Teknik Üniversitesi .
.../.../...
PLAGIARISM STATEMENT
I hereby declare that all information and results presented in visual, auditory and written form in this thesis has been obtained and presented in accordance with academic rules and ethical conduct. I also declared that, as required by these rules and conduct, I have fully cited and referenced all materials and results that are not original to this work, and that I accept all kinds of legal conclusions in the case of contrary.
Duygu Özlem DOĞAN
iv FOREWORD
I would like to express my thanks and gratitude; to my General Manager, Birol CARAN and to my Director, Macide KARADEMİR, who have always supported me in completing my master's degree and conducting my thesis studies and to my master and thesis advisor, Prof.Dr. Arif KARADEMİR for directing me to graduate program and supporting me with his wisdom throughout my graduate education and to my family, who has provided me with endless support during my graduate studies as in all other subjects.
v TABLE OF CONTENTS
Page
FOREWORD ... iv
TABLE OF CONTENTS ... v
LIST OF ABBREVIATIONS ... vii
LIST OF SYMBOLS ... viii
LIST OF TABLES ... ix
LIST OF FIGURES ... x
SUMMARY ... xii
ÖZET……. ... xiii
1. INTRODUCTION ... 14
1.1 The Global Markets for Sized Paper and Board Products and Sizing Agents . 14 2. LITERATURE ... 17
2.1 Main Internal Sizing Chemicals ... 17
2.1.1 Rosin ... 17
2.1.2 Alkyl ketene dimer (AKD) ... 17
2.1.3 Alkenylsuccinic anhydride (ASA) ... 18
3. ALKENYL SUCCINIC ANHYDRIDE EMULSIFICATION ... 21
3.1 Emulsification Ingredients ... 22
3.2 Emulsion Stability ... 22
3.3 Monitoring Paper Mill ... 23
3.3.1 Conditions in paper machine ... 23
3.3.2 Wetend chemistry parameters in paper machine ... 23
3.4 Paper Grades to Be Sized ... 23
3.5 Sizing Test Methods ... 24
3.5.1 Penetration tests ... 24
3.5.2 Surface resistance tests ... 24
4. EXPERIMENTAL PART ... 26
4.1 ASA Emulsification Laboratory Trial In Mare GMBH Germany ... 26
4.1.1 Objective ... 26
4.1.2 Materials ... 27
4.1.3 Methods and work done ... 27
4.1.4 Results and discussions ... 28
4.2 ASA Emulsification Laboratory Trial In Bursa Technical University ... 29
4.2.1 Objective ... 29
4.2.2 Materials ... 30
4.2.3 Methods and work done ... 31
4.2.4 Results and discussions ... 31
4.3 Customer-1 ASA Emulsification Mill Trial ... 33
4.3.1 Background ... 33
4.3.2 Materials ... 34
vi 4.3.4 Objective ... 35 4.3.4.1 Trial-1 ... 35 4.3.4.2 Trial-2 ... 37 4.3.4.3 Trial-3 ... 39 4.3.4.4 Trial-4 ... 40
4.4 Customer-2 ASA Emulsification Mill Trial ... 43
4.4.1 General background ... 43 4.4.2 Materials ... 44 4.4.3 Methods ... 44 4.4.4 Objective ... 44 4.4.4.1 Trial-1 ... 45 4.4.4.2 Trial-2 ... 47 4.4.4.3 Trial-3 ... 47 4.4.4.4 Trial-4 ... 49 5. CONCLUSIONS ... 52 REFERENCES ... 54 APPENDICES ... 56 CURRICULUM VITAE ... 60
vii LIST OF ABBREVIATIONS
AKD : Alkyl ketene dimer
ASA : Alkenyl succinic anhydride
AVG : Average
C-PAM : Cationic polyacrylamide DS : Degree of substitution FPR : First Pass Retention GSM : Grams per square meter
GYP : Gypsum board
HST : Hercules sizing test LMW : Low molecular weight LPB : Liquid packaging board -OH : Hydroxyl group
PAC : Polyaluminun chloride
PCC : Precipitated calcium carbonate PID : Proportional–integral–derivative PLC : Programmable logic controller PSA : Polymeric sizing agents WRV : Water retention value
viii LIST OF SYMBOLS
µ : Micro
€ : Euro
ix LIST OF TABLES
Page
Table 3.1 : Some grades that are sized in order to improve performance ... 23
Table 4.1 : Experimental sets of ASA & emulsifiers couples & their mixing ratios. 28 Table 4.2 : Experimental sets of ASA & emulsifiers couples & their ratios and visual check of emulsions. ... 31
Table 4.3 : Technical details of paper machines that trial has been conducted. ... 34
Table 4.4 : Chemicals & dosing points & amounts. ... 34
Table 4.5 : Standard values of 145 g/m2 gypsumboard paper ... 39
Table 4.6 : Technical details of paper machines that trial has been conducted. ... 43
Table 4.7 : Chemicals & dosing points & amounts. ... 43
Table 4.8 : Technical details of paper machines that trial has been conducted. ... 44
Table 4.9 : Chemicals & dosing points & amounts. ... 44
Table 4.10 : Wet-end measurements before starting-up the trial. ... 45
Table 4.11 : Temperature values of drying first battery/8 cylinders of paper machine with regard to time. ... 47
Table 4.12 : Wet-end measurements before starting-up the trial ... 48
x LIST OF FIGURES
Page Figure 1.1 : Global sized / unsized paper and paperboard market, global market shares
for sized grades by sizing agent, and global market shares for sizing agents .... 15
Figure 1.2 : Global average sizing agent dosage ... 16
Figure 2.1 : Rosin sizing mechanism ... 19
Figure 2.2 : AKD reaction mechanisms ... 20
Figure 2.3 : ASA reaction mechanism ... 20
Figure 3.1 : Turbine system industrial ASA emulsification ... 22
Figure 4.1 : Flowchart of all work done in this thesis... 26
Figure 4.2 : Flow chart of laboratory scale trial conducted in Mare ... 26
Figure 4.3 : Particle size graph of ASA emulsions and related experimental sets of ASA & emulsifier couples ... 28
Figure 4.4 : Average water retention value (WRV) of ASA emuılsions and related experimental sets of ASA & emulsifier couples ... 29
Figure 4.5 : Flow chart of laboratory scale trial conducted in Bursa Technical University ... 30
Figure 4.6 : ASAs & emulsifiers ... 30
Figure 4.7 : WRV results of most proper experimental sets of ASA & emulsifier couples ... 33
Figure 4.8 : Water drop test of MareASA & emulsifier couples ... 33
Figure 4.9 : Sequence of objectives of ASA emulsification mill trial conducted in Customer-1 ... 35
Figure 4.10 : First pass retention values (%) of top & bottom formers ... 36
Figure 4.11 : Cationic demand values of top & bottom formers ... 36
Figure 4.12 : Cobb 60 comparison AKD and ASA ... 37
Figure 4.13 : Venturi injector with static mixing elements inside ... 38
Figure 4.14 : Dismountling the injector ... 38
Figure 4.15 : 6 mixing elements under the ring disc ... 38
Figure 4.16 : Injector ... 38
Figure 4.17 : Non-homogenous or yellowish emulsion. Emulsion on the left side is correct. ... 39
Figure 4.18 : ASA&emulsifiers dosage (kg/t) vs. Cobb 60 after reel for top and bottom side of paper (g/m2), air permeability (Gurley) and swim test (min) values ... 40
Figure 4.19 : Comparison of dosages of emulsifiers: Vector vs Caran ... 41
Figure 4.20 : ASA & emulsifiers dosage (kg/t) vs. Cobb 60 values of top & bottom side of paper (g/m2) ... 41
Figure 4.21 : ASA & emulsifiers dosage (kg/t) vs. tensile strength values of length & width of (kN/m) ... 42
Figure 4.22 : ASA&emulsifiers dosage (kg/t) vs. air permeability values (second) 42 Figure 4.23 : Sequence of objectives of ASA emulsification mill trial conducted in Customer-1 ... 44
xi
Figure 4.24 : Cobb 60 values after reel/before oven ... 45 Figure 4.25 : Cobb 60 values after rewinder ... 46 Figure 4.26 : Cobb 60 values after oven ... 46 Figure 4.27 : Cobb 60 values before oven, after oven, after rewinder and after 1 day
with regard to ASA & Vector dosage ... 48 Figure 4.28 : Cobb 60 values of wire and felt side of paper to ASA & Vector dosage
in first day ... 50 Figure 4.29 : Cobb 60 values of wire and felt side of paper to ASA & APC dosage in
xii
OPTIMIZATION OF ASA EMULSIFICATION IN INTERNAL SIZING OF PAPER AND PAPERBOARD
SUMMARY
In paper and paperboardmaking, internal sizing is used for making the end product more resistant to liquid penetration. Rosin, Alkyl Ketene Dimer (AKD) and Alkenyl Succinic Anhydride (ASA) internal sizing agents exist for this purpose. ASA is added to the papermaking process in the form of an emulsion. The dispersion of ASA, water, and an emulsifier are mixed under shear forces to create the capsulation and emulsion. In this master's thesis, various ASA and ASA emulsifiers with various emulsification techniques in both laboratory and industrial process scale were studied. The goal was to find best performing ASA, best coupling ASA emulsifiers, best conditions for emulsification and paper machines and to have proper emulsion with proper ASA:emulsifier ratio, particle size&visual check of emulsion, cobb&porosity values of produced papers.
Together with three various ASAs, the emulsifiers were various cationic starches, polyacrylamides and polyethyleneimines having various charge densities and molecular weights, so that six emulsifiers which gave steric or electrostatic stabilization and capsulation effect on emulsion droplets. Particle size and visual determinations and Cobb 60 tests were carried out and three emulsifiers and one ASA were selected for industrial utilization. ASA dosages of 1-5 kg/ton of paper together with two emulsifiers (C-PAM and cationic liquid starch) performed commonly well in all laboratory and industrial process scale experiment with mixing ratio from 0,5 to 1,8 was utilized to make paper sheets and paper reels. Water absorption tests showed that the best hydrophobation with ASA with C-PAM and ASA with cationic liquid starch. A good ASA emulsion particle size was in between 0,5 µm – 3 µm in diameter values. The most stable emulsions were white and had no phase inversion, only little creaming and foaming during at least 2-hour-study.
After all experimental work done, Cost analysis and savings in industrial trials were taken into consideration for ASA with C-PAM and ASA with starch emulsifiers.
KAĞIT VE KARTON ÜRETİMİNDE İÇ TUTKALLAMADA KULLANILAN ASA EMÜLSİYONUNUN OPTİMİZASYONU
ÖZET
Kağıt ve karton yapımında, nihai ürünün suya daha dayanıklı hale getirilmesi için iç tutkallama kimyasalları kullanılır. Bu amaçla Reçine, Alkil Keten Dimer (AKD) ve Alkenil Süksinik Anhidrit (ASA) iç tutkallama kimyasalı olarak kullanılır. ASA, kağıt üretim işlemine, emülsiyon formunda eklenir. ASA, emülgatör ve su; dispersiyon, kapsülasyon ve emülsiyon oluşturmak için kuvvet altında karıştırılır.
Bu yüksek lisans tezinde, hem laboratuvarda hem de endüstriyel ölçekte, çeşitli emülsifikasyon teknikleri ile çeşitli ASA ve ASA emülgatörleri incelenmiştir. Amaç, en iyi performans gösteren ASA'yı, en iyi ASA ve emülgatör eşleşleşmesini, en iyi emülsiyon oluşturma koşullarını ve kağıt makinelerinin en iyi koşullarını bulmak ve sonuç olarak uygun ASA ile uygun emülsiyonu bulmaktır. Üretilen emülsiyonların karışım oranı, parçacık boyutu ve emülsiyonun görsel kontrolü, Cobb 60& porozite değerleri kontrol edilmiştir.
Üç farklı ASA ile birlikte, çeşitli yük yoğunlukları ve moleküler ağırlıklara sahip çeşitli katyonik nişastalar, poliakrilamidler ve polietileniminler, emülgatör olarak seçilmiştir. Altı adet emülgatör, emülsiyon damlacıkları üzerinde, sterik veya elektrostatik stabilizasyon ve kapsülleme yapmıştır. Partikül büyüklüğü ve görsel tespitler ve Cobb 60 deneyleri yapılmış ve endüstriyel kullanım için üç emülgatör ve bir ASA seçilmiştir. Ton kağıt başına 1-5 kg / ton ASA ile 0,5 ila 1,8 oranında karıştırma oranında kullanılan iki emülgatörle (C-PAM ve katyonik sıvı nişasta) birlikte, tüm laboratuvar ve endüstriyel işlem ölçekli deneylerde ortak olarak kullanılmıştır. Laboratuar ölçeğinde el safihaları ve işletme ölçeğinde bobinler üretilmiştir. Su emme testleri, C-PAM ile ASA ve katyonik sıvı nişasta ile ASA ile en iyi su iticiliğe sahip olduğunu göstermektedir. İyi bir ASA emülsiyonu tanecik ebadı, çap değerleri olarak 0,5 um ila 3 um arasındadır. En kararlı emülsiyonlar beyaz, faz ayrımı olmayan, köpük oluşmayan ve 2 saatten sonra stabil kalan emülsiyonlardı. Tüm deneysel çalışmalar yapıldıktan sonra, C-PAM ile ASA ve nişasta ile ASA emülsiyonları için endüstriyel denemelerde maliyet analizi ve tasarruf dikkate alınmıştır.
14 1. INTRODUCTION
The purpose of internal sizing is to resist the penetration of liquids through or on paper. The subject is complicated, since there are different kinds of chemical treatments to make paper fluid-resistant, there are different kinds of liquids with which the paper may interact, and sizing is affected by different variables in all parts of paper machine [1].
Three major product categories of internal sizing agents are alkenyl succinic anhydride (ASA), alkyl ketene dimes (AKD) and rosin.
Following items are key factors to use these products efficiently [1]:
1. The sizing formulations need to be in a well-dispersed form, before they are added to the system.
2. The sizing formulations need to be well mixed with the fiber furnish so that the material can be uniformly distributed onto the surfaces.
3. The sizing formulations attached to any fines, need to be retained in the paper at the forming section. Retention efficiency is important in those cases.
4. The sizing agent molecules need to be oriented on the fiber surface. In the case of ASA, a curing reaction occurs that anhydride reacts with hydroxyl groups on the fiber surface to form an ester. In the case of AKD, ketene dimer structure appears, but it is not clear how much of it is able to form ester bonds. In the case of rosin acid emulsion products, the aluminum rosinate compounds mainly are formed during the drying of the paper.
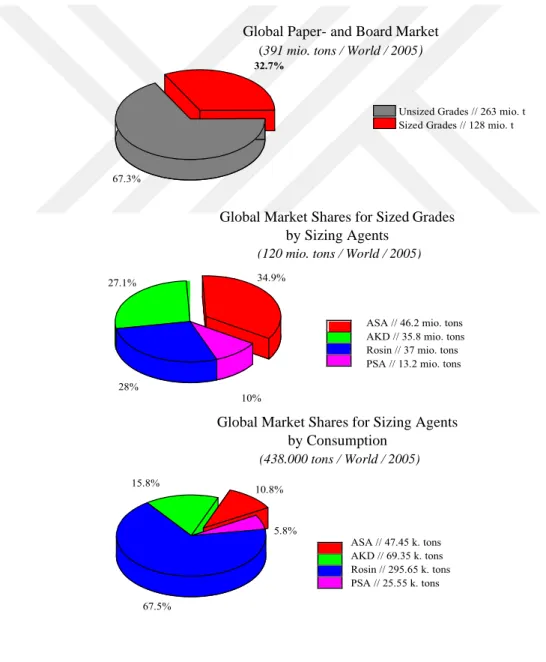
1.1 The Global Markets for Sized Paper and Board Products and Sizing Agents Figure 1.1 [2] shows the numbers of globally produced sized and unsized paper & board grades in 2005. This research stated that 32,7% of grades are sized.
15
Global Paper- and Board Market (391 mio. tons / World / 2005)
Global Market Shares for Sized Grades by Sizing Agents
(120 mio. tons / World / 2005)
Global Market Shares for Sizing Agents by Consumption
(438.000 tons / World / 2005)
The four main sizing agent groups that were taken into consideration are ASA, AKD, rosin sizes and polymeric sizing agents (PSA’s), which are the most common systems today.
As shown in Figure 1.2 [2], 34,9% were sized by ASA, 28% by rosin size, 27,1% by AKD and 10% by PSAs.
The overall sizing agent consumption of 438000 tons contributed 0,11% to the whole produced grades and 0,34% to the sized grades. The total amount of sizing agents was made up of 67,5% rosin sizes, 15,8% AKD, 10,8% ASA and 5,8% PSA’s. The calculated worldwide average dosage values are 0.1% for ASA, 0,19%, for AKD, 0,8% for rosin sizes and 0,19 % for PSA’s.
Figure 1.1 : Global sized / unsized paper and paperboard market, global market shares for sized grades by sizing agent, and global market shares for sizing agents (2005)
16
Figure 1.2 : Global average sizing agent dosage
Sizing Agent 0.0 0.1 0.19 0.19 0.6 0.4 0.2 0.8 AKD Rosin Sizes PSA 0.8 1.0 ASA G lo b al A v er ag e D o sa g e [%]
17 2. LITERATURE
2.1 Main Internal Sizing Chemicals
The main sizing agents used in the paper industry are Rosin, AKD and ASA for internal sizing.
2.1.1 Rosin
The word "rosin" refers to a series of chemicals isolated from the "tall oil" that is produced during kraft pulping of softwood species. One of the major components of softwood rosin is abietic acid, a partially unsaturated compound with three fused six-membered rings and one carboxyl group. It is common to treat the native rosin with fumaric acid, converting at least some of the abietic acid and related compounds to tricarboxylic species called "fortified rosin." Rosin acids are tacky solids at room temperature. The supplier of the rosin accomplishes making emulsion by heating the rosin above its melting point and applying hydrodynamic shear as it is poured into a hot aqueous solution in the presence of a stabilizer [3,4].
It is most common to use rosin emulsions under mildly acidic conditions, e.g. between pH value of about 4,5 and 6. These are conditions that favor very high retention of alum or PAC on the fibers. Usually it is recommended to have the addition points relatively close in time, but with good mixing of the furnish between the two addition points. High first-pass retention is recommended to minimize conversion of the free-acid form of rosin to its dissociated (saponified) state, which is more stable under the conditions of use (pH > 4,5). It is worth noting that the material from rosin emulsion droplets mostly does not interact with alum until the paper is dried. Despite this, it is still important to use an aluminum source (alum or PAC) to help retain the rosin emulsion and so that the rosin molecules anchor and orient themselves on the surface of the fibers when they encounter the high temperatures of the dryers [3,4,9].
2.1.2 Alkyl ketene dimer (AKD)
AKD is synthesized from fatty acids. The most common form is a waxy solid material dispersed as small particles in a solution that contains a stabilizer, which is used for
18
hydrophobization of paper, especially when made under alkaline conditions. The stabilizer may be cationic starch or another cationic polyelectrolyte [3,4].
AKD is widely used for liquid containers, ink-jet printing papers, and many other grades of paper and paperboard. Since AKD is received at the paper mill as a ready-made, milky emulsion, it can be a very convenient product to use. Also, the lower reactivity of AKD, compared to ASA, means that the papermaker has more flexibility on where to add it. For example, many users of AKD add it to the thick stock; this practice tends to get the AKD to the fiber surfaces. In contrast, adding a sizing agent to the diluted furnish in the thin stock loop can be expected to concentrate more of the size onto the fines fraction. The presence of precipitated calcium carbonate (PCC) in the system can reduce the effectiveness of the sizing agent and also it may cause the sizing to lose some of its effect during storage (reverse sizing) [3,4,8].
Paper made with high levels of AKD is likely to be slippery, and it may cause problems in precision cutting and register during conversion, or in stacking during high-speed xerographic copying. These effects can be minimized by limiting the dosage (perhaps supplementing the sizing effect with surface hydrophobes added to the size-press starch) [3,4].
AKD hydrolyzes slowly during storage. Manufacturers instructions should be followed regarding the temperature and time of storage [3,4].
2.1.3 Alkenylsuccinic anhydride (ASA)
The active ingredient of ASA is an oily monomer. The most important components of this monomer are a five-membered anhydride ring and a linear chain having between 14 and 20 -CH2- groups (often 18). The reactive ring can be at various positions relative to the chain, and most commercial ASA consists of a mixture of these isomers. The product is almost always delivered as a light amber oil that must be kept very dry until emulsification. [3,4]
ASA is added to the furnish in the form of an aqueous emulsion, in which the emulsifier is usually cationic starch or another cationic, hydrophilic polyelectrolyte. [3,4]
ASA is a sizing agent designed to increase resistance to water penetration in the case of paper formed under neutral or alkaline conditions. ASA is especially used in cases
19
where full cure is desired before the size press and where it is important to maintain a high frictional coefficient in the paper product. ASA can improve paper machine runnability and preserve paper's dimensional stability by limiting penetration of size-press solution into the sheet. Holding the size-size-press starch out nearer to the paper surface also can make the surface-applied additives more effective for such purposes as promoting surface strength, reducing dusting, reducing picking of vessel segments during offset printing [3,4,8].
The key goals in using ASA are (a) avoid hydrolysis,
(b) distribute it well in the furnish, and (c) retain it efficiently.
Hydrolysis is minimized by preparing the emulsion as late as possible - usually only seconds before the material is added to the thin stock. Microscopic images (or other methods) can show whether one has achieved the desired narrow size distribution of droplets, usually with an average size near or below one micrometer. The recommended point of addition is after the hydrocyclone cleaners. Although the cationic emulsifier covers around each ASA droplet and has some effect in attaching the size to cellulosic materials, a good retention aid system is needed to achieve a relatively high first-pass retention. Otherwise, a lot of the ASA will follow the white water circuit, giving it time to decompose. Deposit problems usually can be minimized by such practices as limiting the dosage, having alum or PAC present in the system, turning off the ASA flow during wet breaks, and maintaining good retention. [3,4]
20
Figure 2.2 : AKD reaction mechanisms [5]
21
3. ALKENYL SUCCINIC ANHYDRIDE EMULSIFICATION
The equipments used for ASA emulsification in paper mills are listed as follows [6]: • Venturi system
• Turbine system • Cavitron system
• Multi-stage centrifugal pump
The high-shear turbine and cavitron are the most used systems. Turbine skid shown in Figure 3.1 is designed to emulsify ASA with a cationic polymer or starch and dose continuously into the paper machine process. Effective over a wide range of pH (6-9), the emulsion imparts flexible sizing, end user satisfaction and cost effectiveness to paper and board.
The unit is composed of:
• Dosing pumps (ASA and polymer) with a flow meter on each • 1 dispersing pump (2900 rpm)
• 1 final solution line with a flow meter and a regulation valve to adjust the emulsion flow
• 1 recirculation loop with a regulation valve to adjust the pressure • 1 water line for the dilution
• 1 water line for the post-dilution (with a flow meter) • 1 soda line for special cleaning
Features & benefits of this unit are as follows: • Compact and easy to install & maintain • Stainless steel pipe & frame
• User friendly with its screen
• Fully automatic operation with PLC controlled • Concentrations, flows and pressure PID controlled • Consistent and repeatable emulsion quality
22 • 1 Manual mode : for special cleaning and tests • Alarms and control parameters in manual/auto • Post dilution equipped
• Flushing sequence with water or soda
Figure 3.1 : Turbine system industrial ASA emulsification 3.1 Emulsification Ingredients
3 parts or more of a mill-cooked cationic starch (0,3% quaternary substituted N2 or higher) is used with regard to 1 part ASA or 0,4 parts of a high cationic charge density, LMW polymer to 1 part of ASA or 0,2 – 0,35 parts emulsifying starch to 1 part ASA. Target median particle size is < 1µm and > 95% < 2µm [5-7].
3.2 Emulsion Stability
These emulsion parameters minimize the production of hydrolyzate [5-7]:
• Cool temperature as low as possible. Often means chilling down the starch prior to emulsification
• Use low hardness water.
• Low pH. The pH of the emulsion is adjusted with alum or acid to around 4.5. Aluminum ions also reduce the tackiness of any hydrolyzate present.
23 3.3 Monitoring Paper Mill
3.3.1 Conditions in paper machine
• Fiber furnish: Certain virgin fiber sources (i.e. hardwood/softwood) or recycled pulps can be easy or hard to size depending on fiber length, contaminates, deinking chemistry. Sizability decreases as percent alpha cellulose increases, or as % hemicellulose decreases.
• First pass and ash retention: It is important to retain fines with high surface area to maintain efficient sizing and machine cleanliness.
• Refining: In general, low / moderate levels of refining improve sizing. Higher levels of refining are detrimental because more surface area is created without substantial increases in sheet density. So more surface area is needed to be hydrophobic – whether its in the form of fines or fibrils.
• Speed: Increased machine speeds put more stress of fine particle retention.
• Sheet temperature profile / Steam demand: Proper sheet temperatures are required to melt and distribute sizing agent.
3.3.2 Wetend chemistry parameters in paper machine
• Temperature: Hot stock temperatures can lead to reduced sizing efficiency and size related deposits (recommended range<60°C).
• Conductivity: This is an indication of carryover from pulp, so-called anionic trash. • pH - Alkaline Size: Reaction rates decrease as pH decreases. For ASA, ph 7,0-8,0
is ideal.
• Cationic/anionic demand: High anionic soluble charge or cationization of fines can reduce size efficiency.
3.4 Paper Grades to Be Sized
As listed in Table 3.1, some typical grades that are sized in order to improve performance in use are:
Table 3.1 : Some grades that are sized in order to improve performance [10-14].
Grade Sizing Test
Fine Papers HST, Pen & Ink, Float, Bristow, Ink Jet, Cobb, Stöckigt Linerboard HST, Cobb, Lactic Acid water drop, Immersion Gypsum Board Boiling Boat, Cobb, Water Drop
Cupstock and Paper Plates HST, Cobb, Edgewick
Cylinderboard Grades Immersion, Cobb, Water Drop, Vanceometer Liquid Packaging (LPB)
Newsprint
Edgewicks Water Drop
24 3.5 Sizing Test Methods
Sizing test methods will be classified in principle as such, and will be analyzed in detail [10-14]:
• measure the penetration of fluids into paper and paperboard,
• measure the resistance of the surface layers of the paperboard to sorption and extrapolate the values obtained to sizing.
3.5.1 Penetration tests
• Boiling Boat - The time is recorded for boiling water to penetrate 75-100% of the surface when a paper "boat" is floated on the boiling water. Common test for Gypsum paperboard.
• Flotation Tests - The paper sample is floated on an aqueous solution. The test is timed until a certain level of penetration has occurred as indicated by a color change.
• Hercules Sizing Test (HST) - Ink is placed on a sample of paper, and a photoelectric cell registers the drop in reflectance of the opposite side of the sheet as the ink penetrates. The test ends at a selected reflectance level (i.e., 80%). • Stöckigt - The bath is a 2% ammonium thiocyanate solution. Drops of a 1% ferric
chloride solution placed on top of the paper surface forms a red color when it comes in contact with the penetrating bath solution. This is a common test in Asia. • Edgewick - A plastic laminated paper sample is immersed in an aqueous sample
of lactic acid, peroxide, coffee, etc. The test is a measure of the amount of liquid pickup. A modification measures the length of penetration through the edge by a dyed solution. Common test for LPB and cupstock.
• Immersion Test - A paperboard sample is completely immersed in water. The amount of water picked up in a set length of time is the test value.
• Currier - Distilled water penetrates the paper sample until it completes an electrical circuit between a moist felt and metal plate as measured by a milliammeter. 3.5.2 Surface resistance tests
The tests generally determine sizing degree by the surface properties of the paper and paperboard. Instead of measuring the amount of or the length of time for liquid to pass through the sheet of paper, these tests focus primarily on the sheet surface. These tests
25
generally have a higher utility for grades used in printing or gluing since these operations are primarily controlled by the level of sizing or aqueous resistance at the surface [10-14].
• Cobb- This test applies the liquid (typically 100 ml of water) to the surface of the sheet, within a confined area (usually 100 cm²), for a specified time interval and determines the amount by weight of liquid absorbed. Time intervals are typically 1, 2, 5, 10, 20, or 30 minutes depending on the end use requirements. In this thesis, Cobb 1 min=60 second; so-called, Cobb 60 is used.
• Ink Jet Printability - Determines the suitability of paper for ink jet printing by printing a standard pattern on the paper samples and measuring the print density and feathering characteristics by instrument or visually.
• Water Drop - A water (or other liquid) drop is applied to the surface of the paper sample from a fixed height and drop size. The test measures the time for 1 or more drops to completely soak in.
• Bristow Wheel - Determines the surface absorptivity by measuring the trace length of a set quantity of ink.
• K&N Ink - Ink is smeared on the sample. Then the ink is wiped off after a specified time and the operator measures the reflectance of the stained area. • Vanceometer Test - Originally developed to measure the sorption of oils used in
printing inks, this test measures the area of a spot formed by a specified quantity of fluid when the wheel is released.
26 4. EXPERIMENTAL PART
In Figure in 4.1, sequence of all experiment sets of ASA emulsification is shown with flow chart.
Figure 4.1 : Flowchart of all work done in this thesis All laboratory and industrial scale exprimental works above were done • to find best performing ASA,
• to find best coupling ASA emulsifiers,
• to have proper emulsion with proper ASA:emulsifier ratio / particle size&visual check of emulsion / cobb&porosity values of produced papers,
• to find best conditions for emulsification and paper machines.
4.1 ASA Emulsification Laboratory Trial In Mare GMBH Germany 4.1.1 Objective
Sequence of objectives to conduct laboratory trial in Mare GMBH, Germany is shown in Figure 4.1 below.
Figure 4.2 : Flow chart of laboratory scale trial conducted in Mare
Laboratory trial in Mare GMBH, Germany Laboratory trial in BTU Customer-1 mill trial Customer-2 mill trial
27 4.1.2 Materials
ASA was as follows.
• MareASA 12 EX (shown in Appendix A) ASA emulsifiers were as follows.
• Vector SC 20157 (Shown in Appendix B) • SNF APC 815 NM (Shown in Appendix C) • Polymin VZ (Shown in Appendix D) • Polymin VT (Shown in Appendix D)
• Caran Kimya Starch-1 (%20 cooked maize) (Shown in Appendix E) • Caran Kimya Starch-1 (%30 cooked maize) (Shown in Appendix E)
4.1.3 Methods and work done Pulp preparation [15-18]
• 2000 ml water was taken into disintegrator. • Dry pulp was weighed.
• Consistency was adjusted to %2-2,5. • Disintegrator was started.
• Consistency and dry content were measured by 100 gr of pulp solution. Emulsion preparation
• In each experimental set, ASA concentration of emulsions was in between %5-7,5. • ASA: ASA emulsifier ratio was 1:1/1:0,75/1:0,5.
• In each experimental set, approximately 200 ml of asa emulsion was prepared. Example: 185 ml water, 7,5 ml ASA, 7,5 ml ASA emulsifier.
• ASA emulsion was mixed with high speed&shear. With the help of this, ASA emulsifier capsulated ASA molecules.
• For this reason, kitchen blender was used to mix the components in the item 2 for 2 minutes.
28
Emulsion quality&performance analysis [10, 15-18]
• Emulsion quality was checked visually, which should be milky white, not yellowish, and no phase separation.
• Particle size was checked by Horiba particle size analyzer.
• In order to check performance of emulsion, 100 ml of pulp solution was taken. • 4 kg ASA emulsion/ton paper was added.
• Handsheet was prepared by Rapid-Kothen sheet former. • Cobb 60 test was made.
• Retained water amount was determined.
Table 4.1 : Experimental sets of ASA & emulsifiers couples & their mixing ratios.
Set-1 Set-2 Set-3 Set-4 Set-5 Set-6
MareASA (gr) 7,5 7,5 7,5 7,5 7,5 7,5 Vector (gr) 7,5 APC (gr) 7,5 CK Starch-1 7,5 Polymin VT (gr) 7,5 Polymin VZ (gr) 7,5 CK Starch-2 (gr) 7,5 Water 185 185 185 185 185 185 Concentration (%) 7,5 7,5 7,5 7,5 7,5 7,5
Visual check white yellow white White White White
4.1.4 Results and discussions
Figure 4.3 : Particle size graph of ASA emulsions and related experimental sets of ASA & emulsifier couples
0,909 2,635 0,631 0,610 0,614 0,661 1,703 0,910 1,060 1,070 0,945 0,000 0,500 1,000 1,500 2,000 2,500 3,000
Set no.1 Set no.2 Set no.3 Set no.4 Set no.5 Set no.6
P ar ticle size of ea ch A SA em uls io n (µm )
Number of experiment sets
29
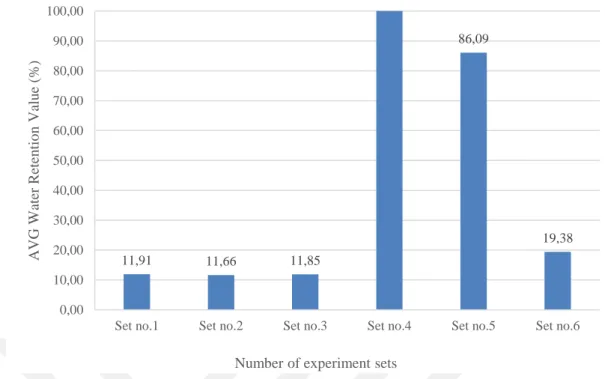
Figure 4.4 : Average water retention value (WRV) of ASA emuılsions and related experimental sets of ASA & emulsifier couples
• Although particle size of Set-2 was not in between 1-2 µm, with regard to water retention value comparison tests, Set-2 was worthwhile to try in paper mill. • Although particle size of Set-4&5 was in between 1-2 µm, with regard to Cobb 60
comparison tests, Set-4&5 gave high degree of water retention value and no sizing, which leaded to be eliminated. Note that Blank papersheet got %110 water retention value.
• According to the experimental sets as shown and performed best in Figure 4.3 and Figure 4.4, from emulsion and paper properties point of view; Set 1 (with APC), Set 2 (with CK Starch-1), set 3 (with Polymin VZ) and Set-6 (with Vector) were worthwhile to be used together with MareASA in a trial in paper mill.
• Due to easy availability and relatively low price levels, in next section, MareASA together with APC and Vector were worked and besides, Alternative ASAs were found.
4.2 ASA Emulsification Laboratory Trial In Bursa Technical University 4.2.1 Objective
Sequence of objectives to conduct laboratory trial in BTU is shown in Figure 4.5 below. 11,91 11,66 11,85 86,09 19,38 0,00 10,00 20,00 30,00 40,00 50,00 60,00 70,00 80,00 90,00 100,00
Set no.1 Set no.2 Set no.3 Set no.4 Set no.5 Set no.6
A VG W ater R eten ti o n Valu e (% )
30
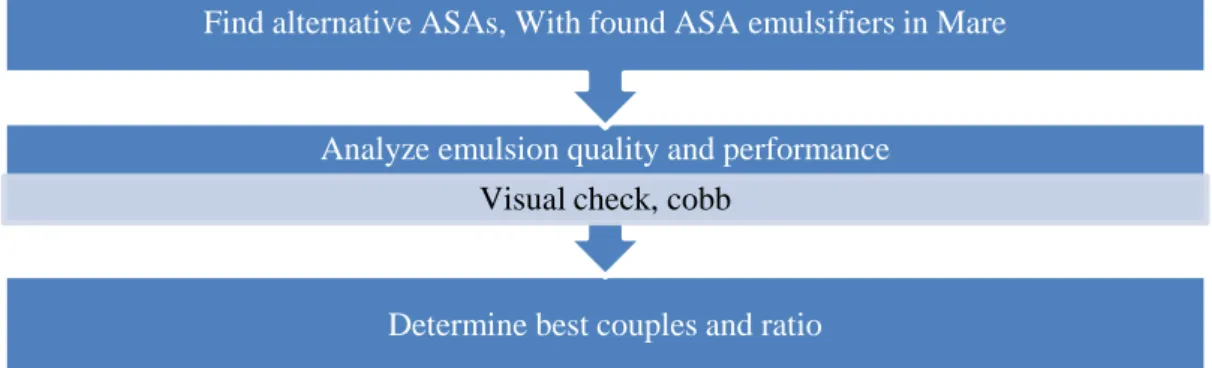
Figure 4.5 : Flow chart of laboratory scale trial conducted in Bursa Technical University
4.2.2 Materials
ASA ve emulsifiers are shown in Figure 4.6. From left to right;
ASA: • Cargill ASA 57 • Cargill ASA 1210 • MareASA 12 EX ASA Emulsifier: • Vector SC 20157 • SNF APC 815
• SNF RSL 4400 (not existing in the picture below) (Shown in Appendix F)
Figure 4.6 : ASAs & emulsifiers Determine best couples and ratio Analyze emulsion quality and performance
Visual check, cobb
31 4.2.3 Methods and work done
Pulp preparation and Emulsion preparation were explained in Chapter 4.1.3. Emulsion quality&performance analysis: [10, 15-18]
• Emulsion quality was checked visually, which should be milky white, not yellowish, and no phase separation.
• In order to check performance of emulsion, 100 ml of pulp solution was taken. • 4 kg ASA emulsion/ton paper was added.
• Handsheet was prepared by Rapid-Kothen sheet former. • Cobb 60 test was made.
• Retained water amount was determined. 4.2.4 Results and discussions
Table 4.2 : Experimental sets of ASA&emulsifiers couples & their ratios and visual check of emulsions. No. of Sets 1 2 3 4 5 6 7 8 9 10 11 12 13 14 15 57 1 1 1 1 1 1 1210 1 1 1 1 1 1 Mare 1 1 1 Vector 1 1 1 0,5 1,5 APC 1 1 1 0,75 0,5 0,75 0,5 RSL 1 1 1 Visual check ++ + ++ - - ++ - - - - ++ ++ - ++ ++
Visual check: emulsion is milky white, not yellowish and has no phase separation, no agglomeration.
As shown in Table 4.2;
• Set 1-2-3: All ASAs (Mare, 1210, 57) were emulsified with Vector and visual check is proper.
• Set 4-5-6: All ASAs (Mare, 1210, 57) were emulsified with APC. Only in Set 6 (Mare&APC), the emulsion was stable, had little foaming, no phase separation, with a close color to milky white. In Set 4, 1210 had little phase separation (i.e, not enough vector and capsulation), In Set 5, 57 had little agglomeration (i.e, more than enough vector).
32
• Set 7-8: With result of Set 5, mixing ratio of APC with 1210 was decreased, phase separation was still same. In conclusion, 1210 and APC were not a good couple. So this couple was eliminated.
• Set 9-10: With result of Set 4, mixing ratio of APC with 57 was decreased, phase separation was still same. In conclusion, 57 products and APC were not a good couple. So this couple was eliminated.
• Set 11: With the result of Set 1, mixing ratio of Vector with 57 was decreased to overcome agglomeration. This couple gave proper result from visual check. • Set 12: With the result of Set 2, mixing ratio of Vector with 1210 was increased to
overcome phase separation. This couple gave proper result from visual check. • Set 13-14-15: All ASAs (Mare, 1210, 57) were emulsified with RSL and only
visual check of 57&RSL was not proper, since emulsion got totally yellowish. • So in conclusion, among 15 sets, we got 7 proper emulsions which are worthwhile
to study WRV tests.
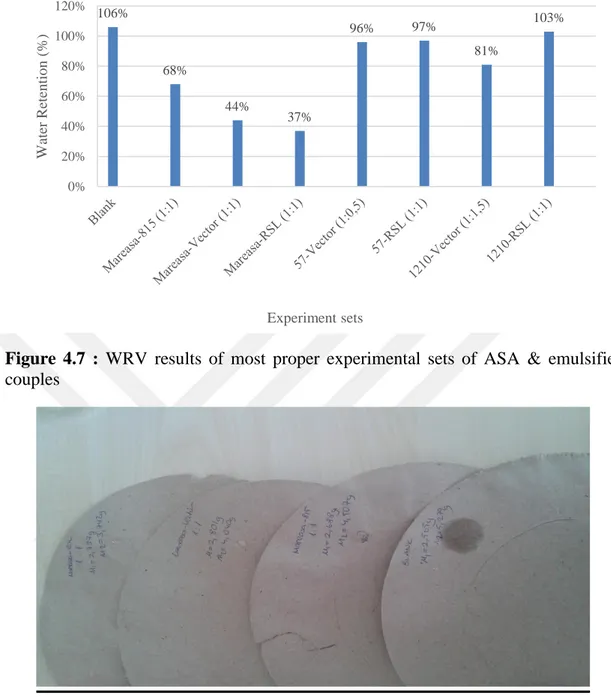
As shown in Table 4.3 and Figure 4.7,
• Mare:RSL 1:1, Mare:Vector 1:1, Mare:APC 1:1 were best in water retention values in this sequence.
• 1210:Vector 1:1,5, 1210:RSL 1:1, 57:Vector 1:0,5 were all close to each other and not working, and same as handsheets without chemical.
As shown in Figure 4.8, best couples with regard to water drop test were also analyzed. For 45 minutes, water drops were put on handsheets cured for one day without oven. MareASA couples didnt absorb the water drop in this duration as seen below.
• During laboratory studies, MareASA&Vector couple with ratio of 1:1 and 4 kg ASA emulsion/ton paper were taken as reference.
• ASAs that should be eliminated were determined as 57, 1210.
• With proper ASA which was Mare, coupling emulsifiers were found as Vector, APC and RSL.
• According to emulsion qualities&WRV and water drop test values, Mare and all emulsifiers ratio was determined as 1:1.
33
Figure 4.7 : WRV results of most proper experimental sets of ASA & emulsifier couples
Figure 4.8 : Water drop test of MareASA & emulsifier couples 4.3 Customer-1 ASA Emulsification Mill Trial
4.3.1 Background
Location-1:
• Customer-1 started its activities by producing corrugated paperboard with a PMI paper machine with a capacity of 40,000 ton per annum.
• With the inclusion of PM II paper machine, grey board&gypsum board production was also started in both machines. Together with the modernization investment on
106% 68% 44% 37% 96% 97% 81% 103% 0% 20% 40% 60% 80% 100% 120% W ater R eten tio n ( %) Experiment sets
34
PM I paper machine increased both quality and the total capacity to 150,000 tons per annum as shown in Table 4.4.
• Customer-1 has been the first corrugating paper producers in Turkey who is using AKD for internal sizing. Since they got good results, today all corrugating paper producers are using the same sizing technology.
• Customer-1 is the first customer in Turkey in testing and using ASA sizing. None of writing&printing (W&P) or board producers use ASA sizing technology. • Improving knowledge and confidence in ASA, Customer-1 experience can be used
to leverage these technology all over Turkey and surrounding countries.
• ASA is used only on specialty paper, which is Gypsum board. All other grades are treated with AKD. All other chemicals being used are listed in Table 4.5.
Table 4.3 : Technical details of paper machines that trial has been conducted. Paper Machine no.1 (PM-1)
Machine brand Width Max speed Grammage Machine brand Width Max speed Grammage Overmeccanica 3.8 mt 600 m/min 80 – 200 gr/m2
Paper Machine no.2 (PM-2) PMT
2.3 mt 400 m/min 100 – 400 gr/m2
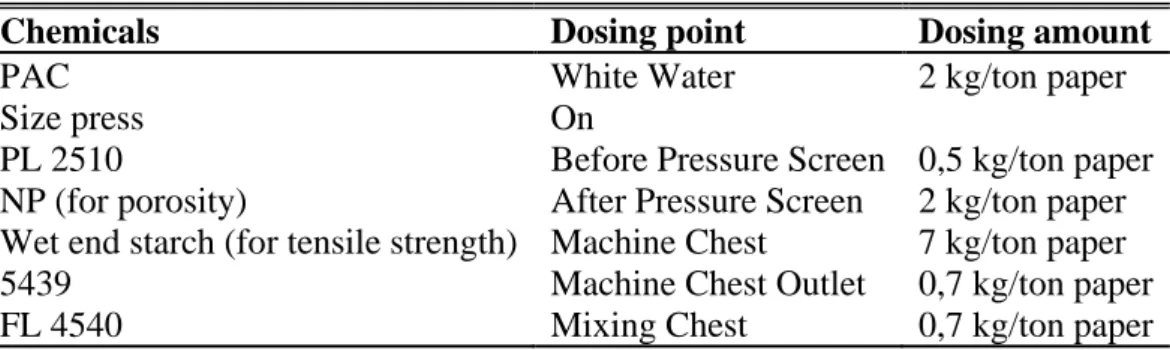
Table 4.4 : Chemicals & dosing points & amounts.
Chemicals Dosing point Dosing amount
PAC Size press PL 2510
NP (for porosity)
Wet end starch (for tensile strength) 5439
FL 4540
White Water On
Before Pressure Screen After Pressure Screen Machine Chest Machine Chest Outlet Mixing Chest 2 kg/ton paper 0,5 kg/ton paper 2 kg/ton paper 7 kg/ton paper 0,7 kg/ton paper 0,7 kg/ton paper 4.3.2 Materials
Materials were MareASA 12 EX, Vector SC 20157 and Caran Kimya Starch-1 (20%).
35 4.3.3 Methods
ASA emulsification and unit in industrial scale were explained in chapter 2.1.3 and 3.1.
4.3.4 Objective
Figure 4.9 : Sequence of objectives of ASA emulsification mill trial conducted in Customer-1
4.3.4.1 Trial-1
Work done:
• Customer-1 made 375 GSM grey board production in PM2. • Normally they were using 7 kg AKD/ton paper.
• After all parameters were proper, as it is seen in Figure 4.10 and 4.11, ASA was started at around 4,7 kg/ton paper with a ratio of 1:1,6 ASA:Vector.
Determine influence of ASA&Vector ratio on Cobb 60values
Trial-4
Determine and compare ASA&CK and ASA&Vector ratio Check paper quality parameters
Try CK Starch-1 instead of Vector during gypsumboard production
Trial-3
Determine needs for better feeding and correct emulsion preparation Check emulsion qualities
Trial-2
Check cobb
Change sizing chemical from AKD to ASA&Vector during greyboard production
36
Results and discussions:
To use ASA, relevant parameters like first pass retention (around 80% in the top and bottom layer) with around and cationic demand (around - 200yeq/l ) were required and as shown in Figure 4.10 and 4.11, FPR and cationic demand values were acceptable.
Figure 4.10 : First pass retention values (%) of top & bottom formers
Figure 4.11 : Cationic demand values of top & bottom formers
1 2 3 4 5 6 7 8 9 10 11 12 13 FPR B 77,00 80,33 87,69 83,17 80,46 82,19 82,15 79,40 FPR T 76,25 78,57 79,64 79,34 77,94 78,10 76,76 77,41 70,00 72,00 74,00 76,00 78,00 80,00 82,00 84,00 86,00 88,00 90,00 F P R o f to p & b o tt o m fo rme r (%) No of experiments 1 2 3 4 5 6 7 8 9 10 11 HB Cationic demand (meq) B 200 200 200 200 160 HB Cationic demand (meq) T 180 160 100 120 140 160 180 200 220 C at io n ic D eman d ( me q ) No of experiments
37
• Since Cobb 60 was between 20-30 and swim test > 60 minutes, then gradually addition of ASA was reduced to till 3 kg/ton.
• Adding 7 kg AKD/ton paper, there was hardly no sizing effect, whereas at dosage of 3kg ASA/ton paper, Cobb 60 value was decreased from around 500gr/m2 to around 100gr/m2 after reel no.18 as shown in Figure 4.12.
• Nevertheless chemical cost with ASA was considerable higher.
Figure 4.12 : Cobb 60 comparison AKD and ASA 4.3.4.2 Trial-2
Work done:
The equipment and ASA emulsion quality are checked as follows:
• Customer-1 was asked to clean the device “Venturi” where ASA was pumped into the emulsifier-water line and where emulsification and capsulation occured with the help of special mixing particles as shown below.
• In the unit, hard deposits were found. They could only be removed mechanically. 0 50 100 150 200 250 300 350 400 450 500 550 0 1 2 3 4 5 6 7 8 9 10 11 12 13 14 15 16 17 18 19 20 21 22 23 24 25 26 27 28 29 30 31 32 33 34 35 36 37 38 39 40 41 42 43 44 COB B 60 (g/m 2 ) No of reels Cobb after reel T Cobb after reelB Doğrusal (Cobb after reel T) Doğrusal (Cobb after reelB)
38
Figure 4.13 : Venturi injector with static mixing elements inside
Figure 4.14 : Dismountling the injector
Figure 4.15 : 6 mixing elements under the ring disc
39
Results and discussions:
Figure 4.17 : Non-homogenous or yellowish emulsion. Emulsion on the left side is correct.
It could be detected that the static mixer elements produce a slightly better ASA emulsion in comparison to the unit without elements in the injector and when it was clean.
4.3.4.3 Trial-3
Work done:
• Customer-1 made 145 GSM gypsum board production in PM1.
• ASA was started at around 4,7 kg/ton paper with a ratio of 1:1,6 ASA:Vector.
Table 4.5 : Standard values of 145 g/m2 gypsumboard paper. [19-23] Standard values for GYP 145
Cobb 60 without oven Swim test at 90 C Length Tensile Width Tensile Tensile ratio
AVG Air Permeability / Porosity (Gurley)
Bottom: 23-29 Top: 19-24 35-60 min 5800 kN/m 2400 kN/m 2,3 40-50 sn
Results and discussions:
With regard to reference values given above in Table 4.18, Cobb 60 (g/m2), swim test (min), strength (kN/m), porosity (second) values were all realiable with reference values given in Figure 4.18.
40
Figure 4.18 : ASA & emulsifiers dosage (kg/t) vs. Cobb 60 after reel for top and bottom side of paper (g/m2), air permeability (Gurley) and swim test (min) values 4.3.4.4 Trial-4
Work done:
• Customer-1 made 145 GSM gypsum board production in PM1.
• ASA was started at around 2,9 kg/ton paper with a ratio of 1:1,6 ASA:Vector.
Results and discussions:
Shown in Figure 4.19,
• First 10 reels were produced with Vector to have reference value.
• Then paper broke, that was why there was no dosage of either ASA or emulsifier. • And after reel-25, Caran emulsifier was started.
• As it is seen below, Caran consumption was higher than Vector.
As shown in Figure 4.20 and with regard to reference values in Table 4.18,
• In average, 3,3 kg ASA/ton paper and 5,4 kg Vector/ton paper, Cobb 60 values were proper and in between 20-30 as required, where as 4,5 kg ASA/ton paper and 6,5 kg Caran/ton paper gave the similar average.
As shown in Figure 4.21 and with regard to reference values in Table 4.18,
0,0 20,0 40,0 60,0 80,0 100,0 120,0 140,0 160,0 180,0 200,0 0 2 4 6 8 10 12 14 16 A S A & S ta rc h v s L ab T est r esu lt s No of reels ASA dosage (kg/t) Starch dosage (kg/t) Cobb after reel T Cobb after reel B Air permeability/ Porosity (Gurley) Swim test
41
• In average, 3,3 kg ASA/ton paper and 5,4 kg Vector/ton paper, tensile length and width values were respectively; 4800 kN/m, 2200 kN/m, where as 4,5 kg ASA/ton paper and 6,5 kg Caran/ton paper gave tensile length and width values respectively as 5350 kN/m and 2500 kN/m, which meant Caran performed better than Vector in strength point of view.
As shown in Figure 4.22 and with regard to reference values in Table 4.18,
• In average, 3,3 kg ASA/ton paper and 5,4 kg Vector/ton paper, air permeability value was 28 seconds, where as 4,5 kg ASA/ton paper and 6,5 kg Caran/ton paper gave 33 seconds, which meant Caran performed similar to Vector in air permeability point of view.
Figure 4.19 : Comparison of dosages of emulsifiers: Vector vs Caran
Figure 4.20 : ASA & emulsifiers dosage (kg/t) vs. Cobb 60 values of top & bottom side of paper (g/m2) 0 2 4 6 8 10 12 14 1 3 5 7 9 11 13 15 17 19 21 23 25 27 29 31 33 35 37 39 41 43 45 Dos ag es ( kg /t on pa pe r) No of reels PM1 ASA dosage (kg/t) PM1 Starch dosage (kg/t) 3 5 6 8 10 11 13 14 17 18 19 21 22 24 25 26 28 29 30 31 32 34 35 ASA dosage (kg/t) 3,36 3,27 2,55 2,66 2,28 4,29 4,14 4,14 4,14 3,86 3,86 4,01 4,06 3,96 Starch dosage (kg/t) 5,45 5,31 4,22 4,41 3,77 7,03 6,77 6,77 6,77 6,32 6,32 6,57 6,65 6,49 Cobb after reel B 28 30 64 43 65 161 195 189 181 189 181 200 194 189 207 31 29 27 33 32 33 27 26 Cobb after reel T 20 24 51 71 75 157 174 193 174 186 180 183 187 184 205 27 23 25 26 27 32 28 44 0,00 50,00 100,00 150,00 200,00 250,00 C OB B 60( G/M 2) NO OF REEL
42
Figure 4.21 : ASA & emulsifiers dosage (kg/t) vs. tensile strength values of length & width of (kN/m)
Figure 4.22 : ASA & emulsifiers dosage (kg/t) vs. air permeability values (second) 3 5 6 8 10 11 13 14 15 17 18 19 21 22 24 25 26 28 29 30 31 32 34 35 37 38 PM1 ASA dosage (kg/t) 3,363,272,552,662,28 4,294,144,144,143,863,864,014,063,964,334,33 PM1 Starch dosage (kg/t) 5,455,314,224,413,77 7,036,776,776,776,326,326,576,656,4910,812,2 PM1 Tensile length 4844450346714690522844915266550060755305589061475734587353875282545552194934514351405334524962696148 PM1 Tensile width 2044215821292427226422612818321529102254250226482408261925002641287926212329225925052394250226932624 0,00 1000,00 2000,00 3000,00 4000,00 5000,00 6000,00 7000,00 T en si le S tr en g th ( K N/m ) No of reels PM1 ASA dosage (kg/t) PM1 Starch dosage (kg/t)
PM1 Tensile length PM1 Tensile width
3 5 6 8 10 11 13 14 15 17 18 19 21 22 24 25 26 28 29 30 31 32 34 35 37 38 ASA dosage (kg/t) 3,3 3,2 2,5 2,6 2,2 4,2 4,1 4,1 4,1 3,8 3,8 4,0 4,0 3,9 4,3 4,3 Starch dosage (kg/t) 5,4 5,3 4,2 4,4 3,7 7,0 6,7 6,7 6,7 6,3 6,3 6,5 6,6 6,4 10, 12, Air permeability/ Porosity (Gurley) 27, 28, 28, 28, 24, 26, 36, 40, 36, 36, 36, 37, 32, 35, 41, 40, 34, 34, 31, 32, 28, 29, 34, 0,00 5,00 10,00 15,00 20,00 25,00 30,00 35,00 40,00 45,00 A ir p er me ab il it y ( se c) No of reels
43
Work done:
• Customer-1 made 145 GSM gypsum board production in PM1.
• In order to optimize the dosages, influence of decreasing the mixing ratio of ASA to emulsifier was also shown to Customer-1.
• Standard ratio was set at 1 part ASA :1,6 parts Vector (20%).
Results and discussions:
Regarding emulsifier usage, it was demonstrated that ratio 1:0,5 is sufficient for required Cobb 60 values and for optimal ASA emulsion which means there was possibility to make savings in ASA sizing and more than 75% of the emulsifier addition could be reduced.
4.4 Customer-2 ASA Emulsification Mill Trial 4.4.1 General background
The annual production, paper processing capacity of Customer-2 which produce from 25 grams to 500 grams is as follows:
Location-1:
Over 100.000 tons/year paper processing capacity. (photocopy paper, notebook, continuous forms and similar products.)
Table 4.6 : Technical details of paper machines that trial has been conducted.
Paper Machine no.1 (PM-1) Paper Type
Width Max speed Grammage
Testliner, Fluting, Kraftliner, Coated boards 4.3 m
440 m/min 80 – 200 gr/m2
Table 4.7 : Chemicals & dosing points & amounts.
Chemicals Dosing point Dosing amount
PAC PAC Wet end starch CPAM AKD White Water Polydisc Machine Chest Before Screen Before Fan Pump
1,7 kg/t 1 kg/t 7 kg/t
8 kg/t
Location-2:
44
Table 4.8 : Technical details of paper machines that trial has been conducted.
Paper Machine no.2 (PM-2) Paper Type
Width Max speed Grammage
Photocopy paper, notebook, continuous forms 2.45 m
410 m/min 25 – 100 gr/m2
Table 4.9 : Chemicals & dosing points & amounts.
Chemicals Dosing point Dosing amount
Filler Wet end starch CPAM AKD
Inlet of Machine chest Machine Chest Before Screen Before Fan Pump
7 kg/t
8 kg/t
4.4.2 Materials
Materials were MareASA 12 EX, Vector SC 20157 and SNF APC 815. 4.4.3 Methods
ASA emulsification and unit in industrial scale were explained in chapter 3.1. 4.4.4 Objective
Figure 4.23 : Sequence of objectives of ASA emulsification mill trial conducted in Customer-1
Determine and compare ASA&emulsifiers ratio
Change AKD to ASA&APC during writing&printing production Location-2
Check cobb
Trial-4
Try Vector instead of APC
Determine ASA&Vector ratio Check Cobb 60
Trial-3
Increase tempertaure of drying section
Check cobb
Trial-2
Change sizing chemical from AKD to ASA&APC during testliner production in Location-1
Determine ASA&APC ratio Check cobb
45 4.4.4.1 Trial-1
Work done:
• Customer-2 made 80 GSM Fluting production in PM1 in Location-1. • Wet-end measurements were proper and normal to start-up the trial.
Table 4.10 : Wet-end measurements before starting-up the trial. Cationic demand of headbox
First pass retention pH of White Water
Conductivity of White Water
-120 meq/L 77%
7,4-7,6
2600-3000 µS/cm
• Reference Cobb 60 with AKD is 40-50 when papersheet was oven cured.
• Trial started with 2,2 kg ASA/ton paper and ASA dosage was increased till 3,8 kg/ton paper, since Cobbvalues were not reached as it should be in between 20-40. • With ASA dosage from 2 to 3,8 kg/ton paper, ASA:APC ratio was shifted from 1
to 1,3.
• Emulsion looked homogeneously white without spots after 2 hours, showed some oily spots after 4 hours.
Results and discussions:
Figure 4.24 : Cobb 60 values after reel/before oven
40 60 80 100 120 140 160 180 00:00 04:48 09:36 14:24 19:12 CO B B 6 0 (g /m 2 ) Time
cobb after reel-1 cobb after reel-2 cobb after reel-1 cobb after reel-2
Doğrusal (cobb after reel-1) Doğrusal (cobb after reel-2)
46
Figure 4.25 : Cobb 60 values after rewinder
Figure 4.26 : Cobb 60 values after oven • As shown in Figure 4.25, Cobb 60 after reel was ~130-150.
• As shown in Figure 4.27, Cobb 60 after rewinder was ~100 and had little improvement, but very far from required Cobb 60 values.
• Average value of natural Cobb 60 after 4 hours was 120 and average value of natural Cobb 60 after 1 day was 100.
• Since Cobb 60 values were not reached after machine or rewinder or by its nature, all paper sheets were put into oven in order to see if Cobb 60 values were reached after curing and excess temperature by the time, which meant that ASA is in the paper and anchored to fiber but it was not activated due to lack of temperature.
90 95 100 105 110 115 120 00:00 04:48 09:36 14:24 19:12 C OBB 6 0 (g /m 2 ) Time
cobb after rewinder-1 cobb after rewinder-2
Doğrusal (cobb after rewinder-1) Doğrusal (cobb after rewinder-2)
25 30 35 40 45 50 00:00 02:24 04:48 07:12 09:36 12:00 14:24 16:48 19:12 C OBB 6 0 (g /m 2 ) Time
cobb after oven-1 cobb after oven-2
Doğrusal (cobb after oven-1) Doğrusal (cobb after oven-2)
47
• Average value of Cobb 60 after oven curing was 34, which meant temperature was not enough for curing.
4.4.4.2 Trial-2
Work done:
• Customer-2 made 80 GSM Fluting production in PM1 in Location-1.
• Since required Cobb 60 values were not reached, Customer-2 was asked to increase temperature of drying cylinders as shown in Table 4.12, in order to see if there would be improvement in Cobb 60 values, although it would lead to more energy consumption and not wanted.
Table 4.11 : Temperature values of drying first battery/8 cylinders of paper machine with regard to time.
1 2 3 4 5 6 7 8
13 :00 79 C 87 C 82 C 92 C 94 C 91 C 91 C 93 C
14 :00 85 C 96 C 86 C 97 C 95 C 100 C 94 C 96 C
Results and discussions:
• Natural cured Cobb 60+1 day was not fully improved. Only some reels showed better naturel Cobb 60 values after 1 day such as; reel 655: Cobb 60~50, reel 657 Cobb: 80. All others from reel number 653 to 658 are above 120.
• With ASA dosage between 2 and 3,8 kg/t, and ASA:APC ratio from 1 to 1,3, oven cured sizing was obtained, however, off machine sizing was not achieved. There was no significant difference and improvement with regard to AKD.
• Sleeping sizing effect was suspected. 4.4.4.3 Trial-3
Work done:
• Customer-2 made 80 GSM Fluting production in PM1 in Location-1.
• Tools for this step were to play with energy for ASA reaction with cellulose by changing emulsifier from APC to Vector, since Vector might need less energy to break the emulsion than APC did.
• Customer-2 was asked to increase temperature of drying cylinders as shown in Table 4.12, in order to see if there would be clear improvement in Cobb 60 values.
48
• Wet-end measurements were proper and normal to start-up the trial.
Table 4.12 : Wet-end measurements before starting-up the trial Machine chest Headbox White water
Ph 7 7,2
Conductivity (µS/cm) 2250 2350
Cationic demand (meqL) -240 -220 -200
• With ASA dosage from 2,2 to 4,5 kg/ton paper, where as Vector dosage was changing from 3,3 to 5,6 kg/ton paper, respectively.
Results and discussions:
Figure 4.27 : Cobb 60 values before oven, after oven, after rewinder and after 1 day with regard to ASA & Vector dosage
4,5 4,5 4,0 3,3 2,2 1,1 5,6 5,6 5,0 4,5 3,3 1,7 118 105 105 115 115 135 40 35 33 31 35 81 99 104 41 83 87 0,0 5,0 10,0 15,0 20,0 25,0 30,0 35,0 40,0 45,0 50,0 55,0 60,0 65,0 70,0 75,0 80,0 85,0 90,0 95,0 100,0 105,0 110,0 115,0 120,0 125,0 130,0 135,0 140,0 145,0 0 1 2 3 4 5 6 7 C OBB 6 0 g /m 2 Reel No ASA dosage (kg/h) Emulsifier dosage (kg/t) reel-1 oven-1 rewinder-1
49 • Reference Cobb 60 was 40-50.
As shown in Figure 4.28,
• Cobb 60 values after oven was relevant with reference values, which meant ASA was in the paper and Cobb 60 values were improving with increased dosage, then a plateau.
• Off machine, Cobb 60 values without oven were always bad.
• Only reel-3 at 13:25 showed sizing after rewinder sizing, which was not reproducible value.
• The key was in the drying profile, they should increase temperature at least on the last cylinders of predrying section. They planned investment on boiler capacities to overcome this issue.
4.4.4.4 Trial-4
Work done:
• Customer-2 made 60 GSM Writing&Printing production in PM1 in Location-2. Customer-2 wants to be leading company in Turkey which starts to use ASA, instead of AKD, since dosage amount of chemicals are important for writing&printing paper and they can get immediate result of ASA, since it doesn’t need oven curing during quality laboratory checks.
• Wet-end measurements were proper and normal to start-up the trial. Table 4.13 : Wet-end measurements before starting-up the trial
Machine Chest Headbox White water
pH 7,8
Cationic demad (meq/L) -60 -45 -42
Retention (%) 80
• Reference Cobb 60 with AKD was 24-30 when papersheet was oven cured. • Other chemicals in wet end were retention polymer and filler.
Results and discussions:
As shown in Figure 4.29, ASA was started at 4 kg/ton paper, Vector was started at 6 kg/ton paper and gradually decreased to 2,5 kg ASA/ton paper and 3,75 kg Vector/ton paper, since reference Cobb 60 values were reached.
50
Figure 4.28 : Cobb 60 values of wire and felt side of paper to ASA & Vector dosage in first day
Since we got required Cobb 60 values with 2,5 kg ASA/ton paper, as in first-day-trial shown in Figure 28, ASA dosage was started from 2,5 kg/ton. According to emulsion visual check, APC dosage started at 4,3 kg/ton.
As shown in Figure ASA was started at 2,5 kg/ton paper, APC was started at 4,3 kg/ton paper and gradually decreased to 2 kg ASA/ton paper and 3,8 kg APC/ton paper, since reference Cobb 60 values were reached.
Figure 4.29 : Cobb 60 values of wire and felt side of paper to ASA & APC dosage in second day
• Both ASA emulsifiers increased both retention and drainage values, and visully on the wire of paper machine, water line went back. [24]
29 29 27 23 23 25 26 2928 28 2726 25 2019 24 24 2726 25 0 0 4 4 3 3 2 2,52,5 0 0 6 6 4,3 4,3 3 3,753,75 -5 0 5 10 15 20 25 30 35 00:00 02:24 04:48 07:12 09:36 12:00 14:24 16:48 19:12 C OB B 60( g /m 2 ) Time Cobb 60 Elek Cobb 60 Keçe ASA dosaj (kg/t) Emulsifier dosaj (kg/t) Doğrusal (Cobb 60 Elek) Doğrusal (Cobb 60 Keçe)
27 29 27 27 26 25 28 32 27 26 25 20 19 24 24 27 26 25 0 0 0 2,52,5 2 2 2 0 0 0 6 6 4,34,3 3 -5 0 5 10 15 20 25 30 35 00:00 02:24 04:48 07:12 09:36 12:00 14:24 16:48 19:12 C OB B 60( g /m 2 ) Time Cobb 60 Elek Cobb 60 Keçe ASA dosaj (kg/t) Emulsifier dosaj (kg/t) Doğrusal (Cobb 60 Elek) Doğrusal (Cobb 60 Keçe)
51
o Vector was better than APC with regard to retention, so that 30 lt/h retention chemical was totally off, after ASA emulsion was started to be dosed.
o APC was better than Vector with regard to drainage. 10 lt/h retention was on but, since drainage was better, machine was able to run faster from 400 m/min to 410 m/min. [22]
• It was concluded that APC was both a very good ASA emulsifier and performance chemical for PM in order to accelerate drainage and speed.
• AKD average consumption: 8 kg/ton (total cost: 8 €/ton) • ASA: 2,5 kg/ton & Vector: 3,8 kg/ton (total cost: 13 €/ton) • ASA: 2 kg kg/ton & APC: 3,8 kg/ton (total cost: 15 €/ton)
• From total cost point of view, there was difference in between AKD ve ASA. But if customer-2 planned to sell as gypsum board or specialty paper, then total cost of ASA was easily affordable. Otherwise, for ordinary type of paper grades, ASA dosage should be less than 1 kg/ton, which was even theoritically not possible. This ASA and emulsifier dosage was alredy lowest degree of addition with regard to global paper producers.
• Customer-2 preferred ASA&APC couple since they increased productivity of machine by %3, which already afforded extra cost of ASA&APC couple.
• Customer-2 preferred ASA, instead of AKD, because they wanted to manage their wet-end system with less chemical dosage amount to disturb the system as less as possible.
52 5. CONCLUSIONS
According to the laboratory scale experimental sets performed during this thesis, MareASA was making proper couples with SNF APC 815, CK Starch-1, Polymin VZ, Vector in Mare GMBH laboratories in Germany and all these couples were worthwhile to be used together with in a trial in paper mill. MareASA together with APC and Vector was worked in Bursa Technical University once more to find alternative ASAs, so-called, Cargill 1210 and 57. However, due to emulsion quality and Cobb 60 parameters, only MareASA was proper to continue with, so that 1210 and 57 were eliminated. Although only MareASA was worthwhile to go on with, beside Vector and 815, RSL 4400 was also found as ASA emulsifier. According to emulsion qualities & WRV & Cobb 60 and water drop test values, MareASA and all emulsifiers ratio was determined as 1:1.
According to industrial scale experimental sets, Customer-1 and Customer-2 were leading companies to use ASA in their mill and in Turkey.
In Customer-1, ASA&Vector couple was used instead of AKD in greyboard production, which was preliminary proof to use in gypsum board production. Adding 7kg AKD/ton paper there was no sizing effect, whereas at dosage of 3kg ASA/ton paper, Cobb 60 value was decreased from around 500 gr/m2 to around 100 gr/m2. For proper emulsification and better feeding of ASA, emulsification unit was checked and it was detected that the static mixer elements which was the main point that ASA and emulsifier together with water were mixed and making emulsion and capsulation, produced a slightly better ASA emulsion in comparison to the unit without elements in the injector and when it was clean. Cobb 60 and air permeability values were similar with 3,3 kg ASA/ton paper and 5,4 kg Vector/ton paper and 4,5 kg ASA/ton paper and 6,5 kg Caran/ton paper, where as Caran emulsifier performed better than Vector in tensile width&length strength point of view. Regarding Vector usage, it was demonstrated that ratio 1:0,5 is enough for proper ASA emulsion which leaded to savings in ASA sizing and more than 75% of the emulsifier.
![Figure 2.1 : Rosin sizing mechanism [5]](https://thumb-eu.123doks.com/thumbv2/9libnet/4017094.55395/21.892.271.677.848.1107/figure-rosin-sizing-mechanism.webp)
![Figure 2.2 : AKD reaction mechanisms [5]](https://thumb-eu.123doks.com/thumbv2/9libnet/4017094.55395/22.892.155.790.95.1128/figure-akd-reaction-mechanisms.webp)

![Table 3.1 : Some grades that are sized in order to improve performance [10-14].](https://thumb-eu.123doks.com/thumbv2/9libnet/4017094.55395/25.892.168.791.1041.1157/table-grades-sized-order-improve-performance.webp)