ANALYSIS OF THE VARIABLES THAT DETERMINE
THE SATISFACTION LEVEL OF EMPLOYEES, AGENTS AND
ULTIMATE CUSTOMERS OF AN INSURANCE COMPANY
TUFAN ÖZKOL
B.S., Industrial Engineering, Naval Academy, 1994 M.A., Master of Business Administration, Işık University, 2003
Submitted to the Graduate School of Social Sciences in partial fulfillment of the requirements for the degree of
Doctor of Philosophy in
Contemporary Management Studies IŞIK UNIVERSITY
IŞIK UNIVERSITY
GRADUATE SCHOOL OF SOCIAL SCIENCES
ANALYSIS OF THE VARIABLES THAT DETERMINE
THE SATISFACTION LEVEL OF EMPLOYEES, AGENTS AND ULTIMATE CUSTOMERS OF AN INSURANCE COMPANY
TUFAN ÖZKOL
APPROVED BY:
Prof. Dr. Selime SEZGIN BAHÇEŞEHİR UNIVERSITY
Thesis Supervisor
Prof.Dr. Hacer ANSAL IŞIK UNIVERSITY
Assoc. Prof.Dr .Mehmet Emin KARAASLAN IŞIK UNIVERSITY
(Title and Name) (Affiliation) _____________________
(Title and Name) (Affiliation) _____________________
ANALYSIS OF THE VARIABLES THAT DETERMINE
THE SATISFACTION LEVEL OF EMPLOYEES, AGENTS AND ULTIMATE CUSTOMERS OF AN INSURANCE COMPANY
Abstract
The latest marketing theories and researches have showed that for understanding the complexity of service organizations and ensuring their long term success, the key point of success is the customer. Also the related concepts such as customer orientation, customer satisfaction and organizational culture have great importance. The purpose of this study is to analyze the variables that determine the satisfaction level of employees, agents and ultimate customers of an insurance company, to examine the relationships between them and additionally to describe and compare the types and patterns of organizational culture within the selected company.
Three different surveys were sent to the groups (all company employees, all insurance agents and some ultimate customers assigned by their agents of the selected insurance company) by e-mail to determine their satisfaction levels and their perceptions with respect to the cultural profile of the company. The quantitative data collected were analyzed by statistical methods through the SPSS version 15.0 software. The results showed that there exist relationships both between company employee satisfaction and insurance agent satisfaction, and between perception of the insurance agent service quality and perception of the ultimate customer service quality. In spite of the strength of these associations being very low, it would be right to deal with these concepts in a holistic perspective and not to think separately for reaching the goals of the company. Also, organizational culture profile of the selected insurance company was determined and seen that there was evidence of reasonable balance in the four cultural types. It can be said that this balance will provide organizational effectiveness to the company.
BİR SİGORTA ŞİRKETİNDE PERSONEL, ACENTE VE NİHAİ MÜŞTERİ MEMNUNİYETİNİ BELİRLEYEN DEĞİŞKENLERİN ANALİZİ
Özet
En son pazarlama teorileri ve araştırmaları, servis organizasyonlarının karışıklığını anlama ve onların uzun süreli başarılarını sağlama almada anahtar başarım noktasının müşteri olduğunu göstermişlerdir. Keza, müşteri oryantasyonu, müşteri memnuniyeti ve kurum kültürü gibi alakalı kavramlar büyük önem taşımaktadır. Bu çalışmanın amacı; bir sigorta şirketinin personel, acente ve nihai müşteri memnuniyeti belirleyen değişkenlerin analiz edilmesi, aralarındaki ilişkilerin incelenmesi ve bunlara ilave olarak seçilen sigorta şirketindeki kurum kültürünün tanımlanması ve mukayese edilmesidir.
Memnuniyet derecelerini ve algıları belirlemek için şirketin kültürel profiline göre guruplara (seçilen sigorta şirketi personelinin tamamı, acentelerinin tamamı ve acenteler tarafından belirlenen bazı nihai müşteriler), elektronik posta yoluyla üç farklı anket gönderilmiştir. Toplanan nicel veriler SPSS 15.0 yazılımı kullanılarak istatistiksel olarak analiz edilmiştir. Sonuçlar; hem şirket personeli memnuniyeti ve sigorta acentesi memnuniyeti arasında hem de sigorta acentesinin ve nihai müşterinin hizmet kalitesini algılaması arasında; ilişkilerin var olduğunu göstermiştir. Bu ilişkilerin güçleri her ne kadar çok düşük olsa da, şirketin hedeflerine ulaşması için bu kavramların ayrı olarak düşünülmemesi ve bütüncül bir perspektif ile ele alınması doğru olacaktır. Ayrıca, seçilen sigorta şirketinin kurum kültürü profili belirlenmiş ve dört kültür tipi arasında kabul edilebilir bir denge olduğu görülmüştür. Bu dengenin de şirkete organizasyonel verimlilik sağlayacağı söylenebilir.
Acknowledgements
I would like to express my gratitude to Prof. Dr. Selime SEZGİN, my supervisor for her scientific advice, continuous guidance, encouragement and latitude throughout the preparation of every part of this thesis without which this thesis would not have been possible.
I would like to extend my thanks to the professors at the Dissertation Committee. Prof. Dr. Hacer ANSAL and Associate Prof. Dr. Mehmet Emin KARAASLAN have contributed a lot with their wisdom and experience to my thesis work from early stages to the end.
I wish to thank Prof. Dr. Murat FERMAN, he has a big role in my life. He has opened my way to the academic world after years by granting admission to the M.B.A. program and emboldened me for this Ph.D. Program.
I am very grateful to Prof. Dr. Nimet URAY and Assistant Prof. Dr. Hasan Kemal SÜHER for their invaluable advice and encouragement. Many thanks to Associate Prof. Dr. Hakan ÇAMLICA and Ahmet BAŞÇI for their help in statistical applications; they allocated long hours for me with patience.
I also wish to thank to the managers from the insurance sector; Çetin KOLUKISA, Ufuk MISIRLIOĞLU, Erkan AYDOĞAN and Dr. Metin DEMİRAY for their valuable help and contributions for this study.
I wish to thank my parents and sister for their continuous support and sacrifice throughout my whole education period and life.
revealed much patience during relentless hard work when I advanced step by step towards the finalization of my dissertation. Lastly thanks to my little baby Ezgi, now she does not aware but I continued and finished this hard work with the strength that I took from my her love and existence.
Table of Contents
Abstract ii
Özet iii
Acknowledgements iv
Table of Contents vii
List of Figures x
List of Tables xii
List of Abbreviations xiv
Introduction 1
Literature Review 4
2.1 Definitions of Services ... 4
2.1.1 What is a Service ... 4
2.1.2 Service Sector in the Economy ... 5
2.1.3 Categories of Service Mix ... 10
2.1.4 Characteristics of Services and their Marketing Implications ... 14
2.1.5 Categories of Services Employing Different Processes ... 18
2.1.6 Rethinking of Original 4ps ... 21
2.1.7 Service Customer and Service Profit Chain ... 22
2.1.8 Service Quality and Customer Satisfaction... 26
2.1.8.1 Internal Service Quality and Internal Customer Satisfaction ... 29
2.1.8.2 External Service Quality and External Customer Satisfaction ... 33
2.2 Organizational Culture ... 36
2.2.1 Elements of Organizational Culture ... 38
2.2.2 Dimensions of Organizational Culture ... 40
2.2.3 Levels of Organizational Culture ... 42
2.2.4 Types of Organizational Culture ... 44
2.3 Insurance Services ... 55
2.3.1 Definition ... 55
2.3.2 Historical Aspect ... 57
2.3.3 Turkish Insurance History ... 60
2.3.4 Types of Insurance ... 61
2.3.5 The Role of Insurance in the Market Economy ... 64
2.3.6 Turkish Insurance Industry ... 67
2.4 Summary of the Literature ... 74
Methodolody 77 3.1 Aim of the Research ... 77
3.2 The Research Approach ... 77
3.3 The Method of Data Collection ... 78
3.4 Model of the Research ... 79
3.5 Hypothesis of the Research ... 82
3.6 The Study Design and Measurement Scales ... 84
3.6.1 Measurement of Organizational Culture ... 84
3.6.2 Measurement of Company Employee (Internal customer) Satisfaction .. 87
3.6.3 Measurement of Insurance agent (Distributor) Satisfaction ... 89
3.6.4 Measurement of Ultimate (External) Customer Satisfaction ... 92
3.6 Variables ... 92
3.8 Sampling ... 96
3.9 Limitations of the study ... 96
3.10 Assumptions of the study ... 97
3.11 Instrumentation ... 97
3.12 Reliability and Variability ... 97
Analysis and Discussion of Results 99 Conclusion 138 References 143 Appendix A Company Employee (Internal Customer) Survey 155 A.1 Turkish Version ... 155
B.1 Turkish Version ... 162 B.2 English Version ... 166
Appendix C Ultimate Customer Survey 171
C.1 Turkish Version ... 171 C.2 English Version ... 174
List of Figures
Figure 1.1 Changing Structure of Employment as Economic
Development Evolves ... 2
Figure 2.1 Value Added Shares of the Service Sector over Time (in per cent) ... 7
Figure 2.2 Share of Broad Service Groups in Current Price Value Added of the Total Economy (in percent) ... 8
Figure 2.3 % of Sectors in the GDP of Turkey ... 10
Figure 2.4 Continuum of Evaluation for Different types of Products ... 12
Figure 2.5 Value Added by Tangible vs Intangible Elements in Goods and Services ... 15
Figure 2.6 Three Types of Marketing in Service Industries ... 22
Figure 2.7 The Links in the Service-Profit Chain ... 25
Figure 2.8 Service-Quality Model ... 35
Figure 2.9 7-S Model, Seven Core Elements of Organizational Culture ... 38
Figure 2.10 Manifestations of Organizational Culture ... 39
Figure 2.11 The Trait-Strength Framework ... 41
Figure 2.12 Levels of Organizational Culture ... 42
Figure 2.13 The Layers of Organizational Culture... 44
Figure 2.14 The Competing Values Framework ... 46
Figure 2.15 Variety of Approaches of Culture Research ... 48
Figure 2.16 The Criteria of Competing Values Model ... 49
Figure 2.17 Four Models of Competing Values Approach ... 51
Figure 2.19 Foreign Partners Share in Turkish Insurance Sector ... 69
Figure 2.20 Premium by Distribution Channels (%) ... 71
Figure 3.1 Hypothetical Model of the Research ... 81
Figure 4.1 Organizational Culture Archetype of the Selected Insurance Company ... 107
the Dimensions…… ... 114
Figure 4.3 Insurance Agent Satisfaction Level ... 119
Figure 4.4 Company Employee and Insurance Agent Satisfaction Levels according to the Dimensions ... 120
Figure 4.5 Insurance Agent Servqual Dimensions ... 122
Figure 4.6 Ultimate Customer Servqual Dimensions ... 125
Figure 4.7 Insurance Agent and Ultimate Customer Servqual Dimensions ... 126
Figure 4.8 Company Employee and Insurance Agent Satisfaction Levels ... 128
Figure 4.9 Insurance Agent and Ultimate Customer Servqual Scores ... 131
List of Tables
Table 2.1 Gross Domestic Product by kind of Economic Activity (Turkey) ... 9
Table 2.2 Four Categories of Services Employing Different Underlying Processes ... 19
Table 2.3 Components of Internal Service Quality ... 31
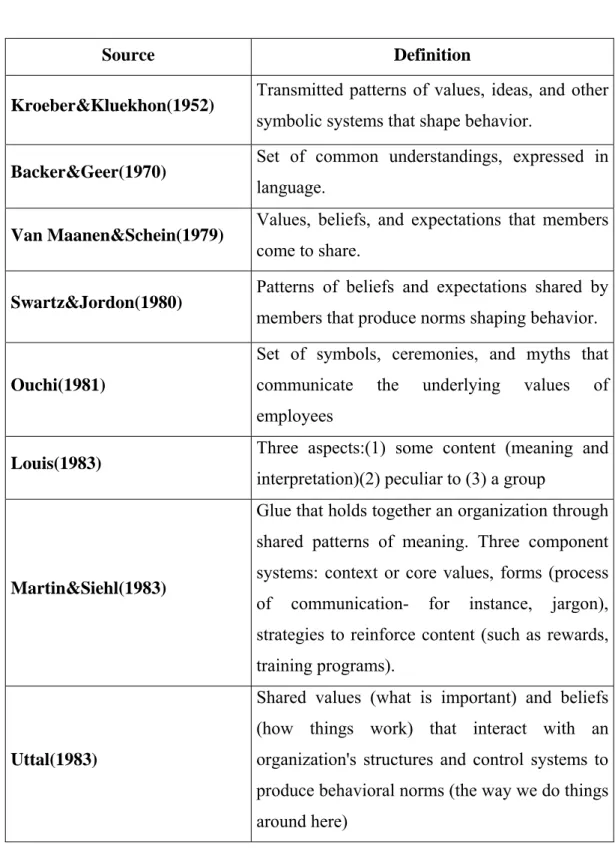
Table 2.4 Culture Definitions ... 37
Table 2.5 Four Types of Hypotheses on the Types of Organizational Culture ... 45
Table 2.6 Insurance Branches and Sub-branches Determined According to the Insurance Supervision Law ... 63
Table 2.7 Turkish Finance Sector Balance Sheet Size ... 68
Table 2.8 The Ratio of GDP from Insurance / Pension Sector Balance Sheet Size ... 68
Table 2.9 General Indicators of Insurance - Privilege Pension Companies ... 70
Table 2.10 Premium Volume by Distribution Channels (Non-Life Companies) .... 71
Table 2.11 Global Insurance Industry (2005) ... 72
Table 2.12 European Union Insurance Industry (2005) ... 73
Table 3.1 Definitions of Variables and Measurement scales of Variables ... 93
Table 3.2 Company structure of the company ... 96
Table 4.1 Survey participation ... 100
Table 4.2 Frequency Distribution of Demographic Variables of Company Personnel ... 101
Table 4.3 Frequency Distribution of Demographic Variables of Insurance Agents . ... 102
Table 4.4 Frequency Distribution of Demographic Variables of Ultimate Customer ... 103
insurance company ... 106 Table 4.7 Hypothesis Related to Factors of Company Employee Satisfaction .... 110 Table 4.8 Strength of Associations Between the Variables ... 111 Table 4.9 Hierarchical Regression Analysis of Company Employee ... 112 Table 4.10 Hierarchical Regression Analysis of Company Employee ... 112 Table 4.11 Hypothesis Related to Factors of Distributor Satisfaction and Service Quality Dimensions ... 115 Table 4.12 Hierarchical Regression Analysis of Insurance Agent (Satisfaction) . 117 Table 4.13 Hierarchical Regression Analysis of Insurance Agent (Satisfaction) .. 118 Table 4.14 Hierarchical Regression Analysis of Servqual (Insurance Agents) ... 121 Table 4.15 Hierarchical Regression Analysis of Servqual (Insurance Agents) ... 121 Table 4.16 Hypothesis Related to Factors of Ultimate Customer Satisfaction ... 123 Table 4.17 Hierarchical Regression Analysis of Servqual (Ultimate Customer) .. 124 Table 4.18 Hierarchical Regression Analysis of Servqual (Ultimate Customer) .. 124 Table 4.19 The Hypothesis Related with the Demographic Factors ... 127 Table 4.20 Company Employee and Insurance Agent Satisfaction Levels and Servqual Scores ... 128 Table 4.21 Company Employee and Insurance Agent Satisfaction Pearson Correlation . ... 130 Table 4.22 Company Employee and Insurance Agent Satisfaction Level Comparison / Independent Samples t Test ... 130 Table 4.23 Ultimate Customer and Insurance Agent Satisfaction Pearson Correlation . ... 132 Table 4.24 Comparison of Insurance Agent and Ultimate Customer Servqual Scores …… ... 132 Table 4.25: Results of the Hypothesizes of the Study ... 133
List of Abbreviations
A.D. Anno Domini / After Death
AIRCT Association of the Insurance and Reinsurance Companies of Turkey
B.C. Before Christ
BRSA Banking Regulation and Supervision Agency
CPI Consumer Price Index
CRBT Central Bank of the Republic of Turkey
EGM Pension Monitoring Center
Et al. Abbreviation of et alii, et aliae or et alia when referring to a number of people
EU European Union
GDP Gross Domestic Product
ISB Insurance Supervisory Board
LPG Liquefied Petroleum Gas
SPSS Statistical Package for the Social Sciences TARSIM Turkish Agricultural Insurance Pool TCIP Turkish Catastrophe Insurance Pool
TPL Third Party Liability
TRAMER Motor TPL Insurance Information Center
UCCET The Union of Chambers and Commodity Exchanges of Turkey
USD United States Dollars
Chapter 1
Introduction
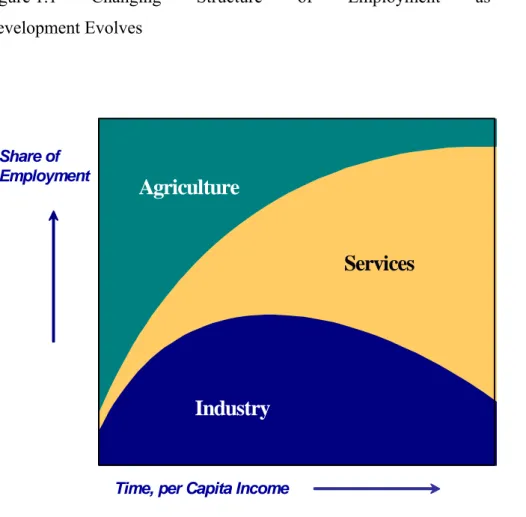
Service industries, such as education, health care, banking, insurance, tourism, transportation and communication, are increasing their importance for national economies. This increasing importance in the service sector can be attributed to the factors such as its employment creation capacity, its effect on the productive economic growth and its dynamic link to industrial competitiveness. The service sector, especially in developed countries is growing rapidly. In most developed countries, including Australia, the service sector employs around three-quarters of the total workforce and accounts for 70-76% of the gross domestic product (GDP) (Australian Manufacturing Council, 1990). And in Japan, the service sector has been growing continuously, and accounts for more than two-thirds of GDP in terms of value added (Mizuno, 2006). As nation’s economy develops the share of employment between agriculture, industry (including manufacturing and mining), and services changes dramatically (Lovelock and Wright, 2002). In Figure 1.1, it is shown how the evolution to a service dominated employment base is likely to take place over time as per capita income rises.
Figure 1.1 Changing Structure of Employment as Economic Development Evolves
Time, per Capita Income Share of
Employment
Industry
Services
Agriculture
Source: International Monetary Fund, World Economic Outlook, Washington D.C. May 1997.
The latest marketing theories and researches showed that for understanding the complexity of service organizations and for developing successful service organizations, the key point is the customer. Also the related concepts such as customer orientation, customer satisfaction and organizational culture have great importance. The purpose of this study is to analyze the variables that determine the satisfaction level of employees, agents and ultimate customers of an insurance company, and additionally to describe and compare the types and patterns of organizational culture within the selected insurance company. It is proposed to present at the end of the research whether there is a relationship between internal customer satisfaction – distributor satisfaction, and distributor satisfaction - external customer satisfaction.
The study is important because it will provide a holistic approach to researchers and managers for understanding organizational culture, internal customer satisfaction, distributor satisfaction, external customer satisfaction, and also the relationship and the service quality gaps that have occurred between them. The findings of the research will enable the strategists to design appropriate policies and strategies to fill in the gaps. And it will also provide necessary information for managers or strategy makers to do their tasks more successfully.
Chapter 2
Literature Review
This chapter provides a comprehensive overview for this study. There are three
sections in this chapter: 1) Definitions of Services; 2) Organizational Culture; 3) Insurance Services.
2.1 Definitions of Services
Today, services form the dominant sector of most developed countries and they have a wide range. The business sector; with its insurance companies, banks, hotels and real estates; the private non profit sector; with its museums, charities, schools and hospitals; and the government sector; with its courts, hospitals, military services, police and fire departments; and post office are in the service sector. Many employees in the manufacturing sector such as computer operators, accountants, and legal staff are really service providers. In fact, they make up a “service factory” providing services to the “goods factory” (Kotler et al., 1996). It accounts for over half of the economy in most developing and for over 70 percent in many highly developed countries (Lovelock and Wright, 2002).
2.1.1 What is a Service
Services have been generally difficult to define because of their diverse characteristics. While there is little difficulty in defining manufacturing and agriculture, defining service is much more complicated, their nature contains many intangible inputs and outputs.
One of the pioneers in the field of service quality, defined service as: A service is an activity or series of activities of more or less intangible nature that normally, but not necessarily, take place in interactions between the customer and service employees and/or physical resources or goods and/or systems of the service provider, which are provided as solutions to customer problems. (Gringos, 1990)
A contemporary definition: A service is any activity or benefit that one party can offer to another which is essentially intangible and does not result in the ownership of anything. Its production may or may not be tied to a physical product. (Kotler et al., 1996)
Services are economic activities that create value and provide benefits for customers at specific times and places, as a result of bringing about a desired change in or –on behalf of – the recipient of the service. Humorously, service has been described as “something that may be bought and sold, but which cannot be dropped on your foot” (Lovelock and Wright, 2002).
For example one hour psychotherapy given by a psychologist is a service; there is a benefit for the recipient’s health at a specific time and place. That is an economic activity also, recipient gives money to the psychologist but there is no tangible product. If it was one hour psychotherapy given by a psychologist from another country by way of internet; that product would be again a service but this time the service would require a capital intensive good - a computer - for its realization even if the primary item is a service.
2.1.2 Service Sector in the Economy
Service industries, such as education, health care, banking, insurance, tourism, hospitality, transportation and communication, are increasing their importance for national economies.
This increasing importance in the service sector can be attributed to the factors such as its employment creation capacity, its effect on the productive economic
growth and its dynamic link to industrial competitiveness. The service sector,
especially in developed countries is growing rapidly. In most developed countries, the service sector employs around three-quarters of the total workforce and accounts for 70-76% of the gross domestic product (GDP). (Mizuno, 2006)
Service organizations range in size from huge international corporations like airlines, banking, insurance, telecommunications, and hotel chains to a vast array of locally owned and operated small businesses including restaurants, laundries and etc. Governments and small non profit organizations are also in the business of providing services, although the extent of such involvement may vary widely from one country to another and reflect both tradition and political values (e.g. parks, museums, charities, schools and hospitals).
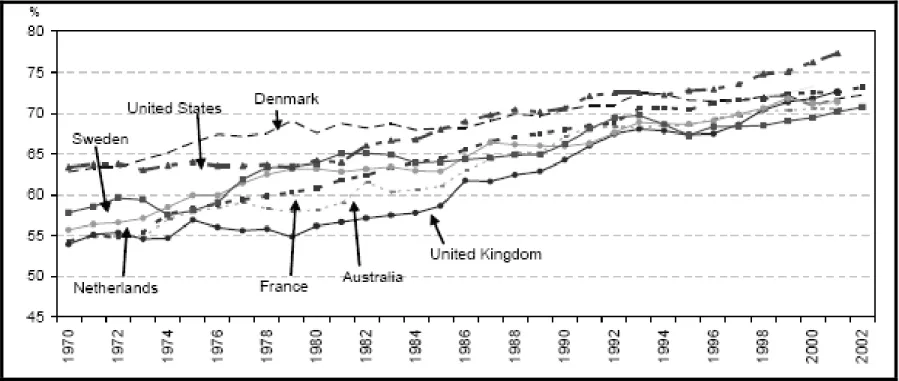
In Figure 1.1; the changing structure of employment as economic development evolves is presented. As shown in Figure 2.1; by 2002, the share of the service sector amounted to about 70% of total value added in most OECD economies, and this has increased considerably since the 1970s. Increase in the share of the service sector in total value added can mainly be attributed to the growth of business related services.
Figure 2.1 Value Added Shares of the Service Sector over Time (in per cent)
In particular, finance, insurance and business services have experienced a strong increase in value added shares as shown in Figure 2.2. These industries now account for about 20%-30% of value added in the total economy, while their respective shares were between 10% and 20% in 1980. (Wolf, 2006)
Figure 2.2 Share of Broad Service Groups in Current Price Value Added of the Total Economy (in percent)
Source: Wolf (2003), based on the OECD STAN Database.
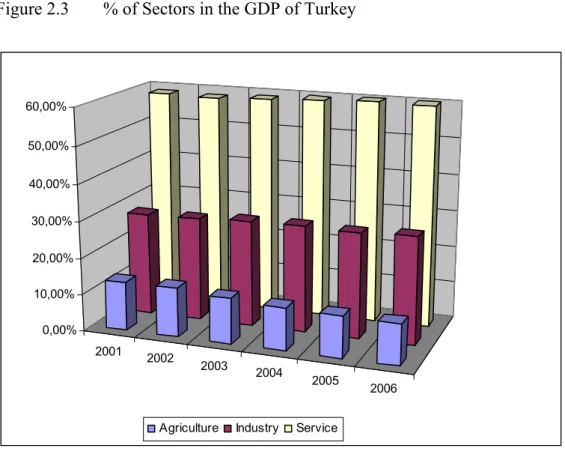
In Table 2.1, Gross Domestic Product by kind of economic activity in Turkish economy is seen between years (1970 – 2006) in detail. In Figure 2.3, the sector shares in GDP of Turkey are seen between years (2001 – 2006). As shown the GDP proportion of services is about 60% and showing a serious increasing trend since 1976. GDP proportion of industry is about 29%, showing an increasing trend between years (1976-1996) and it is about 29% since then. GDP proportion of agriculture is about 11% and showing a decreasing trend. These results are compatible with the Table in Figure 1.1.
Table 2.1 Gross Domestic Product by kind of Economic Activity (Turkey) Year GDP Sector Share % Growth Rate % Agriculture Sector Share % Growth Rate % Industry Sector Share % Growth Rate % Services Sector Share % Growth Rate % 1970 33.765.132,30 100 3,2 10.595.792,40 31,4 2,8 6.039.971,30 17,9 -0,5 17.129.368,60 50,7 4,9 1975 44.748.268,20 100 7,2 11.315.683,60 25,3 3 9.514.812,80 21,3 9,1 23.917.771,80 53,4 8,5 1980 50.295.990,80 100 -2,4 12.287.950,90 24,4 1,3 10.424.177,60 20,7 -3,6 27.583.862,30 54,8 -3,6 1985 63.776.134,20 100 4,2 12.396.027,50 19,4 -0,3 15.116.140,80 23,7 6,5 36.263.965,90 56,9 4,9 1990 83.578.464,10 100 9,3 13.746.286,60 16,4 7 21.872.602,60 26,2 9,3 47.959.574,90 57,4 9,9 1995 97.887.800,00 100 7,2 14.230.305,00 14,5 1,3 27.475.756,00 28,1 12,5 56.181.739,00 57,4 6,3 2000 118.789.113,00 100 7,4 15.641.800,00 13,2 3,8 33.170.615,00 27,9 6,2 69.976.698,00 58,9 8,8 2001 109.885.336,00 100 -7,5 14.710.538,00 13,4 -6 30.721.579,00 28,0 -7,4 64.453.220,00 58,7 -7,9 2002 118.612.222,00 100 7,9 15.808.470,00 13,3 7,5 33.502.214,00 28,2 9,1 69.301.538,00 58,4 7,5 2003 125.485.113,00 100 5,8 15.422.217,00 12,3 -2,4 36.100.528,00 28,8 7,8 73.962.368,00 58,9 6,7 2004 136.692.580,10 100 8,9 15.733.558,20 11,5 2 39.488.535,80 28,9 9,4 81.470.486,10 59,6 10,2 2005 146.780.723,00 100 7,4 16.625.493,00 11,3 5,7 42.107.627,00 28,7 6,6 88.047.603,00 60,0 8,1 2006 155.732.493,40 100 6,1 17.109.107,50 11,0 2,9 45.289.495,40 29,1 7,6 93.333.890,40 59,9 6,0
Gross Domestic Product by kind of economic activity (' 000 000 TL)
* Imputed bank service charges are deducted from the sectors.
Figure 2.3 % of Sectors in the GDP of Turkey 2001 2002 2003 2004 2005 2006 0,00% 10,00% 20,00% 30,00% 40,00% 50,00% 60,00%
Agriculture Industry Service
Source: National Accounts, www.turkstat.gov.tr
2.1.3 Categories of Service Mix
Most products contain a mixture of goods-tangible elements and service-intangible elements. For example, a meal in a restaurant contains a combination of goods elements (the food) and service elements (the manner in which the food is served). The service component can be a major or minor part of the product or total offering. There are generally five categories of offerings (Kotler, 2002);
• Pure tangible good: No services accompany the product. The offering consists of just a tangible good such as soap, toothpaste, or salt.
• Tangible good with accompanying services: The offering consists of a tangible good accompanied by one or more services.
Levitt (1972) observes that "the more technologically sophisticated the generic product (e.g., cars and computers), the more dependent are its sales on the quality and availability of its accompanying customer services (e.g., display rooms, delivery, repairs and maintenance, application aids, operator training, installation advice, warranty fulfillment). In this sense, General Motors is probably more service intensive than manufacturing intensive. Without its services, its sales would shrive.”
• Hybrid: The offering consists of equal parts of goods and services. For example, people patronize restaurants for both food and service.
• Major Service with accompanying minor goods and services: The offering consists of a major service along with additional services or supporting goods. For example, airline passengers buy transportation service. The trip includes some tangibles, such as food and drinks, a ticket stub, and an airline magazine. The service requires a capital-intensive good-an airplane-for its realization, but the primary item is a service (Kotler, 2002). Also, a car insurance policy is primary a service but it includes some minor additional services such as assistance services and some minor goods such as a substitute car in case of a damage of policy holder’s car.
• Pure service: The offering consists primarily of a service (e.g., baby-sitting, psychotherapy, and massage).
Figure 2.4 Continuum of Evaluation for Different types of Products D iffic u lt to e v a lu a te E a s y to e v a lu a te C loth in g Je w el ry Fu rn itu re H ou ses A ut om ob il es R es ta ur an t m ea ls V ac atio ns H ai rc ut s C hi ld c ar e T el ev is io n re pa ir L eg al s er vi ce s R oo t c anal s A ut o re pa ir M ed ic al d ia gnos is H ig h in se a rc h
q u a litie s H ig h in e x p e rie n c eq u a litie s H ig h in c re d e n c eq u a litie s
M o s t G o o d s
M o s t S e r v ic e s
received the service. In Figure 2.4, various products and services according to difficulty of evaluation are seen. At the left are goods high in search qualities – that is, characteristics the buyer can evaluate before purchase. In the middle are goods and services high in experience qualities – characteristics the buyer can evaluate after purchase. At the right are goods and services high in credence qualities – characteristics the buyer normally finds hard to evaluate after consumption (Ostrom and Lacobucci, 1996). Services are more risky in purchase than goods, because they are generally high in experience and credence qualities. Insurance services are high in credence qualities if the risk is not realized during the policy period, the buyer can not evaluate the product.
There are some other generalizations furthermore that can be added to varying goods-to-service mix;
• Services vary as to whether they are equipment-based (dry cleaning) or people-based (baby sitting, window washing). People-people-based services vary by whether they are provided by unskilled, skilled, or professional workers.
• Some services require the client's presence and some do not. Brain surgery involves the client's presence, a car repair does not. If the client must be present, the service provider has to be considerate of his or her needs. Thus beauty salon operators will invest in decor, play background music, and etc.
• Services differ as to whether they meet a personal need (personal services) or a business need (business services). Service providers typically develop different marketing programs for personal and business markets.
• Service providers differ in their objectives (profit or nonprofit) and ownership (private or public) (Kotler, 2002).
Distinctive characteristics of pure services that differentiate them from goods are often described as intangibility, inseparability, variability, perishability and the inability to own a service. Most products are a combination of goods and services, pure goods and pure services are hypothetical extremes, but they are nevertheless important to note because they help to define these distinctive characteristics (Palmer, 2000).
a) Intangibility: A pure service cannot be assessed or directly examined before it is purchased. A prospective purchaser of most goods is able to examine its physical integrity, aesthetic appearance, taste, smell, etc. By contrast, pure services have no tangible properties which can be used by consumers to verify advertising claims. The intangible process characteristics which define services, such as reliability, personal care, attentiveness of staff, their friendliness, etc., can only be verified once a service has been purchased and consumed (Palmer, 2000). Services are performances for which uniform quality specifications can rarely be set. This is often considered to be the critical difference between goods and services (Zeithaml, 1996).
In real life, goods form an important component of a service offer, degree of intangibility has many uses as a classification device. The presence of a tangible component gives customers a visible basis on which to judge quality. While some services (such as golf clubs) are rich in such tangible cues, other services provide relatively little tangible evidence (e.g. life insurance). In Figure 2.5, goods and services are placed on a scale from tangible dominant to intangible dominant.
Goods and Services
Source: Lovelock, C. and Wright (2002), L., Service Marketing and Management, New Jersey: Prentice Hall, 11.
Intangibility increases the level of uncertainty that a consumer faces when choosing between competing services. Berry (1996) suggested managers that they need to “tangiblize” the intangibles if at all possible. This will help customers to asses the quality of the experience prior to the purchase decision and this will reduce risks. An important part of a services marketing program will therefore involve reducing consumer uncertainty by adding physical evidence while developing its brand value. It is interesting to note that pure goods and pure services tend to move in opposite directions in terms of their general approach to the issue of tangibility. While service marketers seek to add tangible evidence to their product, pure goods marketers often seek to augment their products by adding intangible elements such as after-sales service and improved distribution. The reason of this augmentation is pure goods marketer’s wants to differentiate and add value to their products.
production of the service taking place simultaneously, an interaction that requires the service provider and customer to be present (Buttle, 1993). The production and consumption of a tangible good are two separate activities. Companies usually produce goods in one central location and then transport them to the place where customers most want to buy them. Production and consumption are said to be separable. On the other hand, the consumption of a service is said to be inseparable from its means of production. Producer and consumer must interact in order for the benefits of the service to be realized. Both must normally meet at a time and a place that is mutually convenient in order that the producer can directly pass on service benefits. In the extreme case of personal care services, the customer must be present during the entire production process. A surgeon, for example, cannot provide a service without the involvement of a patient (Palmer, 2000).
Inseparability has a number of important marketing implications for services. Firstly, whereas goods are generally first produced, then offered for sale, and finally sold and consumed, services are generally sold first, then produced and consumed simultaneously(e.g., a theatre ticket or hotel reservation). Secondly, while the method of goods production has little importance to the consumer, production processes are critical to the enjoyment of services. In the case of goods, the consumer is not a part of the process of production and, in general, so long as the product which they receive meets their expectations, they are satisfied. With services, the active participation of the customer in the production process makes the process as important as the end benefit (e.g., one night a hotel; whole performance is realized in front of the consumer. Even the politeness of the doorman is very critique).
c) Variability: Variability refers to the idea that the service performances usually can vary between different producers, customers and days, causing uniform quality to be difficult to assure because many service delivery processes require a high level of labor input (Becker, 1996). Most people probably have experienced high levels of variability in services such as railway journeys, restaurant meals, or legal advice.
also in terms of processes of production. Because the customer is usually involved in the production process for a service at the same time as they consume it, it can be difficult to carry out monitoring and control to ensure consistent standards. The opportunity for pre-delivery inspection and rejection which is open to the goods manufacturer is not normally possible with services.
In many labor-intensive personal services provided in a one-to-one situation, such as personal healthcare, it is impractical to monitor service production. But some services allow greater scope for quality control checks to be undertaken during the production process, allowing an organization to provide a consistently high level of service (e.g. machine-based services, telecommunication). (Palmer, 2000)
The variability of service output can pose problems for brand building in services compared to tangible goods because of that service firm’s value internal marketing – train and motivate employees to serve customers well- , in some cases, service offers have been simplified, jobs have been ‘deskilled’, and personnel replaced with machines in order to reduce human variability.
d) Perishability: Perishability refers to the idea that services can not be produced in advance or stored for the use in the future (Gronroos, 1990). For example, a concert ticket can be sold only for a particular seat on a specific day. The inability to store, resell, return, save or transport a service is one of the main differences between goods and services(Norman, 2000)
While services cannot be stored, most manufactures of goods that are unable to sell their current output can carry forward stocks for future sale. The only significant costs are storage costs, financing costs, and the possibility of loss through wastage or obsolescence. The producer of a service which cannot sell all of its output produced in the current period gets no chance to carry it forward for sale in a subsequent period. A train operator which offers seats on the 16.10 train from Ankara to Istanbul cannot sell any empty seats once the train has departed.
demand which may occur later in the day.
Most services do not show a constant pattern of demand through time. Many show considerable variation and follow an hourly, daily, weekly (weekend peak in demand for cinema) or seasonal (shops at feast) pattern (Palmer, 2000). Producing a better match between supply and demand is always critique for service business and service providers so capacity management is an important process for managers in the service sector. They implement different strategies for matching them. Pricing and promotion are two of the tools commonly adopted to resolve demand and supply imbalances.
e) Inability to own services: The inability to own a service is related to the characteristics of intangibility and perishability. Customers derive value from services without obtaining permanent ownership of any substantial tangible elements (Palmer, 2000). When a service is performed, no ownership is transferred from the seller to the buyer, the buyer just buys the right to a service process such as the use or a car park or a doctor's time. In may instances, service marketers offer customers the opportunity to rent the use of a physical object like a car or hotel room or hire the labor and skills of people whose expertise ranges from brain surgery to knowing how to check customers into a hotel (Lovelock and Wright, 2002). Also leasing is a kind of service and one of the several marketing tools at the disposal of the firms which manufacture or distribute equipment. At the end of the lease period the customer may wish to buy the 'rest' of the thing leased (e.g. a car), and may exercise the purchase option but leasing is actually borrowing it from the leasing company and paying for the depreciation that occurs during the term of the lease.
2.1.5 Categories of Services Employing Different Processes
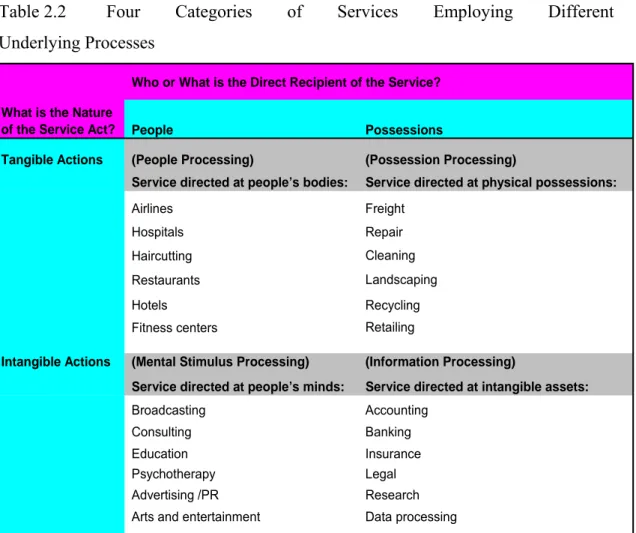
A process involves transforming input into output. By looking at services from a purely operational perspective, it is seen that they can be categorized into four broad groups.
or to customers' physical possessions and intangible actions to people's minds or to their intangible assets; is seen in Table 2.2. Each of these four categories involves fundamentally different forms of processes, with vital implications for marketing, operations, and human resource managers. The categories can be classified as people processing, possession processing, mental stimulus processing, and information processing. Managers in one industry may be able to obtain useful insights by studying another one and then creating valuable innovations for their own organization. (Lovelock and Wright, 2002)
Table 2.2 Four Categories of Services Employing Different Underlying Processes
Who or What is the Direct Recipient of the Service? What is the Nature
of the Service Act? People Possessions
Tangible Actions (People Processing) (Possession Processing)
Service directed at people’s bodies: Service directed at physical possessions:
Airlines Freight
Hospitals Repair
Haircutting Cleaning
Restaurants Landscaping
Hotels Recycling
Fitness centers Retailing
Intangible Actions (Mental Stimulus Processing) (Information Processing)
Service directed at people’s minds: Service directed at intangible assets:
Broadcasting Accounting Consulting Banking Education Insurance
Psychotherapy Legal
Advertising /PR Research
Arts and entertainment Data processing
Source: Lovelock, C. and Wright (2002), L., Service Marketing and Management, New Jersey: Prentice Hall, 34.
• People Processing Services: These services require the customer’s presence while the service is being provided. Typically such services are directed or applied to people and so their presence is mandatory. To use, enjoy and buy these services customers must be prepared to spend time co-operating with the service operation (Lovelock et al., 1996). Typical examples are beauty salons, medical services, passenger transport, hotels, fitness centers and haircutting.
• Possession Processing Services: These services are aimed at peoples’ possessions, such as goods transportation, laundry, dry cleaning, repair service and etc. Clearly these services do not require customer involvement in the process and so from a marketing perspective are less complex than people processing services.
• Mental Stimulus Processing Services: These services interact with people's minds include education, news and information, professional advice, psychotherapy, entertainment, and certain religious activities. Recipients don't necessarily have to be physically present in a service factory, just mentally in communication with the information being presented. Because the core content of all services in this category is information based (whether music. voice. or visual images). Many of these services are embodied in goods such as CD, DVDs, books, movies, cassettes and so are exportable as any other physical products (Vandermerwe and Chadwick, 1989).
• Information processing Services: These services describe intangible actions directed at a customer's assets. Examples of information -processing services include insurance, banking, accounting and consulting. In this category, little direct involvement with the customer may be needed once the request for service has been initiated (Lovelock and Wright, 2002).
The familiar “4Ps” marketing mix is very much based on the needs of the manufactured goods sector and these 4Ps have been found to be too limited in their application to services (Palmer, 2000). These weaknesses have resulted in a number of attempts to redefine a marketing mix for the services sector. Booms and Bitner (1981) provides a useful framework for the services sector and in addition to the four traditional elements of the marketing mix, recognize the importance of People, Processes, Physical evidence as additional elements. If it is summarized;
• Product elements: All aspects of service performance that create value; such as core product features—both tangible and intangible elements. (e.g. guarantees) • Place and time: Management decisions about where, when, and how to deliver
services to customers (e.g. geographic locations served, channel partners/ intermediaries)
• Promotion and education: All communication activities and incentives designed to build customer preference for a specific service or a service provider. Communications can be delivered by individuals, such as sales people and trainers, or through such media as TV, radio, magazines, newspaper, billboards, brochures and Web sites.
• Price and other user outlays: All expenditures of money, time and effort that customers incur in purchasing and consuming services. Service provider seeks to identify and minimize additional monetary costs associated with service usage incurred by users (parking, phone, babysitting, etc.) (Lovelock and Wright, 2002).
Adding three new elements;
• Physical environment: The visual and other tangible clues such as buildings, equipment, smell that provide evidence of firm’s service style and quality.
• Process: Method and sequence in service creation and delivery such as design of activity flows.
• People: All customers and employees who are involved in a service production. Service provider devotes significant effort to manage the human side of the enterprise; such as job design, training, motivation (Lovelock and Wright, 2002).
2.1.7 Service Customer and Service Profit Chain
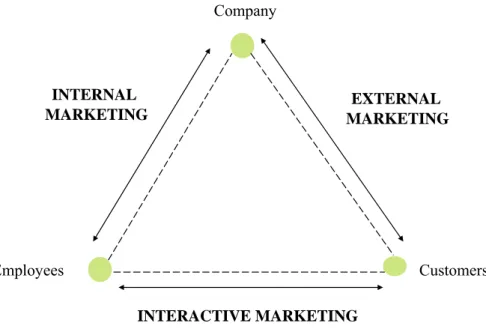
Service marketing requires not only external marketing, but also internal and interactive marketing as seen in Figure 2.6 (Gronroos, 1984).
Figure 2.6 Three Types of Marketing in Service Industries
Source: Gronroos, C. (1984) A Service Quality Model and Its Marketing Implications, European Journal of Marketing, Vol. 18, No. 4, pp. 36-44.
Internal marketing describes the work to train and motivate employees to serve customers well (Gronroos, 1984). External marketing describes the normal work to prepare, price, distribute, and promote the service to customers. Interactive marketing describes the employees’ skill in serving the client. Because the client judges service not only by its technical quality (e.g., was the breakfast good) but also by its functional quality (e.g., was the waitress polite and concerned) (Gronroos, 2000). Company INTERNAL MARKETING EXTERNAL MARKETING INTERACTIVE MARKETING Employees Customers
organization. Those groups can be regarded as internal customers and internal suppliers. The focus of internal marketing effort is the management of relationships between internal customers and their internal suppliers. This concept of the internal supplier and the internal customer can encompass all other definitions of internal marketing (Brooks et al., 1999).
The identification of internal and external customers is an important issue emerging from the study. It should be understood that customer service includes providing service to both external customers and internal customers. External customers are an organization’s consumers or visitors. They often pay for products or services and expect to be treated well. Internal customers are the company employees. Weinstein (1996) stated that "If you want your company to provide excellent customer service, you first have to provide that same kind of attention and appreciation to your internal customers - your own employees. You can't expect your employees to provide "service with a smile" if you don't give them something to smile about!”. Gummeson (1987) suggests that everybody should see himself as a customer of colleagues, receiving products, documents, messages, etc. from them, and he should see himself as a supplier to other internal customers. A job has been properly executed only when the customer is satisfied - it is the satisfied customer that counts irrespective of whether he is external or internal.
Internal perceptions of an organization’s human resource management practices can be significantly correlated with customers’ perception of service quality (Bowen, 1996 and Mohr- Jackson, 1991). To attain sustained excellent customer support requires internal systems that are aligned to serve the external customer, with each internal subsystem adding value to others within the organization that are dependent on it (Gilbert, 2000).
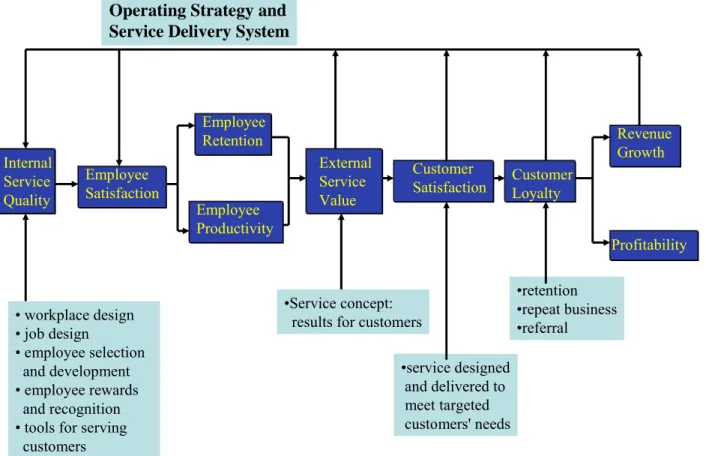
techniques calibrate the impact of employee satisfaction, loyalty, and productivity on the value of products and services delivered so that managers can build customer satisfaction and loyalty and assess the corresponding impact on profitability and growth. The lifetime value of a loyal customer can be astronomical, especially when referrals are added to the economics of customer retention and repeat purchases of related products. For example, the lifetime revenue stream from a loyal pizza eater can be $8,000 or a Cadillac owner $332,000. Heskett (1994) developed the service-profit chain (in Figure 2.7) from analyses of successful service organizations. It helps managers target new investments to develop service and satisfaction levels for maximum competitive impact, widening the gap between service leaders and their merely good competitors. It establishes relationships between profitability, customer loyalty, and employee satisfaction, loyalty, and productivity. The links in the chain are as follows: Profit and growth are stimulated primarily by customer loyalty. Loyalty is a direct result of customer satisfaction. Satisfaction is largely influenced by the value of services provided to customers. Value is created by satisfied, loyal, and productive employees. Employee satisfaction, in turn, results primarily from high-quality support services and policies that enable employees to deliver results to customers. (Heskett, 1994)
Figure 2.7 The Links in the Service-Profit Chain
Source: Heskett J.L., Jones T.O., Loveman G. W., Sasser Jr W.E., Schlesinger L. A., Putting the Service-Profit Chain to Work, Harvard Business Review, Mar-Apr 1994, Pg. 164 – 174
Internal Service Quality Employee Satisfaction Employee Retention Employee Productivity External Service Value Customer
Satisfaction CustomerLoyalty
Revenue Growth Profitability • workplace design • job design • employee selection and development • employee rewards and recognition • tools for serving
customers
•Service concept: results for customers
•service designed and delivered to meet targeted customers' needs •retention •repeat business •referral
Operating Strategy and Service Delivery System
2.1.8 Service Quality and Customer Satisfaction
Researches have demonstrated that quality has strategic benefits in contributing to market share and return on investment as well as lowering manufacturing costs and improving productivity (Anderson and Zeithaml, 1984; Garvin, 1983; Tse and Wilton, 1988). Delivering excellent service is a winning strategy because quality service sustains customer confidence, which is essential for sustaining competitive advantage. Today, service quality is recognized as one of the most important topics in the field of service management and marketing, and the word quality has become a part of the everyday vocabulary of management (Gronroos, 1990). Quality has been defined in a variety of ways;
• Fitness for use - meaning that the product meets customer needs and is free of deficiencies (Juran, 1989).
• Satisfying or delighting the customer, or satisfying or exceeding customer expectations (Goetsch, 1994; Zeithaml, et al. 1990).
• The features of a product or service that satisfy stated or implied needs (British Standards Institute, 1991).
• Conformance to clearly specified requirements (Crosby, 1985; Deming, 1986).
These definitions of quality, pertinent to both goods and services, focus either on the features of the product, on the customers’ needs/expectations, or both. Reeves and Bednar (1994) argued that there is no single universal definition of quality, and that different definitions are needed to deal with the concept under different circumstances. The most common definition is the traditional notion that views quality as the customer's perception of service excellence. That is, quality is defined by the customer's impression of the service provided (Berry et al., 1988; Parasuraman et al., 1985). A recent Gallup survey asked more than 1000 consumers to define the elements of “quality service”. The most frequently mentioned items were “aspects of direct human contact – courtesy, positive attitude, and helpfulness” (Hays, 1996). Service quality has been defined in several ways in the literature:
• Zeithaml et al. (1990): “service quality is the extent of discrepancy between customers' expectations or desire and their perceptions".
• Lewis and Booms (1983): “service quality is a measure of how well the service level delivered matches customer expectations on a consistent basis”. • Bitner and Hubbert (1994): “service quality is the consumer's overall
impression of the relative inferiority/superiority of the organization and its services”.
Different researchers focused on different aspects of service quality. Reeves and Bednar (1994) noted that "there is no universal, parsimonious, or all-encompassing definition or model of quality". However, researchers generally have adopted one of two conceptualizations. The first is the “Nordic” perspective (Gronroos 1983), which defines the dimensions of service quality in global terms as consisting of functional and technical quality. Technical quality refers to the outcome of the service performance, and functional quality refers to the subjective perception of how the service is delivered. The second, the “American” perspective (Parasuraman, et al., 1988), uses terms that describe service encounter characteristics (i.e., reliability, responsiveness, empathy, assurances, and tangibles). Nordic perspective defines service quality using categorical terms, whereas American perspective uses descriptive terms. Each perspective highlights important aspects of service quality, but the latter conceptualization dominates the literature (Xie, 2005).
Customers are an increasingly scarce resource pursued by a fast growing number of aggressive suppliers. Providing quality that satisfies customer needs creates a competitive advantage by decreasing price elasticity and retaining current customers. There is an increasingly greater need for focusing on long-term relationships between customers and their providers. Therefore, customer satisfaction is central to assessing past performance and predicting future financial success, and there is an urgent need to transcend old ways of doing business and find new ways to efficiently acquire and retain customers in that highly competitive environment (Anderson and Fornell, 1994).
There are a different explanations of customer satisfaction, the most widely used is the one proposed by Oliver (1980) who developed the expectancy disconfirmation theory. According to this theory, customers purchase goods and services with pre-purchase expectations about performance.
Once the product or service has been purchased and used, outcomes are compared against expectations. When outcomes match expectations, confirmation occurs. Disconfirmation occurs when there are differences between expectations and outcomes. Negative disconfirmation occurs when product/service performance is less than expected. Positive disconfirmation occurs when product/service performance is better than expected. Satisfaction is caused by confirmation or positive disconfirmation of customer expectations.
Customer satisfaction can also be defined as satisfaction based on an outcome or a process. It is the end state resulting from the experience of consumption. This end state may be a cognitive state of reward, an emotional response to an experience or a comparison of rewards and costs to the anticipated consequences. Evaluation of satisfaction is made during the service delivery process Vavra (1997).
Customer satisfaction is concerned with a relative judgment, which reflects the benefits and qualities obtained through a purchase (Ostrom and Iacobucci, 1995). It is the buyer's cognitive state of being adequately or inadequately rewarded for the sacrifice he has undergone (Howard and Sheth, 1969). Customer satisfaction is concerned with need fulfillment, pleasure, which come from the experience of purchasing service (Hunt, 1979).
Customer satisfaction is not a universal phenomenon, and not every one gets the same satisfaction out of the same encounter. The reason is that customers have different needs, objectives and past experiences that influence their expectations. For example, a student on a limited budget, a lunch composed of fast food items at a crowded and noisy school cafeteria may be a highly satisfying experience, whereas the same experience may be perceived as totally dissatisfying to an affluent executive discussing a business transaction. The same student may also have different needs and expectations during different meals, or at different times of the day. He may not be highly satisfied when his friends take him out for his birthday celebration meal at the school cafeteria. Therefore, it is important to get a clear picture of the customer needs and objectives that correspond to different kinds of
So, a customer may respond to the same service quality (evaluated objectively) with distinct levels of satisfaction, which can be affected by various factors (Shih, 2006). LeBlanc (1992) concluded that there is no theoretical distinction between satisfaction and service quality. They have similar evaluative concepts and have been used interchangeably as if they are essentially one construct (Iacobucci et al., 1995). Anderson and Fornell (1994) indicated that the literature is not very clear about the distinction between quality and satisfaction, and they stated that satisfaction is a post-consumption experience that compares perceived quality with expected quality, whereas service quality refers to a global evaluation of a firm's service delivery system. The key difference between service quality and customer satisfaction is that quality relates to managerial delivery of the service whereas satisfaction reflects customers' experiences with that service. Quality improvements that are not based on customer needs will not lead to improvements of customer satisfaction (Iacobucci et al. 1995).
Cronin and Taylor (1992) investigated the causal relationship among service quality, customer satisfaction, and purchase intention. They concluded that service quality tends to influence customer satisfaction. Many studies in this field also supported this argument that service quality serves as antecedent of customer satisfaction (Anderson and Fomell, 1994; Brady, 1997; Woodside et al., 1989).
2.1.8.1 Internal Service Quality and Internal Customer Satisfaction
A typical service business has a number of functions involving mutual provision of services. For example, an employee provides services to other co-workers while receiving services from co-workers in individual departments within an organization. Internal service quality is the level at which an employee is satisfied with the services received from these internal service providers (Hallowell et al., 1996). The difference between a poor and good interaction during service delivery impacts the view of a company’s external service level.
In a company, employees provide service to their external customers and also have direct contact and impact their co-workers in the workplace. Some service problems that exist among internal employees may influence the customer-contact employee’s service to the organization’s external customers. Previous researches have mainly focused on external customer service quality rather than on the understanding of internal customer service quality (Marshall, Baker, and Finn, 1998). But today, there is a growing emphasis on internal service quality. Some prominent researchers have asserted that internal service quality is one of the most important but least understood concepts in modern business (Albrecht, 1990; Berry, 1995; Cespedes, 1995). Heskett et al. (1994) proposed a “service-profit” chain that integrates these perspectives into a conceptual model that establishes relationships between internal service quality and employee satisfaction, external service quality and customer satisfaction, and profitability as shown in Figure 2.7. According to this service profit chain concept, improvements in internal service quality also should be expected to result in improved external service quality (Hart, 1995; Heskett et al., 1994). Internal quality of a working environment contributes most to employee satisfaction. Internal service quality is measured by the feelings that employees have toward their jobs, colleagues, and companies. Service organizations need to quantify their investments in people-both customers and employees. The service-profit chain provides the framework for this critical task. (Heskett et al, 1994)
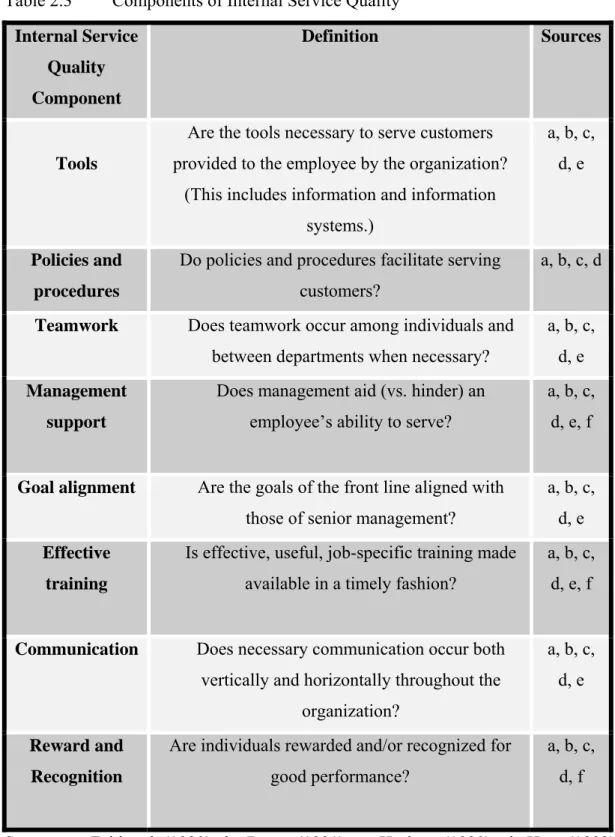
Heskett (1990), Zeithaml (1990), Berry (1991), Hart (1992), Garvin (1988) and Zemke (1989) discussed eight internal service quality components and their effects on employee and internal customer satisfaction as shown in Table 2.3. Their components are tools, policies and procedures, teamwork, management support, goal alignment, effective training, communication, and rewards and recognition. In their study, they also tested the relationship between internal service quality and customer and job satisfaction and showed that both job satisfaction and customer satisfaction are related to the internal service quality.
Table 2.3 Components of Internal Service Quality Internal Service Quality Component Definition Sources Tools
Are the tools necessary to serve customers provided to the employee by the organization?
(This includes information and information systems.)
a, b, c, d, e
Policies and procedures
Do policies and procedures facilitate serving customers?
a, b, c, d
Teamwork Does teamwork occur among individuals and
between departments when necessary?
a, b, c, d, e
Management support
Does management aid (vs. hinder) an employee’s ability to serve?
a, b, c, d, e, f
Goal alignment Are the goals of the front line aligned with
those of senior management?
a, b, c, d, e
Effective training
Is effective, useful, job-specific training made available in a timely fashion?
a, b, c, d, e, f
Communication Does necessary communication occur both
vertically and horizontally throughout the organization?
a, b, c, d, e
Reward and Recognition
Are individuals rewarded and/or recognized for good performance?
a, b, c, d, f
Source: a. Zeithaml (1990), b. Berry (1991), c. Heskett (1990), d. Hart (1992), e. Garvin (1988), f. Zemke (1989)
Heskett's (1990) demonstrated that while the importance of specific internal service-quality components may differ for individual organizations, leading service firms rely on exemplary internal service quality in these eight components to deliver consistently high levels of value to customers. Although these authors approach internal service quality from different perspectives, they share a fundamental underlying belief that organizations attempting to deliver service quality to their external customers must begin by serving the needs of their internal customers (Hallowel et al., 1996). Several studies in the literature have used the concept of service quality to evaluate internal customer satisfaction levels (Stanley and Wisner, 1998, 1999, 2001, 2002; Young and Varble, 1997).
Caruana and Pitt (1997) conducted a study with more than 1,000 marketing directors among the largest service firms in England and developed an internal measure of service quality (INTQUAL) using the SERVQUAL scale developed by Parasurman et al. (1985). INTQUAL can be used by managers to identify the internal service actions within an organization. Caruana and Pitt (1997) also found that the internal service quality can influence an organization’s performance.
Internal service quality was called “the antecedents of service-provider gaps” in Zeithaml et al. (1990) study. Many employees only provide services to other internal employees and rarely or never have a chance to contact the organization’s external customers. But the quality of their service level to other employees does influence the quality of services provided by other customer-contact employees. In 1993, Quality Magazine conducted an extensive survey of satisfaction levels in various types of internal service units. The results showed that the dissatisfaction among internal customers was high, but many internal service units seemed to be unaware of the depth of this discontent. The managers should take internal service quality seriously so that they can find the best way to decrease the gaps while improving performance and satisfying both internal and external customers (Hayes, 1996).
2.1.8.2 External Service Quality and External Customer Satisfaction
A commonly used definition of external service quality is the extent to which a service meets customers’ needs or expectations (Lewis and Mitchell, 1990; Dotchin and Oakland, 1994; Asubonteng et al., 1996; Wisniewski and Donnelly, 1996). It is the difference between customer expectations of service and perceived service. If expectations are greater than performance, then perceived quality is less than satisfactory and hence customer dissatisfaction occurs (Parasuraman et al., 1986; Lewis and Mitchell, 1990). External service quality of a service organization is impacted with the difference between a poor and good interaction during service delivery. Researchers have found many factors of external service quality and developed measurement instruments for service quality from the perspective of customers (George and Gronroos, 1989; Parasuraman, et al., 1985). A widely used instrument to measure customer satisfaction has been the SERVQUAL questionnaire developed by Parasuraman et al. (1986, 1988). It is designed for use in a broad set of service businesses and provides a basic skeleton through its expectations / perceptions format, encompassing statements for each of the five dimensions. This skeleton, when necessary, can be adapted and supplemented to fit the needs of a particular organization. (Parasuraman et al., 1988)
The SERVQUAL instrument has five generic dimensions or factors (Van Iwaarden et al., 2003);
• Tangibles: Service providers’ physical facilities, equipment and appearance of personnel.
• Reliability: Ability to perform the promised service dependably and accurately. • Responsiveness: Willingness to help customers and provide prompt service. • Assurance (including competence, courtesy, credibility and security):
Knowledge and courtesy of employees and their ability to inspire trust and confidence.
• Empathy (including access, communication, understanding the customer): Caring and individualized attention that the firm provides to its customers.
Researchers agree that the SERVQUAL instrument, which is extensively used to assess external service quality, can be modified to assess the quality of the internal service provided by departments and divisions within a company to employees in other departments and divisions. Reynoso and Moore (1995) concluded that the SERVQUAL model developed by Parasuraman et al. (1985) could easily be transferred to an organization’s internal environment by extensive interviews and written surveys.
There are five major gaps in the service quality concept (Parasuraman et al., 1985). A service delivery delights customers by falling above their service level and seen as a superior in quality. But if the perceived quality falls below the adequate service level expected by the customers then quality gaps occur. As seen in Figure 2.8; five potential service quality gaps are;
• Gap 1: The knowledge gap; it occurs when management’s perception of what consumers expect is different from the consumers’ actual expectations.
• Gap 2: The standards gap; it refers to the discrepancy that can occur between management’s perception of what customers expect and the quality standards established for service delivery.
• Gap 3: The delivery gap; the difference between specified delivery standards and the service providers’ actual performance.
• Gap 4: The internal communications gap; it occurs when there is a difference between the service delivered and the service promised through the firm’s external communications with customers.
• Gap 5: The service gap; the difference between what customers expect to receive and their perceptions of the service that is actually delivered.
The presence of any one of these five quality gaps can lead to a disappointing outcome that damages relationships with customer. (Lovelock and Wright, 2002)
Figure 2.8 Service-Quality Model Perceived Service Expected Service CUSTOMER COMPANY Gap 5 Gap 1 Gap 2 Gap 3 Gap 4 World-of mouth
communications Personal Needs
Past Experience
Service Delivery (including pre- and
post contacts) External communications to consumers Translation of perceptions into service-quality specifications Management perceptions of consumer expectations
Source: Parasuraman, A., Zeithaml, V. A., and Berry, L. L. (1985). A Conceptual Model of Service Quality and its İmplications for Future Research, Journal of Marketing, Vol. 49, No.4 , pp. 41-50
External customer satisfaction is largely influenced by the value of services provided to customers. In the other words, external service quality drives customer satisfaction. Customers today are strongly value oriented. Value means the results that they receive in relation to the total costs (both the price and other costs to customers incurred in acquiring the service). The insurance company, Progressive Corporation, is creating just this kind of value for its customers by processing and paying claims quickly and with little policyholder effort.