LABOR MARKET RETURNS TO NORMAL
Seyfettin Gürsel*, Gökçe Uysal and Ayşenur Acar
Executive Summary
According to the labor market statistics released by TurkStat, non-agricultural employment increased by 1 million 43 thousand on a year-on-year basis, while non-agricultural unemployment rate decreased from 14.9 percent to 12.5 percent. Seasonally adjusted labor market data show that non-agricultural labor force reached 17 million 808 thousand and non-agricultural unemployment rate did not change much (12.9 percent) compared to the period of March 2011. Both the labor force and non-agricultural employment increased considerably in this period. Hence, unemployment rate increased only slightly. Developments in service sector induced to increase in non-agricultural employment.
Increase in non-agricultural employment is parallel to the strong economic growth
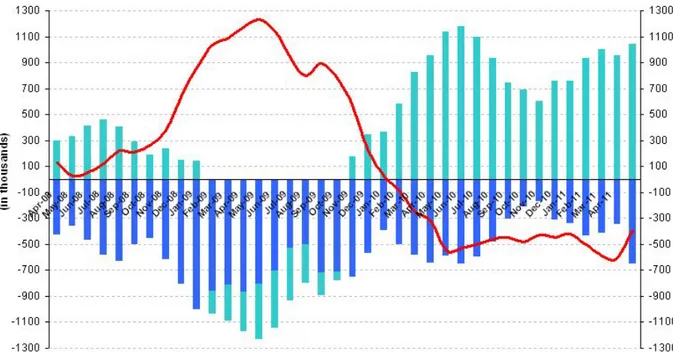
According to the labor market statistics released by TurkStat on the 15th of July, employment has reached 23 million 955 thousand in the period of April 2011 (March- April- May) while non-agricultural employment reached 17 million 925 thousand. Raw labor market statistics reveal that non-agricultural labor force increased by 648 thousand (3.3 percent) and non-agricultural employment increased by 1 million 43 thousand (6.2 percent) in April 2011. On the other hand, non-agricultural unemployment rate decreased from 14.9 percent to 12.5 percent during the same period (Figure 1).
Figure 1 Year-on-year changes in non-agricultural labor force, employment and unemployment
Source: TurkStat, Betam
* Prof. Seyfettin Gürsel, Betam, Director, [email protected]
Assoc. Prof. Gökçe Uysal, Betam, Vice Director, gokce.uysal @bahcesehir.edu.tr
Aysenur Acar, Betam, Research Assistant, [email protected]
Research Brief 11/119
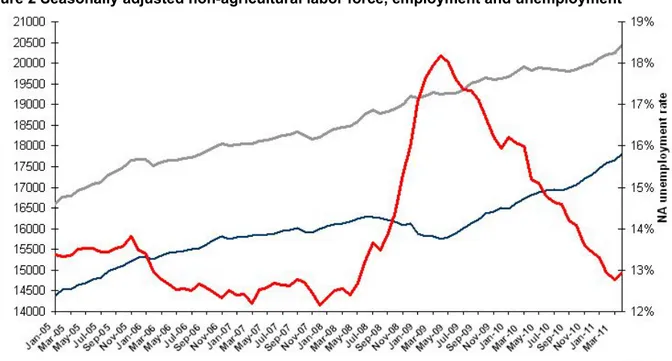
According to seasonally adjusted series, non-agricultural labor force increased by 198 thousand in April compared to its level in March and reached 20 million 451 thousand. On the other hand, non-agricultural employment increased by 143 thousand to reach 17 million 808 thousand. Consequently, non-agricultural unemployment decreased by 55 thousand and non-agricultural unemployment rate increased to 12.9 percent (Figure 2). Increase in agricultural employment was not enough to cover the increase in non-agricultural labor force. In the past six months, non-non-agricultural labor force had been increasing slower, however during this period, it picked up again and increased by approximately 600 thousand on a year-on-year basis.
Figure 2 Seasonally adjusted non-agricultural labor force, employment and unemployment
Source: TurkStat, Betam
Kariyer.net data signals a slow down in unemployment decrease
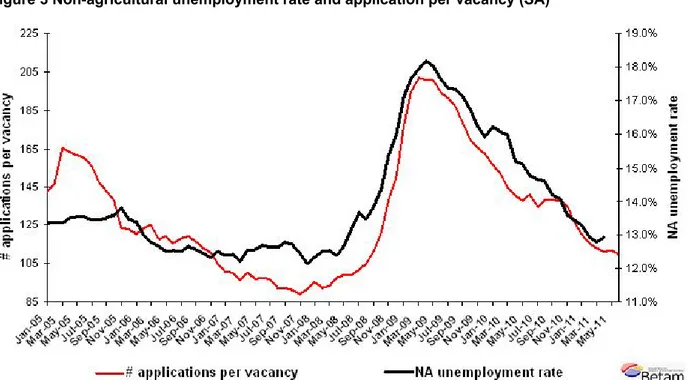
Starting from April, Betam will be using a new series released by Kariyer.net on application per vacancy. Kariyer.net collects this data via their website which is one of the largest job search engines in Turkey.1 Given the lack of data on vacancies in Turkey, we believe that this new series will provide useful insight to the labor market in Turkey. It provides information on the number of unemployed who are actively seeking work as well as the number of jobs that are available in the labor market. A decrease in applications per vacancy may be caused by an increase in vacancies or by a decrease in the number of applications. An increase in vacancies signals economic growth while decreasing number of applications indicates a decrease in number of people looking for a job. Figure 3 illustrates the seasonally adjusted non-agricultural unemployment rate and deseasonalized calendar day adjusted application per vacancy (Kariyer.net) series. It is clear that these series are highly correlated (almost 90 percent).
The application per vacancy series which had been stagnant in April and May remained so in June as well. Hence, the increase in non-agricultural unemployment rate may continue in upcoming the months (May 2011).
1Application per vacancy= Total number of applications/ Total number of vacancies. Both series are seasonally and calendar day
Figure 3 Non-agricultural unemployment rate and application per vacancy (SA)
Data source: Kariyer.net, TurkStat, Betam
Slow down in manufacturing employment, increase in service sector employment
According to the seasonally adjusted figures, manufacturing employment increased only by 16 thousand in April 2011 (App. 1 Table 2, App. 2 Figure 4).2 The slow down is parallel to decrease in the industrial production index. During this period, employment in the service sector increased 97 thousand is the main source of increase in non-agricultural employment. On the other hand, agricultural employment
decreased 97 thousand, which is the first decrease observed for the period of July 2010.
2 Seasonal adjustment procedure is applied to each sector of employment series separately. Hence the sum of these series may
differ from the seasonally adjusted series of total employment. The difference stems from the non-linearity of the seasonal adjustment process.
Appendix 1: Table 1 Seasonally adjusted non-agricultural labor force indicators (in thousands)
Labor force Employment Unemployment Unemployment rate Monthly changes
March-08 18448 16133 2315 12.5% Labor force Employment Unemployment
April-08 18468 16178 2290 12.4% 20 45 -25 May-08 18590 16237 2354 12.7% 122 59 63 June-08 18754 16279 2475 13.2% 164 43 121 July-08 18863 16287 2577 13.7% 109 7 102 August-08 18785 16251 2534 13.5% -79 -36 -43 September-08 18827 16216 2611 13.9% 43 -35 77 October-08 18889 16175 2714 14.4% 62 -41 103 November-08 19006 16088 2918 15.4% 117 -87 204 December-08 19211 16134 3077 16.0% 205 46 159 January-09 19172 15893 3279 17.1% -39 -242 202 February-09 19212 15824 3388 17.6% 40 -69 109 March-09 19286 15822 3463 18.0% 74 -1 75 April-09 19256 15757 3499 18.2% -29 -65 36 May-09 19271 15796 3474 18.0% 14 39 -25 June-09 19282 15884 3399 17.6% 12 88 -76 July-09 19369 16006 3363 17.4% 87 122 -35 August-09 19512 16128 3384 17.3% 142 122 21 September-09 19562 16213 3348 17.1% 50 85 -36 October-09 19657 16375 3282 16.7% 95 162 -67 November-09 19599 16422 3177 16.2% -58 47 -105 December-09 19627 16499 3127 15.9% 28 77 -49 January-10 19680 16488 3191 16.2% 53 -11 64 February-10 19787 16608 3179 16.1% 107 120 -13 March-10 19904 16723 3182 16.0% 117 114 3 April-10 19819 16808 3012 15.2% -85 85 -170 May-10 19885 16884 3001 15.1% 66 76 -10 June-10 19860 16923 2936 14.8% -26 39 -65 July-10 19842 16937 2905 14.6% -17 14 -31 August-10 19821 16930 2891 14.6% -22 -7 -15 September-10 19797 16987 2810 14.2% -24 57 -81 October-10 19849 17056 2793 14.1% 52 69 -17 November-10 19932 17223 2709 13.6% 83 167 -84 December-10 19984 17300 2684 13.4% 52 77 -25 January-11 20121 17445 2676 13.3% 138 145 -8 February-11 20202 17590 2612 12.9% 81 145 -65 March-11 20253 17665 2588 12.8% 51 75 -24 April-11 20451 17808 2643 12.9% 198 143 55
Appendix 1: Table 2 Seasonally adjusted sector of employment (in thousands)
Agriculture Manufacturing Construction Service Monthly changes
March-08 4923 4483 1249 10410 Agriculture Manufacturing Construction Service
April-08 5100 4457 1256 10453 177 -25 7 43 May-08 5064 4497 1267 10484 -36 39 10 31 June-08 5002 4502 1255 10543 -62 5 -12 59 July-08 4977 4483 1231 10600 -25 -18 -24 57 August-08 5090 4469 1221 10568 112 -14 -9 -32 September-08 5100 4457 1235 10524 11 -12 14 -44 October-08 5191 4392 1245 10519 91 -65 10 -5 November-08 5119 4286 1207 10556 -72 -106 -38 38 December-08 4961 4247 1222 10642 -159 -39 15 86 January-09 4978 4136 1248 10545 18 -111 26 -97 February-09 5011 4110 1255 10486 33 -25 7 -59 March-09 4990 4028 1260 10546 -22 -82 5 60 April-09 5013 3988 1227 10518 23 -39 -33 -27 May-09 5145 3968 1262 10566 132 -20 34 47 June-09 5245 3964 1291 10632 101 -4 29 66 July-09 5334 4028 1306 10687 89 63 16 55 August-09 5323 4034 1320 10738 -11 6 13 51 September-09 5404 4110 1320 10731 81 76 0 -7 October-09 5464 4145 1363 10823 60 35 44 91 November-09 5513 4200 1383 10823 49 55 19 0 December-09 5562 4288 1394 10811 49 88 11 -12 January-10 5662 4337 1374 10808 100 49 -20 -3 February-10 5643 4402 1365 10891 -19 64 -9 83 March-10 5609 4379 1411 10987 -34 -22 46 96 April-10 5679 4438 1439 10976 70 58 29 -10 May-10 5584 4502 1428 11021 -95 64 -11 45 June-10 5697 4526 1432 11014 113 24 3 -8 July-10 5674 4539 1467 10954 -23 14 35 -60 August-10 5680 4463 1427 10961 6 -76 -40 7 September-10 5685 4432 1430 11008 5 -31 3 47 October-10 5823 4422 1450 11066 138 -10 19 58 November-10 5870 4605 1506 11066 47 183 56 0 December-10 6008 4630 1538 11098 138 25 32 32 January-11 6015 4713 1526 11217 7 83 -12 118 February-11 6156 4746 1570 11330 140 33 44 114 March-11 6182 4868 1588 11272 27 122 18 -58 Nisan 11 6091 4884 1632 11369 -91 16 44 97
Appendix 2: Figure 4 Employment changes in sectors (in thousand)3
Source: TurkStat, Betam