CMS-SMP-17-003
Event shape variables measured using multijet final states
in proton-proton collisions at
√
s
=
13 TeV
The CMS Collaboration
∗Abstract
The study of global event shape variables can provide sensitive tests of predictions for multijet production in proton-proton collisions. This paper presents a study of several event shape variables calculated using jet four momenta in proton-proton collisions at a centre-of-mass energy of 13 TeV and uses data recorded with the CMS detector at the LHC corresponding to an integrated luminosity of 2.2 fb−1. After correcting for detector effects, the resulting distributions are compared with several theoretical predictions. The agreement generally improves as the energy, represented by the average transverse momentum of the two leading jets, increases.
Published in the Journal of High Energy Physics as doi:10.1007/JHEP12(2018)117.
numbers of jets, angular distributions, etc., to deepen the understanding of quantum chromo-dynamics (QCD). While the production of quarks and gluons with large transverse momentum (pT) is well described by calculations based on perturbative QCD, the hadronization process probes energy scales where perturbative calculations are not applicable. Instead, phenomeno-logical models inspired by QCD are used to predict the experimental results.
Event shape variables (ESVs) are sensitive to the flow of energy in hadronic final states. These variables are safe from collinear and infrared divergences and have reduced experimental un-certainties [1]. Some distributions of ESVs are sensitive to the details of the hadronization process [2–4], so they can be used to tune parameters of Monte Carlo (MC) event generators, determine the strong coupling αS[5–7], and to search for new physics phenomena [8–10]. Various ESVs have been studied in electron-positron collisions at the CERN LEP collider to de-termine αS [11–15]. ESVs have also been studied in electron-proton collisions at the DESY HERA collider [16] and in proton-antiproton collisions at the FNAL Tevatron collider [17], where they were compared with next-to-leading-order (NLO) calculations and with various tunes of the PYTHIA6 event generator [18]. At the CERN LHC collider studies by the ALICE, ATLAS, and CMS Collaborations have exploited proton-proton collisions at centre-of-mass en-ergies of√s=0.9, 2.76, and 7 TeV to evaluate ESVs [19–26].
This paper reports a measurement of ESVs by the CMS Collaboration using hadronic jets in pp collisions at√s = 13 TeV corresponding to an integrated luminosity (Lint) of 2.2 fb−1. The following variables are studied: the complement of transverse thrust, total jet broadening, total jet mass, and total transverse jet mass. The theoretical uncertainties in the predictions of these ESVs can be reduced by careful choice of the quantity used to classify the energy scale of the events. Following Ref. [4], we use HT,2 = (pT,jet1+pT,jet2)/2, where pT,jet1and pT,jet2refer to the transverse momenta of the highest and second highest pT jets.The measured distributions are corrected for detector effects and compared with the predictions of QCD models implemented in thePYTHIA8 [27], MADGRAPH5 aMC@NLO+PYTHIA8 [28], andHERWIG++ [29] event gener-ators.
The paper is organized as follows. The ESVs are discussed in Section 2. After briefly describing the elements of the CMS detector in Section 3, the jet reconstruction relevant to this analysis is described in Section 4. The data sample and event selection criteria are described in Section 5. Sections 6 and 7 present the unfolding technique and the systematic uncertainties, respectively. Section 8 contains comparisons between CMS data and theoretical predictions, and the results are summarized in Section 9.
2
Event shape variables
The four ESVs studied in this analysis are defined using the four-momenta of hadronic jets. The complement of transverse thrust: The complement of thrust is defined as:
T,i
thrust direction ˆnT is the unit vector that maximizes the projection and defines the transverse thrust axis. The τ⊥is zero for a perfectly balanced two-jet event and is 1−2/π for an isotropic multijet event.
Total jet broadening: For each event, the transverse thrust axis is used to divide the event into upper (U) and lower (L) regions. The jets in U satisfy~pT,i. ˆnT>0 and those in L have~pT,i. ˆnT <0. For these two regions, the pT-weighted pseudorapidities and azimuthal angles are
ηX ≡ ∑i∈X pT,iηi ∑i∈XpT,i , φX≡ ∑i∈X pT,iφi ∑i∈XpT,i , (3)
where X refers to the U or L regions. The jet broadening variable in each region is defined as BX≡ 1 2 PT i∈X
∑
pT,i q (ηi−ηX)2+ (φi−φX)2, (4)where PTis the scalar pTsum of all the jets in the event. The total jet broadening is then defined as
BTot≡BU+BL. (5)
Total jet mass: The normalized squared invariant mass of the jets in the U and L regions of the event is defined by
ρX ≡ M2X
P2 , (6)
where MX is the invariant mass of the jets in the region X, and P is the scalar sum of the mo-menta of all central jets. The total jet mass is defined as the sum of the masses in the U and L regions,
ρTot≡ρU+ρL. (7) Total transverse jet mass: The quantity corresponding to ρTot in the transverse plane, the total transverse jet mass (ρTTot), is similarly calculated using~pT,iof jets.
These four ESVs probe different aspects of QCD [2] and are designed to have higher values for multijet, spherical events and lower values for back-to-back dijet events. While τ⊥ is sen-sitive to the hard-scattering process, the jet masses and jet broadening depend more on the nonperturbative aspects of QCD, responsible for hadronisation process.
3
The CMS detector
The central feature of the CMS apparatus is a superconducting solenoid of 6 m internal diam-eter, providing a magnetic field of 3.8 T. The solenoid volume holds a silicon pixel and strip tracker, a lead tungstate crystal electromagnetic calorimeter (ECAL), and a brass and scintilla-tor hadron calorimeter (HCAL), each composed of a barrel and two endcap sections. Steel and quartz-fibre Cherenkov hadron forward calorimeters extend the pseudorapidity (η) coverage provided by the barrel and endcap detectors to the region 3.0< |η| <5.2. Muons are measured
contain fewer crystals. CMS uses a two stage online trigger to select events for offline analysis. In the first stage, a hardware-based level-1 (L1) trigger uses information from calorimeter and muon subsystems and selects event at a rate of about 100 kHz. In the second stage, a software-based high-level trigger (HLT), running on computer farms, uses full event information and reduces the event rate to about 1 KHz before data storage. A more detailed description of the CMS detector can be found in Ref. [30].
4
Jet reconstruction
The particle-flow (PF) event algorithm [31] reconstructs photons, electrons, charged and neutral hadrons, and muons with an optimised combination of information from the various elements of the CMS detector. The energy of a photon is directly obtained from the ECAL measurement. The energy of an electron is determined from a combination of the electron momentum at the primary interaction vertex as determined by the tracker, the energy of the corresponding ECAL cluster, and the energy sum of all bremsstrahlung photons spatially compatible with originat-ing from the electron track. The momentum of a muon is obtained from the curvature of the corresponding track. The energy of a charged hadron is determined from a combination of its momentum measured in the tracker and the matching ECAL and HCAL energy deposits, cor-rected for zero-suppression effects and for the response function of the calorimeters to hadronic showers. Finally, the energy of a neutral hadron is obtained from the corresponding energy de-posits in ECAL and HCAL.
Jets are reconstructed from photons, electrons, charged and neutral hadrons, and muons using the anti-kTclustering algorithm [32, 33] with a distance parameter R = 0.4. Measurement of jet energy is affected by contamination from additional pp interactions in the same bunch crossing (pileup), as well as by the nonuniform and nonlinear response of the CMS calorimeters. The technique of charged-hadron subtraction [31] is used to reduce the contribution of particles that originate from pileup interactions to the jet energy measurement. The jet four-momentum is corrected for the difference observed in simulation between jets built from reconstructed particles and generator-level particles. The jet mass and direction are kept constant for the corrections, which are functions of the η and pTof the jet, as well as the energy density and jet area quantities defined in Ref. [34]. The latter are used to correct the energy offset introduced by the pileup interactions. The energy of the jets is further corrected using dijet, Z+jet, and
γ+jet events, where the pT-balance of the event is exploited. The jet energy resolution typically amounts to 15% at 10 GeV, 8% at 100 GeV, and 4% at 1 TeV.
5
Data set and event selection
5.1 Collision data
This analysis uses pp collision data collected in 2015 at√s = 13 TeV, corresponding toLint = 2.2 fb−1. Events are selected at L1 and HLT that have jet pT or HT,2 thresholds, respectively, as
R⊥,k= T,jet1 T,jet2 T,jetk |~pT,jet1| + |~pT,jet2| + |~pT,jetk|
.
The data sample is divided into eight HT,2 ranges such that the uncertainty due to the trigger inefficiency is negligible. The ranges (in GeV) are: 73–93, 93–165, 165–225, 225–298, 298–365, 365–452, 452–557 and>557, as shown in Table 1, with the number of events in each range. Table 1: L1 trigger thresholds, HLT thresholds, HT,2 range and number of events used in the analysis.
L1 threshold for HLT threshold for HT,2range Number of pT,jet(GeV) HT,2(GeV) (GeV) events
ZeroBias 60 73–93 222 184 52 80 93–165 36 452 92 140 165–225 81 932 128 200 225–298 363 294 128 or 176 260 298–365 134 320 128 or 176 320 365–452 354 140 128 or 176 400 452–557 443 361 128 or 176 500 >557 295 578 5.2 Simulated events
Events are simulated using PYTHIA v8.212, MADGRAPH5 aMC@NLO V5 2.2.2+PYTHIA8, and
HERWIG++ v2.7.1. The NNPDF3.0 [35] parton distribution function (PDF) set is used. The
PYTHIA8 andHERWIG++ event generators use leading order 2→2 matrix element (ME)
calcu-lations and parton shower (PS) for generation of multijet topologies. ThePYTHIA8 event
gener-ator uses a pT-ordered PS, and the underlying event description is based on the multiple parton interaction (MPI) model. Events are generated with twoPYTHIA8 tunes: CUETP8M1 [36] and Monash [37]. Minimum bias data collected by the CMS experiment were used to derive the
PYTHIA8 CUETP8M1 tune, which is based on the Monash tune. The MADGRAPH5 aMC@NLO
generator uses ME calculations to generate hard-scattering events with two to four partons and
PYTHIA8 CUETP8M1 for subsequent fragmentation and hadronization. The MLM [38]
match-ing procedure is used to avoid double countmatch-ing of jets between the ME calculation and the PS description. The HERWIG++ generator uses an angular-ordered PS. For simulated events,
particle-level jets are obtained by applying the anti-kT clustering algorithm to all generated stable particles, excluding neutrinos, with R=0.4.
The simulation events are passed through a complete and detailed reconstruction in the CMS detector using the same reconstruction as the collision events.
6
Unfolding of distributions
A reconstructed collision event differs from the true event because of finite resolution of the detector, detector acceptances, and uncertainties and efficiencies of measurement. Hence, the
selection chain are used to construct the response matrix for an ESV, which relates its particle-level distribution with that at detector particle-level. The response matrix incorporates all the experi-mental effects and is subsequently used as input for the unfolding of the observed distribution in data. Some events that satisfy the selection criteria at the particle level might not at the detec-tor level, leading to an inefficiency. The reverse may also happen, leading to misidentification. Further, an event may migrate from one HT,2 range to another. The corresponding efficiency and misidentification rates are also incorporated in the unfolding process, and they contribute to the related uncertainty of the unfolding process.
To investigate possible bias due to the choice of an MC generator to construct the response matrices, we generate event samples from three different generators: PYTHIA8 CUETP8M1, MADGRAPH5 aMC@NLO, andHERWIG++. Each detector level distribution is unfolded using these three response matrices and the corresponding particle-level distributions are compared. No evidence for significant bias is observed.
Two different methods, which are implemented in RooUnfold [39], are used for unfolding the observed distributions: D’Agostini iteration with early stopping [40], and Singular Value De-composition (SVD) [41]. The difference between the unfolded distributions produced with these two methods is much smaller than 1%. Our unfolding is done using the D’Agostini iter-ation andPYTHIA8 CUETP8M1 is used for constructing the response matrix. The SVD method is used as a cross-check.
7
Systematic uncertainties
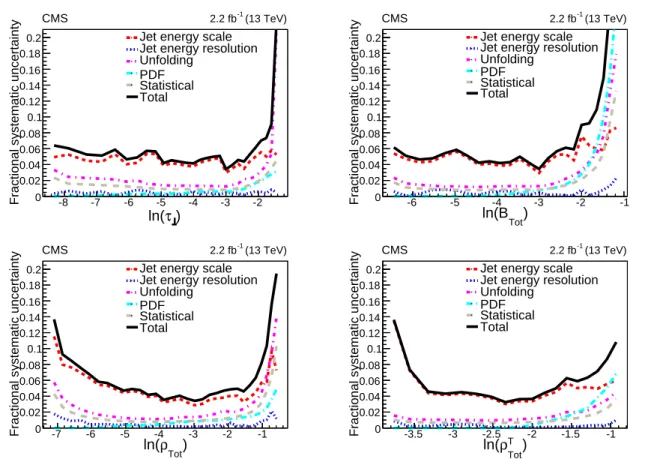
There are multiple sources of uncertainties in the unfolding process, and the contributions from each individual source are added in quadrature to obtain the total uncertainty. Figure 1 shows the total uncertainty and the contributions from various sources as a function of each ESV for the specific range 225< HT,2<298 GeV.
• Jet energy scale (JES): CMS considers 26 different sources of uncertainties in the JES [42]. To estimate the effect of each source, the four-momentum of each jet is scaled up and down by the corresponding uncertainty, the ESV is calculated, and the response ma-trix obtained with the nominal JES is used to unfold the distributions obtained with the nominal, scaled up, and scaled down JES values. For each bin of the unfolded distribution, the larger of the differences between the nominal, and the varied ones is taken as the systematic uncertainty. The systematic uncertainties due to different sources are then added in quadrature. For most bins in the distribution of an ESV, the uncertainty is 4–6%. However, it reaches about 12% for the highest and lowest bins of ρTot, lowest bins of ρTTot, and about 8% for the highest bins of BTot. Typically JES is the largest source of systematic uncertainty in the ESVs.
• Jet energy resolution (JER): The JER is obtained from the ratio of pT of the two jets in dijet events as a function of pTand η [42]. It has been observed that the JER is worse in data compared to simulation. Hence, extra smearing is applied to the simulated events, and different response matrices are constructed. The detector-level
distribu-GRAPH5 aMC@NLO sample using PYTHIA8 CUETP8M1 and HERWIG++ response matrices, and for the HERWIG++ sample using PYTHIA8 CUETP8M1 and MAD -GRAPH5 aMC@NLOresponse matrices. Out of these six differences for each bin, the largest is taken as the systematic uncertainty. In the closure tests of the individual response matrices, if, for a particular bin, the difference in the unfolded and gener-ated values is larger than the uncertainty already assigned, the larger one is taken as the uncertainty due to the unfolding for that bin. The bias inherent in the DAgostini method is estimated by using different generators. The difference in the unfolded results is included as an unfolding uncertainty. The uncertainty due to unfolding is of the order of 2%, except for a few lowest, and highest bins where it dominates the total uncertainty.
• Parton distribution function: The uncertainty due to the PDFs in the particle-level dis-tribution of an ESV is estimated using the 100 sets of NNPDF3.0 replicas. The stan-dard deviation of the 100 values thus obtained for a bin is taken as the uncertainty due to PDFs for that bin. For most bins, the uncertainty due to the PDFs is less than 1%, but increases for higher values of the variables. For BTotthe uncertainty due to the PDFs increases very rapidly (>20%) and dominates for the last few bins.
The contribution of other sources of systematic uncertainty, i.e., pileup, and trigger efficiency are negligible.
8
Results
The modelling of initial-state radiation (ISR), final-state radiation (FSR) of gluons, and MPI
in PYTHIA8 CUETP8M1 is tested by studying each aspect individually, via the comparison of
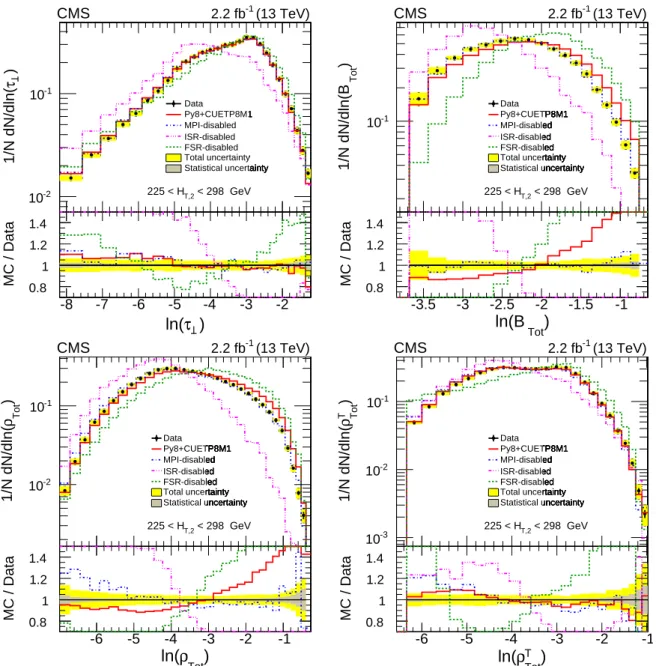
simulated ESV distributions with data, as shown in Figure 2. This study shows that the effect of disabling ISR results in a very large shift of the ESVs to lower values, i.e., reducing the spherical nature of the multijet events. The effect of disabling the FSR is small compared to the ISR, and the effect of MPI is even smaller.
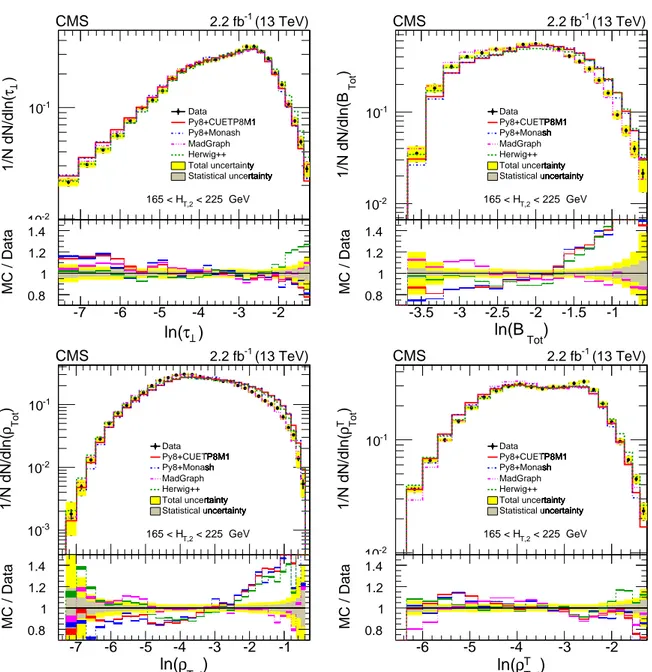
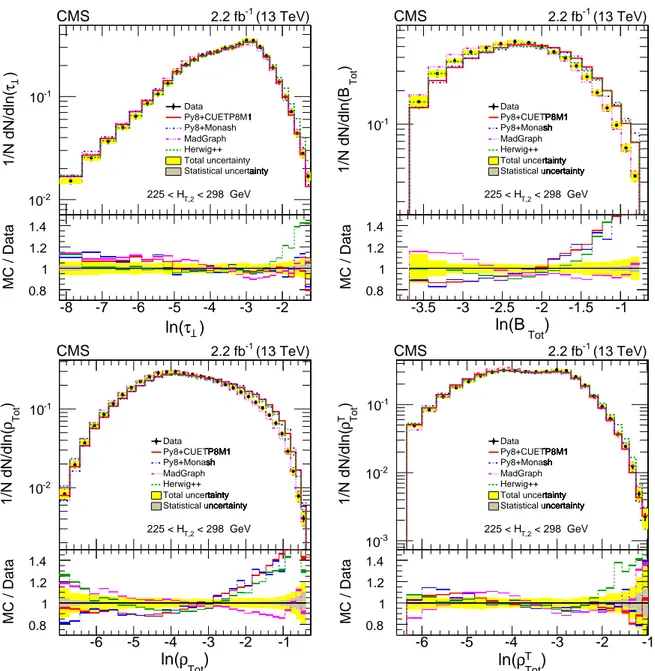
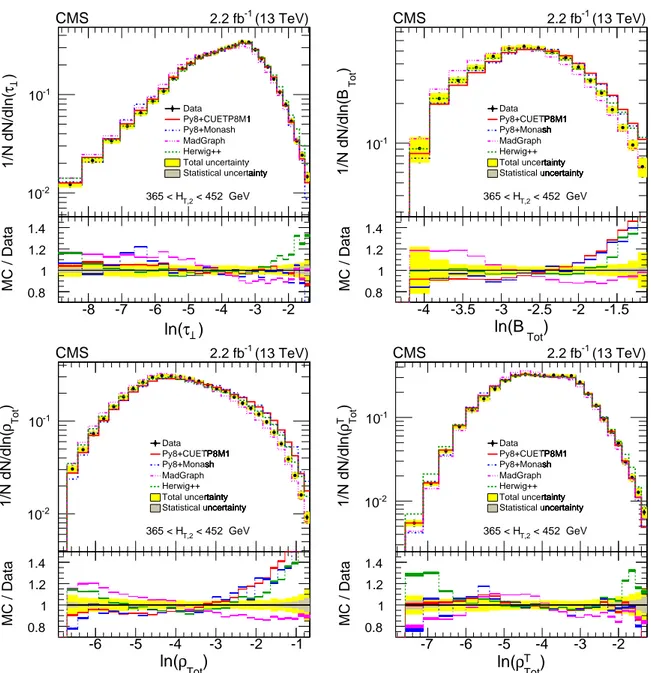
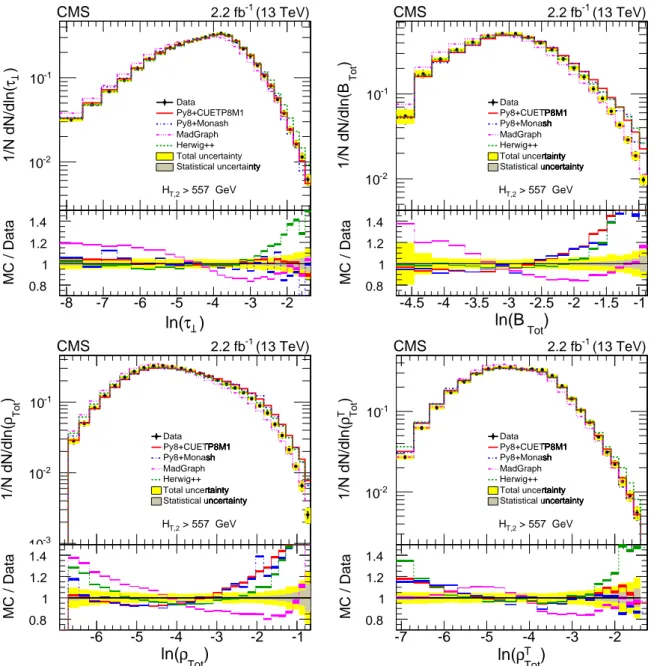
The unfolded distributions for the ESVs obtained from data are compared with the particle-level predictions of various MC generators, as shown in Figures 3–10 for various HT,2 ranges. Comparisons are made to the central predictions of the event generators only. Each figure presents the variables τ⊥(upper left), BTot(upper right), ρTot(lower left), and ρTTot(lower right) for a range of HT,2. The ratios of individual MC predictions to that of data are shown in the lower panel of each plot.
The MPI parameters in the PYTHIA8 Monash and CUETP8M1 tunes are very similar. The
predictions of these two tunes agree well for the four ESVs studied. In general, the agreement between them improves with increasing HT,2. Both tunes show good agreement with data for the τ⊥ and ρTTotvariables, except for the two lowest ranges of HT,2, and both overestimate the multijet contribution to ρTotand BTot. We note that τ⊥and ρTTotvariables are evaluated in the transverse plane, whereas BTotand ρTotare evaluated using both longitudinal and transverse components of the jets. This indicates that the treatment of the energy flow in the transverse plane is modelled well in the Monash and CUETP8M1 tunes ofPYTHIA8, whereas the energy
) τ ln(
-8 -7 -6 -5 -4 -3 -2
Fractional systematic uncertainty 0 0.02 0.04 0.06 0.08 0.1 0.12 ) Tot ln(B -6 -5 -4 -3 -2 -1
Fractional systematic uncertainty 0 0.02 0.04 0.06 0.08 0.1 0.12 (13 TeV) -1 2.2 fb CMS ) Tot ρ ln( -7 -6 -5 -4 -3 -2 -1
Fractional systematic uncertainty 0
0.02 0.04 0.06 0.08 0.1 0.12 0.14 0.16 0.18
0.2 Jet energy scale Jet energy resolution Unfolding PDF Statistical Total (13 TeV) -1 2.2 fb CMS ) Tot T ρ ln( -3.5 -3 -2.5 -2 -1.5 -1
Fractional systematic uncertainty 0
0.02 0.04 0.06 0.08 0.1 0.12 0.14 0.16 0.18
0.2 Jet energy scale Jet energy resolution Unfolding
PDF Statistical Total
Figure 1: Total uncertainty (black line) for the four event shape variables: the complement of transverse thrust (τ⊥) (upper left), total jet broadening (BTot) (upper right), total jet mass (ρTot) (lower left) and total transverse jet mass (ρTTot) (lower right) evaluated with jets for 225 <HT,2 < 298 GeV. The contributions from different sources are also shown in each plot: JES (red dashed line), JER (blue dotted line), unfolding (pink dash-dotted line), PDF (light-blue dash-dotted line) and statistics (grey dashed line).
flow out of the transverse plane is not.
The HERWIG++ generator shows good agreement with data for all four ESVs studied, and
it is better than the CUETP8M1 and Monash tunes of PYTHIA8 in predicting ρTot and BTot. This implies its better treatment of energy flow out of the transverse plane. Although both
PYTHIA8 and HERWIG++ use a PS approach to generate multijet events and hadronization,
the former uses string fragmentation and a pT-ordered shower, whereas the latter uses cluster fragmentation and angular-ordered shower.
The MADGRAPH5 aMC@NLOgenerator shows good agreement with data for τ⊥ and ρTTotand its agreement with data for ρTot and BTot is much better compared to the CUETP8M1 and Monash tunes ofPYTHIA8. The ME approach for generating multiparton hard scattering
pro-cesses models the transverse as well as longitudinal flows of energy better than PYTHIA8. The following features emerge from the comparison plots of the four ESVs.. Agreement be-tween data and benchmark event generators improves with HT,2. Figure 11 shows the evolu-tion of the mean value of each ESV with HT,2and confirms the above observations. With higher HT,2, the initial partons are more boosted, and hence the event tends to be less spherical. Also,
mul-bayes -8 -7 -6 -5 -4 -3 -2 ) τ 1/N dN/dln( -2 10 -1 10 Data Py8+CUETP8M1 MPI-disabled ISR-disabled FSR-disabled Total uncertainty Statistical uncertainty Data Py8+CUETP8M1 MPI-disabled ISR-disabled FSR-disabled Total uncertainty Statistical uncertainty Data Py8+CUETP8M1 MPI-disabled ISR-disabled FSR-disabled Total uncertainty Statistical uncertainty Data Py8+CUETP8M1 MPI-disabled ISR-disabled FSR-disabled Total uncertainty Statistical uncertainty < 298 GeV T,2 225 < H Data Py8+CUETP8M1 MPI-disabled ISR-disabled FSR-disabled Total uncertainty Statistical uncertainty ) τ ln( -8 -7 -6 -5 -4 -3 -2 MC / Data 0.8 1 1.2 1.4 (13 TeV) -1 2.2 fb CMS bayes -3.5 -3 -2.5 -2 -1.5 -1 ) Tot 1/N dN/dln(B -1 10 Data Py8+CUETP8M1 MPI-disabled ISR-disabled FSR-disabled Total uncertainty Statistical uncertainty Data Py8+CUETP8M1 MPI-disabled ISR-disabled FSR-disabled Total uncertainty Statistical uncertainty Data Py8+CUETP8M1 MPI-disabled ISR-disabled FSR-disabled Total uncertainty Statistical uncertainty Data Py8+CUETP8M1 MPI-disabled ISR-disabled FSR-disabled Total uncertainty Statistical uncertainty < 298 GeV T,2 225 < H Data Py8+CUETP8M1 MPI-disabled ISR-disabled FSR-disabled Total uncertainty Statistical uncertainty ) Tot ln(B -3.5 -3 -2.5 -2 -1.5 -1 MC / Data 0.8 1 1.2 1.4 (13 TeV) -1 2.2 fb CMS bayes -6 -5 -4 -3 -2 -1 ) Tot ρ 1/N dN/dln( -2 10 -1 10 Data Py8+CUETP8M1 MPI-disabled ISR-disabled FSR-disabled Total uncertainty Statistical uncertainty Data Py8+CUETP8M1 MPI-disabled ISR-disabled FSR-disabled Total uncertainty Statistical uncertainty Data Py8+CUETP8M1 MPI-disabled ISR-disabled FSR-disabled Total uncertainty Statistical uncertainty Data Py8+CUETP8M1 MPI-disabled ISR-disabled FSR-disabled Total uncertainty Statistical uncertainty < 298 GeV T,2 225 < H Data Py8+CUETP8M1 MPI-disabled ISR-disabled FSR-disabled Total uncertainty Statistical uncertainty ) Tot ρ ln( -6 -5 -4 -3 -2 -1 MC / Data 0.8 1 1.2 1.4 (13 TeV) -1 2.2 fb CMS bayes -6 -5 -4 -3 -2 -1 ) Tot T ρ 1/N dN/dln( -3 10 -2 10 -1 10 Data Py8+CUETP8M1 MPI-disabled ISR-disabled FSR-disabled Total uncertainty Statistical uncertainty Data Py8+CUETP8M1 MPI-disabled ISR-disabled FSR-disabled Total uncertainty Statistical uncertainty Data Py8+CUETP8M1 MPI-disabled ISR-disabled FSR-disabled Total uncertainty Statistical uncertainty Data Py8+CUETP8M1 MPI-disabled ISR-disabled FSR-disabled Total uncertainty Statistical uncertainty < 298 GeV T,2 225 < H Data Py8+CUETP8M1 MPI-disabled ISR-disabled FSR-disabled Total uncertainty Statistical uncertainty ) Tot T ρ ln( -6 -5 -4 -3 -2 -1 MC / Data 0.8 1 1.2 1.4 (13 TeV) -1 2.2 fb CMS
Figure 2: The effects of MPI, ISR, and FSR in PYTHIA8 CUETP8M1 on τ⊥ (upper left), BTot (upper right), ρTot(lower left) and ρTTot(lower right) for a typical range 225 < HT,2 < 298 GeV. The ratio plots for simulation (MC) with respect to data are shown in the lower panel of each plot. The inner gray band represents the statistical uncertainty and the yellow band represents the total uncertainty (systematic + statistical) in each plot.
bayes -8 -7 -6 -5 -4 -3 -2 ) τ 1/N dN/dln( 10-2 -1 10 Data Py8+CUETP8M1 Py8+Monash MadGraph Herwig++ Total uncertainty Statistical uncertainty Data Py8+CUETP8M1 Py8+Monash MadGraph Herwig++ Total uncertainty Statistical uncertainty Data Py8+CUETP8M1 Py8+Monash MadGraph Herwig++ Total uncertainty Statistical uncertainty Data Py8+CUETP8M1 Py8+Monash MadGraph Herwig++ Total uncertainty Statistical uncertainty < 93 GeV T,2 73 < H Data Py8+CUETP8M1 Py8+Monash MadGraph Herwig++ Total uncertainty Statistical uncertainty ) τ ln( -8 -7 -6 -5 -4 -3 -2 MC / Data 0.8 1 1.2 1.4 bayes -3 -2.5 -2 -1.5 -1 ) Tot 1/N dN/dln(B -1 10 Data Py8+CUETP8M1 Py8+Monash MadGraph Herwig++ Total uncertainty Statistical uncertainty Data Py8+CUETP8M1 Py8+Monash MadGraph Herwig++ Total uncertainty Statistical uncertainty Data Py8+CUETP8M1 Py8+Monash MadGraph Herwig++ Total uncertainty Statistical uncertainty Data Py8+CUETP8M1 Py8+Monash MadGraph Herwig++ Total uncertainty Statistical uncertainty < 93 GeV T,2 73 < H Data Py8+CUETP8M1 Py8+Monash MadGraph Herwig++ Total uncertainty Statistical uncertainty ) Tot ln(B -3 -2.5 -2 -1.5 -1 MC / Data 0.8 1 1.2 1.4 bayes -6 -5 -4 -3 -2 -1 ) Tot ρ 1/N dN/dln( -3 10 -2 10 -1 10 Data Py8+CUETP8M1 Py8+Monash MadGraph Herwig++ Total uncertainty Statistical uncertainty Data Py8+CUETP8M1 Py8+Monash MadGraph Herwig++ Total uncertainty Statistical uncertainty Data Py8+CUETP8M1 Py8+Monash MadGraph Herwig++ Total uncertainty Statistical uncertainty Data Py8+CUETP8M1 Py8+Monash MadGraph Herwig++ Total uncertainty Statistical uncertainty < 93 GeV T,2 73 < H Data Py8+CUETP8M1 Py8+Monash MadGraph Herwig++ Total uncertainty Statistical uncertainty ) Tot ρ ln( -6 -5 -4 -3 -2 -1 MC / Data 0.8 1 1.2 1.4 (13 TeV) -1 2.2 fb CMS bayes -6 -5.5 -5 -4.5 -4 -3.5 -3 -2.5 -2 -1.5 ) Tot T ρ 1/N dN/dln( -1 10 Data Py8+CUETP8M1 Py8+Monash MadGraph Herwig++ Total uncertainty Statistical uncertainty Data Py8+CUETP8M1 Py8+Monash MadGraph Herwig++ Total uncertainty Statistical uncertainty Data Py8+CUETP8M1 Py8+Monash MadGraph Herwig++ Total uncertainty Statistical uncertainty Data Py8+CUETP8M1 Py8+Monash MadGraph Herwig++ Total uncertainty Statistical uncertainty < 93 GeV T,2 73 < H Data Py8+CUETP8M1 Py8+Monash MadGraph Herwig++ Total uncertainty Statistical uncertainty ) Tot T ρ ln( -6 -5.5 -5 -4.5 -4 -3.5 -3 -2.5 -2 -1.5 MC / Data 0.8 1 1.2 1.4 (13 TeV) -1 2.2 fb CMS
Figure 3: Normalized differential distributions of unfolded data compared with theoretical (MC) predictions ofPYTHIA8 CUETP8M1 (red line),PYTHIA8 Monash (blue dash-dotted line), MADGRAPH5 aMC@NLO(pink dash-dot-dotted line) andHERWIG++ (brown dash-dot-dotted line) as a function of ESV: complement of transverse thrust (τ⊥) (upper left), total jet broad-ening (BTot) (upper right), total jet mass (ρTot) (lower left) and total transverse jet mass (ρTTot) (lower right) for 73< HT,2 <93 GeV. In each ratio plot, the inner gray band represents statisti-cal uncertainty and the yellow band represents the total uncertainty (systematic and statististatisti-cal
bayes -7 -6 -5 -4 -3 -2 ) τ 1/N dN/dln( -2 10 -1 10 Data Py8+CUETP8M1 Py8+Monash MadGraph Herwig++ Total uncertainty Statistical uncertainty Data Py8+CUETP8M1 Py8+Monash MadGraph Herwig++ Total uncertainty Statistical uncertainty Data Py8+CUETP8M1 Py8+Monash MadGraph Herwig++ Total uncertainty Statistical uncertainty Data Py8+CUETP8M1 Py8+Monash MadGraph Herwig++ Total uncertainty Statistical uncertainty < 165 GeV T,2 93 < H Data Py8+CUETP8M1 Py8+Monash MadGraph Herwig++ Total uncertainty Statistical uncertainty ) τ ln( -7 -6 -5 -4 -3 -2 MC / Data 0.8 1 1.2 1.4 bayes -3.5 -3 -2.5 -2 -1.5 -1 -0.5 ) Tot 1/N dN/dln(B -2 10 -1 10 Data Py8+CUETP8M1 Py8+Monash MadGraph Herwig++ Total uncertainty Statistical uncertainty Data Py8+CUETP8M1 Py8+Monash MadGraph Herwig++ Total uncertainty Statistical uncertainty Data Py8+CUETP8M1 Py8+Monash MadGraph Herwig++ Total uncertainty Statistical uncertainty Data Py8+CUETP8M1 Py8+Monash MadGraph Herwig++ Total uncertainty Statistical uncertainty < 165 GeV T,2 93 < H Data Py8+CUETP8M1 Py8+Monash MadGraph Herwig++ Total uncertainty Statistical uncertainty ) Tot ln(B -3.5 -3 -2.5 -2 -1.5 -1 -0.5 MC / Data 0.8 1 1.2 1.4 bayes -7 -6 -5 -4 -3 -2 -1 ) Tot ρ 1/N dN/dln( -3 10 -2 10 -1 10 Data Py8+CUETP8M1 Py8+Monash MadGraph Herwig++ Total uncertainty Statistical uncertainty Data Py8+CUETP8M1 Py8+Monash MadGraph Herwig++ Total uncertainty Statistical uncertainty Data Py8+CUETP8M1 Py8+Monash MadGraph Herwig++ Total uncertainty Statistical uncertainty Data Py8+CUETP8M1 Py8+Monash MadGraph Herwig++ Total uncertainty Statistical uncertainty < 165 GeV T,2 93 < H Data Py8+CUETP8M1 Py8+Monash MadGraph Herwig++ Total uncertainty Statistical uncertainty ) Tot ρ ln( -7 -6 -5 -4 -3 -2 -1 MC / Data 0.8 1 1.2 1.4 (13 TeV) -1 2.2 fb CMS bayes -6 -5 -4 -3 -2 ) Tot T ρ 1/N dN/dln( -2 10 -1 10 Data Py8+CUETP8M1 Py8+Monash MadGraph Herwig++ Total uncertainty Statistical uncertainty Data Py8+CUETP8M1 Py8+Monash MadGraph Herwig++ Total uncertainty Statistical uncertainty Data Py8+CUETP8M1 Py8+Monash MadGraph Herwig++ Total uncertainty Statistical uncertainty Data Py8+CUETP8M1 Py8+Monash MadGraph Herwig++ Total uncertainty Statistical uncertainty < 165 GeV T,2 93 < H Data Py8+CUETP8M1 Py8+Monash MadGraph Herwig++ Total uncertainty Statistical uncertainty ) Tot T ρ ln( -6 -5 -4 -3 -2 MC / Data 0.8 1 1.2 1.4 (13 TeV) -1 2.2 fb CMS
Figure 4: Normalized differential distributions of unfolded data compared with theoretical (MC) predictions ofPYTHIA8 CUETP8M1 (red line),PYTHIA8 Monash (blue dash-dotted line), MADGRAPH5 aMC@NLO(pink dash-dot-dotted line) andHERWIG++ (brown dash-dot-dotted line) as a function of ESV: complement of transverse thrust (τ⊥) (upper left), total jet broad-ening (BTot) (upper right), total jet mass (ρTot) (lower left) and total transverse jet mass (ρTTot) (lower right) for 93< HT,2 <165 GeV. In each ratio plot, the inner gray band represents statis-tical uncertainty and the yellow band represents the total uncertainty (systematic and statisstatis-tical components added in quadrature) on data and the MC predictions include only statistical un-certainty.
bayes -7 -6 -5 -4 -3 -2 ) τ 1/N dN/dln( -2 10 -1 10 Data Py8+CUETP8M1 Py8+Monash MadGraph Herwig++ Total uncertainty Statistical uncertainty Data Py8+CUETP8M1 Py8+Monash MadGraph Herwig++ Total uncertainty Statistical uncertainty Data Py8+CUETP8M1 Py8+Monash MadGraph Herwig++ Total uncertainty Statistical uncertainty Data Py8+CUETP8M1 Py8+Monash MadGraph Herwig++ Total uncertainty Statistical uncertainty < 225 GeV T,2 165 < H Data Py8+CUETP8M1 Py8+Monash MadGraph Herwig++ Total uncertainty Statistical uncertainty ) τ ln( -7 -6 -5 -4 -3 -2 MC / Data 0.8 1 1.2 1.4 bayes -3.5 -3 -2.5 -2 -1.5 -1 ) Tot 1/N dN/dln(B -2 10 -1 10 Data Py8+CUETP8M1 Py8+Monash MadGraph Herwig++ Total uncertainty Statistical uncertainty Data Py8+CUETP8M1 Py8+Monash MadGraph Herwig++ Total uncertainty Statistical uncertainty Data Py8+CUETP8M1 Py8+Monash MadGraph Herwig++ Total uncertainty Statistical uncertainty Data Py8+CUETP8M1 Py8+Monash MadGraph Herwig++ Total uncertainty Statistical uncertainty < 225 GeV T,2 165 < H Data Py8+CUETP8M1 Py8+Monash MadGraph Herwig++ Total uncertainty Statistical uncertainty ) Tot ln(B -3.5 -3 -2.5 -2 -1.5 -1 MC / Data 0.8 1 1.2 1.4 bayes -7 -6 -5 -4 -3 -2 -1 ) Tot ρ 1/N dN/dln( -3 10 -2 10 -1 10 Data Py8+CUETP8M1 Py8+Monash MadGraph Herwig++ Total uncertainty Statistical uncertainty Data Py8+CUETP8M1 Py8+Monash MadGraph Herwig++ Total uncertainty Statistical uncertainty Data Py8+CUETP8M1 Py8+Monash MadGraph Herwig++ Total uncertainty Statistical uncertainty Data Py8+CUETP8M1 Py8+Monash MadGraph Herwig++ Total uncertainty Statistical uncertainty < 225 GeV T,2 165 < H Data Py8+CUETP8M1 Py8+Monash MadGraph Herwig++ Total uncertainty Statistical uncertainty ) Tot ρ ln( -7 -6 -5 -4 -3 -2 -1 MC / Data 0.8 1 1.2 1.4 (13 TeV) -1 2.2 fb CMS bayes -6 -5 -4 -3 -2 ) Tot T ρ 1/N dN/dln( -2 10 -1 10 Data Py8+CUETP8M1 Py8+Monash MadGraph Herwig++ Total uncertainty Statistical uncertainty Data Py8+CUETP8M1 Py8+Monash MadGraph Herwig++ Total uncertainty Statistical uncertainty Data Py8+CUETP8M1 Py8+Monash MadGraph Herwig++ Total uncertainty Statistical uncertainty Data Py8+CUETP8M1 Py8+Monash MadGraph Herwig++ Total uncertainty Statistical uncertainty < 225 GeV T,2 165 < H Data Py8+CUETP8M1 Py8+Monash MadGraph Herwig++ Total uncertainty Statistical uncertainty ) Tot T ρ ln( -6 -5 -4 -3 -2 MC / Data 0.8 1 1.2 1.4 (13 TeV) -1 2.2 fb CMS
Figure 5: Normalized differential distributions of unfolded data compared with theoretical (MC) predictions ofPYTHIA8 CUETP8M1 (red line),PYTHIA8 Monash (blue dash-dotted line), MADGRAPH5 aMC@NLO(pink dash-dot-dotted line) andHERWIG++ (brown dash-dot-dotted line) as a function of ESV: complement of transverse thrust (τ⊥) (upper left), total jet broadening (BTot) (upper right), total jet mass (ρTot) (lower left) and total transverse jet mass (ρTTot) (lower right) for 165 < HT,2 < 225 GeV. In each ratio plot, the inner gray band represents statisti-cal uncertainty and the yellow band represents the total uncertainty (systematic and statististatisti-cal
bayes -8 -7 -6 -5 -4 -3 -2 ) τ 1/N dN/dln( -2 10 -1 10 Data Py8+CUETP8M1 Py8+Monash MadGraph Herwig++ Total uncertainty Statistical uncertainty Data Py8+CUETP8M1 Py8+Monash MadGraph Herwig++ Total uncertainty Statistical uncertainty Data Py8+CUETP8M1 Py8+Monash MadGraph Herwig++ Total uncertainty Statistical uncertainty Data Py8+CUETP8M1 Py8+Monash MadGraph Herwig++ Total uncertainty Statistical uncertainty < 298 GeV T,2 225 < H Data Py8+CUETP8M1 Py8+Monash MadGraph Herwig++ Total uncertainty Statistical uncertainty ) τ ln( -8 -7 -6 -5 -4 -3 -2 MC / Data 0.8 1 1.2 1.4 bayes -3.5 -3 -2.5 -2 -1.5 -1 ) Tot 1/N dN/dln(B -1 10 Data Py8+CUETP8M1 Py8+Monash MadGraph Herwig++ Total uncertainty Statistical uncertainty Data Py8+CUETP8M1 Py8+Monash MadGraph Herwig++ Total uncertainty Statistical uncertainty Data Py8+CUETP8M1 Py8+Monash MadGraph Herwig++ Total uncertainty Statistical uncertainty Data Py8+CUETP8M1 Py8+Monash MadGraph Herwig++ Total uncertainty Statistical uncertainty < 298 GeV T,2 225 < H Data Py8+CUETP8M1 Py8+Monash MadGraph Herwig++ Total uncertainty Statistical uncertainty ) Tot ln(B -3.5 -3 -2.5 -2 -1.5 -1 MC / Data 0.8 1 1.2 1.4 bayes -6 -5 -4 -3 -2 -1 ) Tot ρ 1/N dN/dln( -2 10 -1 10 Data Py8+CUETP8M1 Py8+Monash MadGraph Herwig++ Total uncertainty Statistical uncertainty Data Py8+CUETP8M1 Py8+Monash MadGraph Herwig++ Total uncertainty Statistical uncertainty Data Py8+CUETP8M1 Py8+Monash MadGraph Herwig++ Total uncertainty Statistical uncertainty Data Py8+CUETP8M1 Py8+Monash MadGraph Herwig++ Total uncertainty Statistical uncertainty < 298 GeV T,2 225 < H Data Py8+CUETP8M1 Py8+Monash MadGraph Herwig++ Total uncertainty Statistical uncertainty ) Tot ρ ln( -6 -5 -4 -3 -2 -1 MC / Data 0.8 1 1.2 1.4 (13 TeV) -1 2.2 fb CMS bayes -6 -5 -4 -3 -2 -1 ) Tot T ρ 1/N dN/dln( -3 10 -2 10 -1 10 Data Py8+CUETP8M1 Py8+Monash MadGraph Herwig++ Total uncertainty Statistical uncertainty Data Py8+CUETP8M1 Py8+Monash MadGraph Herwig++ Total uncertainty Statistical uncertainty Data Py8+CUETP8M1 Py8+Monash MadGraph Herwig++ Total uncertainty Statistical uncertainty Data Py8+CUETP8M1 Py8+Monash MadGraph Herwig++ Total uncertainty Statistical uncertainty < 298 GeV T,2 225 < H Data Py8+CUETP8M1 Py8+Monash MadGraph Herwig++ Total uncertainty Statistical uncertainty ) Tot T ρ ln( -6 -5 -4 -3 -2 -1 MC / Data 0.8 1 1.2 1.4 (13 TeV) -1 2.2 fb CMS
Figure 6: Normalized differential distributions of unfolded data compared with theoretical (MC) predictions ofPYTHIA8 CUETP8M1 (red line),PYTHIA8 Monash (blue dash-dotted line), MADGRAPH5 aMC@NLO(pink dash-dot-dotted line) andHERWIG++ (brown dash-dot-dotted line) as a function of ESV: complement of transverse thrust (τ⊥) (upper left), total jet broadening (BTot) (upper right), total jet mass (ρTot) (lower left) and total transverse jet mass (ρTTot) (lower right) for 225 < HT,2 < 298 GeV. In each ratio plot, the inner gray band represents statisti-cal uncertainty and the yellow band represents the total uncertainty (systematic and statististatisti-cal components added in quadrature) on data and the MC predictions include only statistical un-certainty.
bayes -9 -8 -7 -6 -5 -4 -3 -2 ) τ 1/N dN/dln( -2 10 -1 10 Data Py8+CUETP8M1 Py8+Monash MadGraph Herwig++ Total uncertainty Statistical uncertainty Data Py8+CUETP8M1 Py8+Monash MadGraph Herwig++ Total uncertainty Statistical uncertainty Data Py8+CUETP8M1 Py8+Monash MadGraph Herwig++ Total uncertainty Statistical uncertainty Data Py8+CUETP8M1 Py8+Monash MadGraph Herwig++ Total uncertainty Statistical uncertainty < 365 GeV T,2 298 < H Data Py8+CUETP8M1 Py8+Monash MadGraph Herwig++ Total uncertainty Statistical uncertainty ) τ ln( -9 -8 -7 -6 -5 -4 -3 -2 MC / Data 0.8 1 1.2 1.4 bayes -3.5 -3 -2.5 -2 -1.5 -1 -0.5 ) Tot 1/N dN/dln(B -4 10 -3 10 -2 10 -1 10 Data Py8+CUETP8M1 Py8+Monash MadGraph Herwig++ Total uncertainty Statistical uncertainty Data Py8+CUETP8M1 Py8+Monash MadGraph Herwig++ Total uncertainty Statistical uncertainty Data Py8+CUETP8M1 Py8+Monash MadGraph Herwig++ Total uncertainty Statistical uncertainty Data Py8+CUETP8M1 Py8+Monash MadGraph Herwig++ Total uncertainty Statistical uncertainty < 365 GeV T,2 298 < H Data Py8+CUETP8M1 Py8+Monash MadGraph Herwig++ Total uncertainty Statistical uncertainty ) Tot ln(B -3.5 -3 -2.5 -2 -1.5 -1 -0.5 MC / Data 0.8 1 1.2 1.4 bayes -6 -5 -4 -3 -2 -1 ) Tot ρ 1/N dN/dln( -2 10 -1 10 Data Py8+CUETP8M1 Py8+Monash MadGraph Herwig++ Total uncertainty Statistical uncertainty Data Py8+CUETP8M1 Py8+Monash MadGraph Herwig++ Total uncertainty Statistical uncertainty Data Py8+CUETP8M1 Py8+Monash MadGraph Herwig++ Total uncertainty Statistical uncertainty Data Py8+CUETP8M1 Py8+Monash MadGraph Herwig++ Total uncertainty Statistical uncertainty < 365 GeV T,2 298 < H Data Py8+CUETP8M1 Py8+Monash MadGraph Herwig++ Total uncertainty Statistical uncertainty ) Tot ρ ln( -6 -5 -4 -3 -2 -1 MC / Data 0.8 1 1.2 1.4 (13 TeV) -1 2.2 fb CMS bayes -6 -5 -4 -3 -2 ) Tot T ρ 1/N dN/dln( 10-2 -1 10 Data Py8+CUETP8M1 Py8+Monash MadGraph Herwig++ Total uncertainty Statistical uncertainty Data Py8+CUETP8M1 Py8+Monash MadGraph Herwig++ Total uncertainty Statistical uncertainty Data Py8+CUETP8M1 Py8+Monash MadGraph Herwig++ Total uncertainty Statistical uncertainty Data Py8+CUETP8M1 Py8+Monash MadGraph Herwig++ Total uncertainty Statistical uncertainty < 365 GeV T,2 298 < H Data Py8+CUETP8M1 Py8+Monash MadGraph Herwig++ Total uncertainty Statistical uncertainty ) Tot T ρ ln( -6 -5 -4 -3 -2 MC / Data 0.8 1 1.2 1.4 (13 TeV) -1 2.2 fb CMS
Figure 7: Normalized differential distributions of unfolded data compared with theoretical (MC) predictions ofPYTHIA8 CUETP8M1 (red line),PYTHIA8 Monash (blue dash-dotted line), MADGRAPH5 aMC@NLO(pink dash-dot-dotted line) andHERWIG++ (brown dash-dot-dotted line) as a function of ESV: complement of transverse thrust (τ⊥) (upper left), total jet broadening (BTot) (upper right), total jet mass (ρTot) (lower left) and total transverse jet mass (ρTTot) (lower right) for 298 < HT,2 < 365 GeV. In each ratio plot, the inner gray band represents statisti-cal uncertainty and the yellow band represents the total uncertainty (systematic and statististatisti-cal
bayes -8 -7 -6 -5 -4 -3 -2 ) τ 1/N dN/dln( -2 10 -1 10 Data Py8+CUETP8M1 Py8+Monash MadGraph Herwig++ Total uncertainty Statistical uncertainty Data Py8+CUETP8M1 Py8+Monash MadGraph Herwig++ Total uncertainty Statistical uncertainty Data Py8+CUETP8M1 Py8+Monash MadGraph Herwig++ Total uncertainty Statistical uncertainty Data Py8+CUETP8M1 Py8+Monash MadGraph Herwig++ Total uncertainty Statistical uncertainty < 452 GeV T,2 365 < H Data Py8+CUETP8M1 Py8+Monash MadGraph Herwig++ Total uncertainty Statistical uncertainty ) τ ln( -8 -7 -6 -5 -4 -3 -2 MC / Data 0.8 1 1.2 1.4 bayes -4 -3.5 -3 -2.5 -2 -1.5 ) Tot 1/N dN/dln(B -1 10 Data Py8+CUETP8M1 Py8+Monash MadGraph Herwig++ Total uncertainty Statistical uncertainty Data Py8+CUETP8M1 Py8+Monash MadGraph Herwig++ Total uncertainty Statistical uncertainty Data Py8+CUETP8M1 Py8+Monash MadGraph Herwig++ Total uncertainty Statistical uncertainty Data Py8+CUETP8M1 Py8+Monash MadGraph Herwig++ Total uncertainty Statistical uncertainty < 452 GeV T,2 365 < H Data Py8+CUETP8M1 Py8+Monash MadGraph Herwig++ Total uncertainty Statistical uncertainty ) Tot ln(B -4 -3.5 -3 -2.5 -2 -1.5 MC / Data 0.8 1 1.2 1.4 bayes -6 -5 -4 -3 -2 -1 ) Tot ρ 1/N dN/dln( -2 10 -1 10 Data Py8+CUETP8M1 Py8+Monash MadGraph Herwig++ Total uncertainty Statistical uncertainty Data Py8+CUETP8M1 Py8+Monash MadGraph Herwig++ Total uncertainty Statistical uncertainty Data Py8+CUETP8M1 Py8+Monash MadGraph Herwig++ Total uncertainty Statistical uncertainty Data Py8+CUETP8M1 Py8+Monash MadGraph Herwig++ Total uncertainty Statistical uncertainty < 452 GeV T,2 365 < H Data Py8+CUETP8M1 Py8+Monash MadGraph Herwig++ Total uncertainty Statistical uncertainty ) Tot ρ ln( -6 -5 -4 -3 -2 -1 MC / Data 0.8 1 1.2 1.4 (13 TeV) -1 2.2 fb CMS bayes -7 -6 -5 -4 -3 -2 ) Tot T ρ 1/N dN/dln( -2 10 -1 10 Data Py8+CUETP8M1 Py8+Monash MadGraph Herwig++ Total uncertainty Statistical uncertainty Data Py8+CUETP8M1 Py8+Monash MadGraph Herwig++ Total uncertainty Statistical uncertainty Data Py8+CUETP8M1 Py8+Monash MadGraph Herwig++ Total uncertainty Statistical uncertainty Data Py8+CUETP8M1 Py8+Monash MadGraph Herwig++ Total uncertainty Statistical uncertainty < 452 GeV T,2 365 < H Data Py8+CUETP8M1 Py8+Monash MadGraph Herwig++ Total uncertainty Statistical uncertainty ) Tot T ρ ln( -7 -6 -5 -4 -3 -2 MC / Data 0.8 1 1.2 1.4 (13 TeV) -1 2.2 fb CMS
Figure 8: Normalized differential distributions of unfolded data compared with theoretical (MC) predictions ofPYTHIA8 CUETP8M1 (red line),PYTHIA8 Monash (blue dash-dotted line), MADGRAPH5 aMC@NLO(pink dash-dot-dotted line) andHERWIG++ (brown dash-dot-dotted line) as a function of ESV: complement of transverse thrust (τ⊥) (upper left), total jet broadening (BTot) (upper right), total jet mass (ρTot) (lower left) and total transverse jet mass (ρTTot) (lower right) for 365 < HT,2 < 452 GeV. In each ratio plot, the inner gray band represents statisti-cal uncertainty and the yellow band represents the total uncertainty (systematic and statististatisti-cal components added in quadrature) on data and the MC predictions include only statistical un-certainty.
bayes -9 -8 -7 -6 -5 -4 -3 -2 ) τ 1/N dN/dln( -2 10 -1 10 Data Py8+CUETP8M1 Py8+Monash MadGraph Herwig++ Total uncertainty Statistical uncertainty Data Py8+CUETP8M1 Py8+Monash MadGraph Herwig++ Total uncertainty Statistical uncertainty Data Py8+CUETP8M1 Py8+Monash MadGraph Herwig++ Total uncertainty Statistical uncertainty Data Py8+CUETP8M1 Py8+Monash MadGraph Herwig++ Total uncertainty Statistical uncertainty < 557 GeV T2 452 < H Data Py8+CUETP8M1 Py8+Monash MadGraph Herwig++ Total uncertainty Statistical uncertainty ) τ ln( -9 -8 -7 -6 -5 -4 -3 -2 MC / Data 0.8 1 1.2 1.4 bayes -4.5 -4 -3.5 -3 -2.5 -2 -1.5 -1 ) Tot 1/N dN/dln(B -1 10 Data Py8+CUETP8M1 Py8+Monash MadGraph Herwig++ Total uncertainty Statistical uncertainty Data Py8+CUETP8M1 Py8+Monash MadGraph Herwig++ Total uncertainty Statistical uncertainty Data Py8+CUETP8M1 Py8+Monash MadGraph Herwig++ Total uncertainty Statistical uncertainty Data Py8+CUETP8M1 Py8+Monash MadGraph Herwig++ Total uncertainty Statistical uncertainty < 557 GeV T2 452 < H Data Py8+CUETP8M1 Py8+Monash MadGraph Herwig++ Total uncertainty Statistical uncertainty ) Tot ln(B -4.5 -4 -3.5 -3 -2.5 -2 -1.5 -1 MC / Data 0.8 1 1.2 1.4 bayes -6 -5 -4 -3 -2 -1 ) Tot ρ 1/N dN/dln( 10-2 -1 10 Data Py8+CUETP8M1 Py8+Monash MadGraph Herwig++ Total uncertainty Statistical uncertainty Data Py8+CUETP8M1 Py8+Monash MadGraph Herwig++ Total uncertainty Statistical uncertainty Data Py8+CUETP8M1 Py8+Monash MadGraph Herwig++ Total uncertainty Statistical uncertainty Data Py8+CUETP8M1 Py8+Monash MadGraph Herwig++ Total uncertainty Statistical uncertainty < 557 GeV T2 452 < H Data Py8+CUETP8M1 Py8+Monash MadGraph Herwig++ Total uncertainty Statistical uncertainty ) Tot ρ ln( -6 -5 -4 -3 -2 -1 MC / Data 0.8 1 1.2 1.4 (13 TeV) -1 2.2 fb CMS bayes -7 -6 -5 -4 -3 -2 ) Tot T ρ 1/N dN/dln( -2 10 -1 10 Data Py8+CUETP8M1 Py8+Monash MadGraph Herwig++ Total uncertainty Statistical uncertainty Data Py8+CUETP8M1 Py8+Monash MadGraph Herwig++ Total uncertainty Statistical uncertainty Data Py8+CUETP8M1 Py8+Monash MadGraph Herwig++ Total uncertainty Statistical uncertainty Data Py8+CUETP8M1 Py8+Monash MadGraph Herwig++ Total uncertainty Statistical uncertainty < 557 GeV T2 452 < H Data Py8+CUETP8M1 Py8+Monash MadGraph Herwig++ Total uncertainty Statistical uncertainty ) Tot T ρ ln( -7 -6 -5 -4 -3 -2 MC / Data 0.8 1 1.2 1.4 (13 TeV) -1 2.2 fb CMS
Figure 9: Normalized differential distributions of unfolded data compared with theoretical (MC) predictions ofPYTHIA8 CUETP8M1 (red line),PYTHIA8 Monash (blue dash-dotted line), MADGRAPH5 aMC@NLO(pink dash-dot-dotted line) andHERWIG++ (brown dash-dot-dotted line) as a function of ESV: complement of transverse thrust (τ⊥) (upper left), total jet broadening (BTot) (upper right), total jet mass (ρTot) (lower left) and total transverse jet mass (ρTTot) (lower right) for 452 < HT,2 < 557 GeV. In each ratio plot, the inner gray band represents statisti-cal uncertainty and the yellow band represents the total uncertainty (systematic and statististatisti-cal
bayes -8 -7 -6 -5 -4 -3 -2 ) τ 1/N dN/dln( -2 10 -1 10 Data Py8+CUETP8M1 Py8+Monash MadGraph Herwig++ Total uncertainty Statistical uncertainty Data Py8+CUETP8M1 Py8+Monash MadGraph Herwig++ Total uncertainty Statistical uncertainty Data Py8+CUETP8M1 Py8+Monash MadGraph Herwig++ Total uncertainty Statistical uncertainty Data Py8+CUETP8M1 Py8+Monash MadGraph Herwig++ Total uncertainty Statistical uncertainty > 557 GeV T,2 H Data Py8+CUETP8M1 Py8+Monash MadGraph Herwig++ Total uncertainty Statistical uncertainty ) τ ln( -8 -7 -6 -5 -4 -3 -2 MC / Data 0.8 1 1.2 1.4 bayes -4.5 -4 -3.5 -3 -2.5 -2 -1.5 -1 ) Tot 1/N dN/dln(B -2 10 -1 10 Data Py8+CUETP8M1 Py8+Monash MadGraph Herwig++ Total uncertainty Statistical uncertainty Data Py8+CUETP8M1 Py8+Monash MadGraph Herwig++ Total uncertainty Statistical uncertainty Data Py8+CUETP8M1 Py8+Monash MadGraph Herwig++ Total uncertainty Statistical uncertainty Data Py8+CUETP8M1 Py8+Monash MadGraph Herwig++ Total uncertainty Statistical uncertainty > 557 GeV T,2 H Data Py8+CUETP8M1 Py8+Monash MadGraph Herwig++ Total uncertainty Statistical uncertainty ) Tot ln(B -4.5 -4 -3.5 -3 -2.5 -2 -1.5 -1 MC / Data 0.8 1 1.2 1.4 bayes -6 -5 -4 -3 -2 -1 ) Tot ρ 1/N dN/dln( -3 10 -2 10 -1 10 Data Py8+CUETP8M1 Py8+Monash MadGraph Herwig++ Total uncertainty Statistical uncertainty Data Py8+CUETP8M1 Py8+Monash MadGraph Herwig++ Total uncertainty Statistical uncertainty Data Py8+CUETP8M1 Py8+Monash MadGraph Herwig++ Total uncertainty Statistical uncertainty Data Py8+CUETP8M1 Py8+Monash MadGraph Herwig++ Total uncertainty Statistical uncertainty > 557 GeV T,2 H Data Py8+CUETP8M1 Py8+Monash MadGraph Herwig++ Total uncertainty Statistical uncertainty ) Tot ρ ln( -6 -5 -4 -3 -2 -1 MC / Data 0.8 1 1.2 1.4 (13 TeV) -1 2.2 fb CMS bayes -7 -6 -5 -4 -3 -2 ) Tot T ρ 1/N dN/dln( 10-2 -1 10 Data Py8+CUETP8M1 Py8+Monash MadGraph Herwig++ Total uncertainty Statistical uncertainty Data Py8+CUETP8M1 Py8+Monash MadGraph Herwig++ Total uncertainty Statistical uncertainty Data Py8+CUETP8M1 Py8+Monash MadGraph Herwig++ Total uncertainty Statistical uncertainty Data Py8+CUETP8M1 Py8+Monash MadGraph Herwig++ Total uncertainty Statistical uncertainty > 557 GeV T,2 H Data Py8+CUETP8M1 Py8+Monash MadGraph Herwig++ Total uncertainty Statistical uncertainty ) Tot T ρ ln( -7 -6 -5 -4 -3 -2 MC / Data 0.8 1 1.2 1.4 (13 TeV) -1 2.2 fb CMS
Figure 10: Normalized differential distributions of unfolded data compared with theoretical (MC) predictions ofPYTHIA8 CUETP8M1 (red line),PYTHIA8 Monash (blue dash-dotted line), MADGRAPH5 aMC@NLO(pink dash-dot-dotted line) andHERWIG++ (brown dash-dot-dotted line) as a function of ESV: complement of transverse thrust (τ⊥) (upper left), total jet broad-ening (BTot) (upper right), total jet mass (ρTot) transverse jet mass (ρTTot) (lower left) and total transverse jet mass (ρT
Tot) (lower right) for HT,2 > 557 GeV. In each ratio plot, the inner gray band represents statistical uncertainty and the yellow band represents the total uncertainty (systematic and statistical components added in quadrature) on data and the MC predictions include only statistical uncertainty.
(13 TeV) -1 2.2 fb CMS 100 200 300 400 500 600 700 800 〉 ) τ ln( 〈 -4.6 -4.4 -4.2 -4 -3.8 -3.6 -3.4 -3.2 -3 -2.8 Data Py8+CUETP8M1 Py8+Monash MadGraph Herwig++ Statistical uncertainty Total uncertainty (GeV) T,2 H 100 200 300 400 500 600 700 800 MC/Data 0.950.9 1 (13 TeV) -1 2.2 fb CMS 100 200 300 400 500 600 700 800 〉 ) Tot ln(B 〈 -3 -2.8 -2.6 -2.4 -2.2 -2 -1.8 -1.6 Data Py8+CUETP8M1 Py8+Monash MadGraph Herwig++ Statistical uncertainty Total uncertainty (GeV) T,2 H 100 200 300 400 500 600 700 800 MC/Data 0.950.9 1 (13 TeV) -1 2.2 fb CMS 100 200 300 400 500 600 700 800 〉 ) Tot ρ ln( 〈 -4 -3.8 -3.6 -3.4 -3.2 -3 Data Py8+CUETP8M1 Py8+Monash MadGraph Herwig++ Statistical uncertainty Total uncertainty (GeV) T,2 H 100 200 300 400 500 600 700 800 MC/Data 0.9 0.95 1 (13 TeV) -1 2.2 fb CMS 100 200 300 400 500 600 700 800 〉 ) Tot T ρ ln( 〈 -4.4 -4.2 -4 -3.8 -3.6 -3.4 -3.2 -3 -2.8 Data Py8+CUETP8M1 Py8+Monash MadGraph Herwig++ Statistical uncertainty Total uncertainty (GeV) T,2 H 100 200 300 400 500 600 700 800 MC/Data 0.9 0.95 1
Figure 11: The evolution of the mean of τ⊥(upper left), BTot(upper right), ρTot(lower left) and
ρTTot(lower right) and with increasing HT,2. The ratio plots with respect to data are presented in the bottom panel to compare predictions ofPYTHIA8 CUETP8M1 (red line),PYTHIA8 Monash (blue dash-dotted line), MADGRAPH5 aMC@NLO (pink dash-dot-dotted line) andHERWIG++
event generatorsPYTHIA8, HERWIG++, and MADGRAPH5 aMC@NLO+PYTHIA8. ThePYTHIA8 generator describes the flow of energy in the transverse plane well as seen in the τ⊥ and ρTTot distributions. HERWIG++ and MADGRAPH5 aMC@NLOshow good agreement with the data
for all the four event shape variables and are better thanPYTHIA8 in predicting ρTotand BTot. A study of the effects of initial state radiation, final state radiation, and multiple parton interac-tions inPYTHIA8 is also presented.
Acknowledgments
We congratulate our colleagues in the CERN accelerator departments for the excellent perfor-mance of the LHC and thank the technical and administrative staffs at CERN and at other CMS institutes for their contributions to the success of the CMS effort. In addition, we gratefully acknowledge the computing centres and personnel of the Worldwide LHC Computing Grid for delivering so effectively the computing infrastructure essential to our analyses. Finally, we acknowledge the enduring support for the construction and operation of the LHC and the CMS detector provided by the following funding agencies: BMBWF and FWF (Austria); FNRS and FWO (Belgium); CNPq, CAPES, FAPERJ, FAPERGS, and FAPESP (Brazil); MES (Bulgaria); CERN; CAS, MoST, and NSFC (China); COLCIENCIAS (Colombia); MSES and CSF (Croa-tia); RPF (Cyprus); SENESCYT (Ecuador); MoER, ERC IUT, and ERDF (Estonia); Academy of Finland, MEC, and HIP (Finland); CEA and CNRS/IN2P3 (France); BMBF, DFG, and HGF (Germany); GSRT (Greece); NKFIA (Hungary); DAE and DST (India); IPM (Iran); SFI (Ireland); INFN (Italy); MSIP and NRF (Republic of Korea); MES (Latvia); LAS (Lithuania); MOE and UM (Malaysia); BUAP, CINVESTAV, CONACYT, LNS, SEP, and UASLP-FAI (Mexico); MOS (Mon-tenegro); MBIE (New Zealand); PAEC (Pakistan); MSHE and NSC (Poland); FCT (Portugal); JINR (Dubna); MON, RosAtom, RAS, RFBR, and NRC KI (Russia); MESTD (Serbia); SEIDI, CPAN, PCTI, and FEDER (Spain); MOSTR (Sri Lanka); Swiss Funding Agencies (Switzerland); MST (Taipei); ThEPCenter, IPST, STAR, and NSTDA (Thailand); TUBITAK and TAEK (Turkey); NASU and SFFR (Ukraine); STFC (United Kingdom); DOE and NSF (USA).
Individuals have received support from the Marie-Curie programme and the European Re-search Council and Horizon 2020 Grant, contract No. 675440 (European Union); the Leventis Foundation; the A. P. Sloan Foundation; the Alexander von Humboldt Foundation; the Belgian Federal Science Policy Office; the Fonds pour la Formation `a la Recherche dans l’Industrie et dans l’Agriculture (FRIA-Belgium); the Agentschap voor Innovatie door Wetenschap en Tech-nologie (IWT-Belgium); the F.R.S.-FNRS and FWO (Belgium) under the “Excellence of Science - EOS” - be.h project n. 30820817; the Ministry of Education, Youth and Sports (MEYS) of the Czech Republic; the Lend ¨ulet (“Momentum”) Programme and the J´anos Bolyai Research Schol-arship of the Hungarian Academy of Sciences, the New National Excellence Program ´UNKP, the NKFIA research grants 123842, 123959, 124845, 124850 and 125105 (Hungary); the Council of Science and Industrial Research, India; the HOMING PLUS programme of the Foundation for Polish Science, cofinanced from European Union, Regional Development Fund, the Mo-bility Plus programme of the Ministry of Science and Higher Education, the National Science Center (Poland), contracts Harmonia 2014/14/M/ST2/00428, Opus 2014/13/B/ST2/02543, 2014/15/B/ST2/03998, and 2015/19/B/ST2/02861, Sonata-bis 2012/07/E/ST2/01406; the
demic into Its 2nd Century Project Advancement Project (Thailand); the Welch Foundation, contract C-1845; and the Weston Havens Foundation (USA).
References
[1] A. Banfi, G. P. Salam, and G. Zanderighi, “Resummed event shapes at hadron-hadron colliders”, JHEP 08 (2004) 062, doi:10.1088/1126-6708/2004/08/062,
arXiv:hep-ph/0407287.
[2] A. Banfi, G. P. Salam, and G. Zanderighi, “Phenomenology of event shapes at hadron colliders”, JHEP 06 (2010) 038, doi:10.1007/JHEP06(2010)038,
arXiv:1001.4082.
[3] M. Dasgupta and G. P. Salam, “Event shapes in e+e−annihilation and deep inelastic scattering”, J. Phys. G 30 (2004) R143, doi:10.1088/0954-3899/30/5/R01, arXiv:hep-ph/0312283.
[4] M. Rubin, G. P. Salam, and S. Sapeta, “Giant QCD K-factors beyond NLO”, JHEP 09 (2010) 084, doi:10.1007/JHEP09(2010)084, arXiv:1006.2144.
[5] R. W. L. Jones et al., “Theoretical uncertainties on αsfrom event shape variables in e+e− annihilations”, JHEP 12 (2003) 007, doi:10.1088/1126-6708/2003/12/007,
arXiv:hep-ph/0312016.
[6] G. Dissertori et al., “First determination of the strong coupling constant using NNLO predictions for hadronic event shapes in e+e−annihilations”, JHEP 02 (2008) 040, doi:10.1088/1126-6708/2008/02/040, arXiv:0712.0327.
[7] G. Dissertori et al., “Determination of the strong coupling constant using matched NNLO+NLLA predictions for hadronic event shapes in e+e−annihilations”, JHEP 08 (2009) 036, doi:10.1088/1126-6708/2009/08/036, arXiv:0906.3436.
[8] R. M. Chatterjee, M. Guchait, and D. Sengupta, “Probing supersymmetry using event shape variables at 8 TeV LHC”, Phys. Rev. D 86 (2012) 075014,
doi:10.1103/PhysRevD.86.075014, arXiv:1206.5770.
[9] A. Datta, A. Datta, and S. Poddar, “Enriching the exploration of the mUED model with event shape variables at the CERN LHC”, Phys. Lett. B 712 (2012) 219,
doi:10.1016/j.physletb.2012.03.012, arXiv:1111.2912.
[10] P. Konar and P. Roy, “Event shape discrimination of supersymmetry from large extra dimensions at a linear collider”, Phys. Lett. B 634 (2006) 295,
[14] L3 Collaboration, “Studies of hadronic event structure in e+e−annihilation from 30 GeV to 209 GeV with the L3 detector”, Phys. Rept. 399 (2004) 71,
doi:10.1016/j.physrep.2004.07.002, arXiv:hep-ex/0406049.
[15] OPAL Collaboration, “A determination of αs(M (Z0)) at LEP using resummed QCD calculations”, Z. Phys. C 59 (1993) 1, doi:10.1007/BF01555834.
[16] H1 Collaboration, “Measurement of event shape variables in deep-inelastic scattering at HERA”, Eur. Phys. J. C 46 (2006) 343, doi:10.1140/epjc/s2006-02493-x,
arXiv:hep-ex/0512014.
[17] CDF Collaboration, “Measurement of event ehapes in proton-antiproton collisions at center-of-mass energy 1.96 TeV”, Phys. Rev. D 83 (2011) 112007,
doi:10.1103/PhysRevD.83.112007, arXiv:1103.5143.
[18] T. Sj ¨ostrand, S. Mrenna, and P. Z. Skands, “PYTHIA 6.4 Physics and manual”, JHEP 05 (2006) 026, doi:10.1088/1126-6708/2006/05/026, arXiv:hep-ph/0603175. [19] CMS Collaboration, “First measurement of hadronic event shapes in pp collisions at√
s =7 TeV”, Phys. Lett. B 699 (2011) 48, doi:10.1016/j.physletb.2011.03.060, arXiv:1102.0068.
[20] CMS Collaboration, “Event shapes and azimuthal correlations in Z+jets events in pp collisions at√s=7 TeV”, Phys. Lett. B 722 (2013) 238,
doi:10.1016/j.physletb.2013.04.025, arXiv:1301.1646. [21] CMS Collaboration, “Jet and underlying event properties as a function of
charged-particle multiplicity in protonproton collisions at√s=7 TeV”, Eur. Phys. J. C
73(2013) 2674, doi:10.1140/epjc/s10052-013-2674-5, arXiv:1310.4554. [22] CMS Collaboration, “Study of hadronic event-shape variables in multijet final states in
pp collisions at√s =7 TeV”, JHEP 10 (2014) 087, doi:10.1007/JHEP10(2014)087, arXiv:1407.2856.
[23] ATLAS Collaboration, “Measurement of event shapes at large momentum transfer with the ATLAS detector in pp collisions at√s=7 TeV”, Eur. Phys. J. C 72 (2012) 2211,
doi:10.1140/epjc/s10052-012-2211-y, arXiv:1206.2135.
[24] ATLAS Collaboration, “Measurement of charged-particle event shape variables in√
s =7 TeV proton-proton interactions with the ATLAS detector”, Phys. Rev. D 88 (2013) 032004, doi:10.1103/PhysRevD.88.032004, arXiv:1207.6915.
[25] ATLAS Collaboration, “Measurement of event-shape observables in Z→ `+`−events in pp collisions at√s=7 TeV with the ATLAS detector at the LHC”, Eur. Phys. J. C 76 (2016) 375, doi:10.1140/epjc/s10052-016-4176-8, arXiv:1602.08980.
159, doi:10.1016/j.cpc.2015.01.024, arXiv:1410.3012.
[28] J. Alwall et al., “The automated computation of tree-level and next-to-leading order differential cross sections, and their matching to parton shower simulations”, JHEP 07 (2014) 079, doi:10.1007/JHEP07(2014)079, arXiv:1405.0301.
[29] J. Bellm et al., “Herwig 7.0/Herwig++ 3.0 release note”, Eur. Phys. J. C 76 (2016) 196, doi:10.1140/epjc/s10052-016-4018-8, arXiv:1512.01178.
[30] CMS Collaboration, “The CMS experiment at the CERN LHC”, JINST 3 (2008) S08004, doi:10.1088/1748-0221/3/08/S08004.
[31] CMS Collaboration, “Particle-flow reconstruction and global event description with the CMS detector”, JINST 12 (2017) P10003, doi:10.1088/1748-0221/12/10/P10003, arXiv:1706.04965.
[32] M. Cacciari, G. P. Salam, and G. Soyez, “The anti-kTjet clustering algorithm”, JHEP 04 (2008) 063, doi:10.1088/1126-6708/2008/04/063, arXiv:0802.1189.
[33] M. Cacciari, G. P. Salam, and G. Soyez, “FastJet User Manual”, Eur. Phys. J. C 72 (2012) 1896, doi:10.1140/epjc/s10052-012-1896-2, arXiv:1111.6097.
[34] CMS Collaboration, “Determination of jet energy calibration and transverse momentum resolution in CMS”, JINST 6 (2011) P11002,
doi:10.1088/1748-0221/6/11/P11002, arXiv:1107.4277.
[35] NNPDF Collaboration, “Parton distributions for the LHC Run II”, JHEP 04 (2015) 040,
doi:10.1007/JHEP04(2015)040, arXiv:1410.8849.
[36] CMS Collaboration, “Event generator tunes obtained from underlying event and multiparton scattering measurements”, Eur. Phys. J. C 76 (2016) 155,
doi:10.1140/epjc/s10052-016-3988-x, arXiv:1512.00815.
[37] P. Skands, S. Carrazza, and J. Rojo, “Tuning PYTHIA 8.1: the Monash 2013 Tune”, Eur. Phys. J. C 74 (2014) 3024, doi:10.1140/epjc/s10052-014-3024-y,
arXiv:1404.5630.
[38] J. Alwall et al., “Comparative study of various algorithms for the merging of parton showers and matrix elements in hadronic collisions”, Eur. Phys. J. C 53 (2008) 473, doi:10.1140/epjc/s10052-007-0490-5, arXiv:0706.2569.
[39] T. Adye, “Unfolding algorithms and tests using RooUnfold”, in Proceedings, PHYSTAT 2011 Workshop on Statistical Issues Related to Discovery Claims in Search Experiments and Unfolding, CERN, Geneva, Switzerland 17-20 January 2011, p. 313, CERN. 2011.
Institut f ¨ur Hochenergiephysik, Wien, Austria
W. Adam, F. Ambrogi, E. Asilar, T. Bergauer, J. Brandstetter, M. Dragicevic, J. Er ¨o, A. Escalante Del Valle, M. Flechl, R. Fr ¨uhwirth1, V.M. Ghete, J. Hrubec, M. Jeitler1, N. Krammer, I. Kr¨atschmer, D. Liko, T. Madlener, I. Mikulec, N. Rad, H. Rohringer, J. Schieck1, R. Sch ¨ofbeck, M. Spanring, D. Spitzbart, A. Taurok, W. Waltenberger, J. Wittmann, C.-E. Wulz1, M. Zarucki
Institute for Nuclear Problems, Minsk, Belarus
V. Chekhovsky, V. Mossolov, J. Suarez Gonzalez
Universiteit Antwerpen, Antwerpen, Belgium
E.A. De Wolf, D. Di Croce, X. Janssen, J. Lauwers, M. Pieters, H. Van Haevermaet, P. Van Mechelen, N. Van Remortel
Vrije Universiteit Brussel, Brussel, Belgium
S. Abu Zeid, F. Blekman, J. D’Hondt, I. De Bruyn, J. De Clercq, K. Deroover, G. Flouris, D. Lontkovskyi, S. Lowette, I. Marchesini, S. Moortgat, L. Moreels, Q. Python, K. Skovpen, S. Tavernier, W. Van Doninck, P. Van Mulders, I. Van Parijs
Universit´e Libre de Bruxelles, Bruxelles, Belgium
D. Beghin, B. Bilin, H. Brun, B. Clerbaux, G. De Lentdecker, H. Delannoy, B. Dorney, G. Fasanella, L. Favart, R. Goldouzian, A. Grebenyuk, A.K. Kalsi, T. Lenzi, J. Luetic, N. Postiau, E. Starling, L. Thomas, C. Vander Velde, P. Vanlaer, D. Vannerom, Q. Wang
Ghent University, Ghent, Belgium
T. Cornelis, D. Dobur, A. Fagot, M. Gul, I. Khvastunov2, D. Poyraz, C. Roskas, D. Trocino, M. Tytgat, W. Verbeke, B. Vermassen, M. Vit, N. Zaganidis
Universit´e Catholique de Louvain, Louvain-la-Neuve, Belgium
H. Bakhshiansohi, O. Bondu, S. Brochet, G. Bruno, C. Caputo, P. David, C. Delaere, M. Delcourt, B. Francois, A. Giammanco, G. Krintiras, V. Lemaitre, A. Magitteri, A. Mertens, M. Musich, K. Piotrzkowski, A. Saggio, M. Vidal Marono, S. Wertz, J. Zobec
Centro Brasileiro de Pesquisas Fisicas, Rio de Janeiro, Brazil
F.L. Alves, G.A. Alves, M. Correa Martins Junior, G. Correia Silva, C. Hensel, A. Moraes, M.E. Pol, P. Rebello Teles
Universidade do Estado do Rio de Janeiro, Rio de Janeiro, Brazil
E. Belchior Batista Das Chagas, W. Carvalho, J. Chinellato3, E. Coelho, E.M. Da Costa, G.G. Da Silveira4, D. De Jesus Damiao, C. De Oliveira Martins, S. Fonseca De Souza, H. Malbouisson, D. Matos Figueiredo, M. Melo De Almeida, C. Mora Herrera, L. Mundim, H. Nogima, W.L. Prado Da Silva, L.J. Sanchez Rosas, A. Santoro, A. Sznajder, M. Thiel, E.J. Tonelli Manganote3, F. Torres Da Silva De Araujo, A. Vilela Pereira
Universidade Estadual Paulistaa, Universidade Federal do ABCb, S˜ao Paulo, Brazil
S. Ahujaa, C.A. Bernardesa, L. Calligarisa, T.R. Fernandez Perez Tomeia, E.M. Gregoresb,
Beihang University, Beijing, China
W. Fang5, X. Gao5, L. Yuan
Institute of High Energy Physics, Beijing, China
M. Ahmad, J.G. Bian, G.M. Chen, H.S. Chen, M. Chen, Y. Chen, C.H. Jiang, D. Leggat, H. Liao, Z. Liu, F. Romeo, S.M. Shaheen6, A. Spiezia, J. Tao, Z. Wang, E. Yazgan, H. Zhang, S. Zhang6, J. Zhao
State Key Laboratory of Nuclear Physics and Technology, Peking University, Beijing, China
Y. Ban, G. Chen, A. Levin, J. Li, L. Li, Q. Li, Y. Mao, S.J. Qian, D. Wang, Z. Xu
Tsinghua University, Beijing, China
Y. Wang
Universidad de Los Andes, Bogota, Colombia
C. Avila, A. Cabrera, C.A. Carrillo Montoya, L.F. Chaparro Sierra, C. Florez, C.F. Gonz´alez Hern´andez, M.A. Segura Delgado
University of Split, Faculty of Electrical Engineering, Mechanical Engineering and Naval Architecture, Split, Croatia
B. Courbon, N. Godinovic, D. Lelas, I. Puljak, T. Sculac
University of Split, Faculty of Science, Split, Croatia
Z. Antunovic, M. Kovac
Institute Rudjer Boskovic, Zagreb, Croatia
V. Brigljevic, D. Ferencek, K. Kadija, B. Mesic, A. Starodumov7, T. Susa
University of Cyprus, Nicosia, Cyprus
M.W. Ather, A. Attikis, M. Kolosova, G. Mavromanolakis, J. Mousa, C. Nicolaou, F. Ptochos, P.A. Razis, H. Rykaczewski
Charles University, Prague, Czech Republic
M. Finger8, M. Finger Jr.8
Escuela Politecnica Nacional, Quito, Ecuador
E. Ayala
Universidad San Francisco de Quito, Quito, Ecuador
E. Carrera Jarrin
Academy of Scientific Research and Technology of the Arab Republic of Egypt, Egyptian Network of High Energy Physics, Cairo, Egypt
A.A. Abdelalim9,10, A. Mahrous9, A. Mohamed10
National Institute of Chemical Physics and Biophysics, Tallinn, Estonia
S. Bhowmik, A. Carvalho Antunes De Oliveira, R.K. Dewanjee, K. Ehataht, M. Kadastik, M. Raidal, C. Veelken
Perini, S. Laurila, S. Lehti, T. Lind´en, P. Luukka, T. M¨aenp¨a¨a, H. Siikonen, E. Tuominen, J. Tuominiemi
Lappeenranta University of Technology, Lappeenranta, Finland
T. Tuuva
IRFU, CEA, Universit´e Paris-Saclay, Gif-sur-Yvette, France
M. Besancon, F. Couderc, M. Dejardin, D. Denegri, J.L. Faure, F. Ferri, S. Ganjour, A. Givernaud, P. Gras, G. Hamel de Monchenault, P. Jarry, C. Leloup, E. Locci, J. Malcles, G. Negro, J. Rander, A. Rosowsky, M. ¨O. Sahin, M. Titov
Laboratoire Leprince-Ringuet, Ecole polytechnique, CNRS/IN2P3, Universit´e Paris-Saclay, Palaiseau, France
A. Abdulsalam11, C. Amendola, I. Antropov, F. Beaudette, P. Busson, C. Charlot, R. Granier de Cassagnac, I. Kucher, A. Lobanov, J. Martin Blanco, C. Martin Perez, M. Nguyen, C. Ochando, G. Ortona, P. Paganini, P. Pigard, J. Rembser, R. Salerno, J.B. Sauvan, Y. Sirois, A.G. Stahl Leiton, A. Zabi, A. Zghiche
Universit´e de Strasbourg, CNRS, IPHC UMR 7178, Strasbourg, France
J.-L. Agram12, J. Andrea, D. Bloch, J.-M. Brom, E.C. Chabert, V. Cherepanov, C. Collard, E. Conte12, J.-C. Fontaine12, D. Gel´e, U. Goerlach, M. Jansov´a, A.-C. Le Bihan, N. Tonon, P. Van Hove
Centre de Calcul de l’Institut National de Physique Nucleaire et de Physique des Particules, CNRS/IN2P3, Villeurbanne, France
S. Gadrat
Universit´e de Lyon, Universit´e Claude Bernard Lyon 1, CNRS-IN2P3, Institut de Physique Nucl´eaire de Lyon, Villeurbanne, France
S. Beauceron, C. Bernet, G. Boudoul, N. Chanon, R. Chierici, D. Contardo, P. Depasse, H. El Mamouni, J. Fay, L. Finco, S. Gascon, M. Gouzevitch, G. Grenier, B. Ille, F. Lagarde, I.B. Laktineh, H. Lattaud, M. Lethuillier, L. Mirabito, S. Perries, A. Popov13, V. Sordini, G. Touquet, M. Vander Donckt, S. Viret
Georgian Technical University, Tbilisi, Georgia
T. Toriashvili14
Tbilisi State University, Tbilisi, Georgia
Z. Tsamalaidze8
RWTH Aachen University, I. Physikalisches Institut, Aachen, Germany
C. Autermann, L. Feld, M.K. Kiesel, K. Klein, M. Lipinski, M. Preuten, M.P. Rauch, C. Schomakers, J. Schulz, M. Teroerde, B. Wittmer, V. Zhukov13
RWTH Aachen University, III. Physikalisches Institut A, Aachen, Germany
A. Albert, D. Duchardt, M. Endres, M. Erdmann, S. Erdweg, T. Esch, R. Fischer, S. Ghosh, A. G ¨uth, T. Hebbeker, C. Heidemann, K. Hoepfner, H. Keller, L. Mastrolorenzo,
U. Behrens, A. Berm ´udez Mart´ınez, D. Bertsche, A.A. Bin Anuar, K. Borras16, V. Botta, A. Campbell, P. Connor, C. Contreras-Campana, V. Danilov, A. De Wit, M.M. Defranchis, C. Diez Pardos, D. Dom´ınguez Damiani, G. Eckerlin, T. Eichhorn, A. Elwood, E. Eren, E. Gallo17, A. Geiser, A. Grohsjean, M. Guthoff, M. Haranko, A. Harb, J. Hauk, H. Jung, M. Kasemann, J. Keaveney, C. Kleinwort, J. Knolle, D. Kr ¨ucker, W. Lange, A. Lelek, T. Lenz, J. Leonard, K. Lipka, W. Lohmann18, R. Mankel, I.-A. Melzer-Pellmann, A.B. Meyer, M. Meyer, M. Missiroli, G. Mittag, J. Mnich, V. Myronenko, S.K. Pflitsch, D. Pitzl, A. Raspereza, M. Savitskyi, P. Saxena, P. Sch ¨utze, C. Schwanenberger, R. Shevchenko, A. Singh, H. Tholen, O. Turkot, A. Vagnerini, G.P. Van Onsem, R. Walsh, Y. Wen, K. Wichmann, C. Wissing, O. Zenaiev
University of Hamburg, Hamburg, Germany
R. Aggleton, S. Bein, L. Benato, A. Benecke, V. Blobel, T. Dreyer, E. Garutti, D. Gonzalez, P. Gunnellini, J. Haller, A. Hinzmann, A. Karavdina, G. Kasieczka, R. Klanner, R. Kogler, N. Kovalchuk, S. Kurz, V. Kutzner, J. Lange, D. Marconi, J. Multhaup, M. Niedziela, C.E.N. Niemeyer, D. Nowatschin, A. Perieanu, A. Reimers, O. Rieger, C. Scharf, P. Schleper, S. Schumann, J. Schwandt, J. Sonneveld, H. Stadie, G. Steinbr ¨uck, F.M. Stober, M. St ¨over, A. Vanhoefer, B. Vormwald, I. Zoi
Karlsruher Institut fuer Technologie, Karlsruhe, Germany
M. Akbiyik, C. Barth, M. Baselga, S. Baur, E. Butz, R. Caspart, T. Chwalek, F. Colombo, W. De Boer, A. Dierlamm, K. El Morabit, N. Faltermann, B. Freund, M. Giffels, M.A. Harrendorf, F. Hartmann15, S.M. Heindl, U. Husemann, F. Kassel15, I. Katkov13, S. Kudella, H. Mildner, S. Mitra, M.U. Mozer, Th. M ¨uller, M. Plagge, G. Quast, K. Rabbertz, M. Schr ¨oder, I. Shvetsov, G. Sieber, H.J. Simonis, R. Ulrich, S. Wayand, M. Weber, T. Weiler, S. Williamson, C. W ¨ohrmann, R. Wolf
Institute of Nuclear and Particle Physics (INPP), NCSR Demokritos, Aghia Paraskevi, Greece
G. Anagnostou, G. Daskalakis, T. Geralis, A. Kyriakis, D. Loukas, G. Paspalaki, I. Topsis-Giotis
National and Kapodistrian University of Athens, Athens, Greece
G. Karathanasis, S. Kesisoglou, P. Kontaxakis, A. Panagiotou, I. Papavergou, N. Saoulidou, E. Tziaferi, K. Vellidis
National Technical University of Athens, Athens, Greece
K. Kousouris, I. Papakrivopoulos, G. Tsipolitis
University of Io´annina, Io´annina, Greece
I. Evangelou, C. Foudas, P. Gianneios, P. Katsoulis, P. Kokkas, S. Mallios, N. Manthos, I. Papadopoulos, E. Paradas, J. Strologas, F.A. Triantis, D. Tsitsonis
MTA-ELTE Lend ¨ulet CMS Particle and Nuclear Physics Group, E ¨otv ¨os Lor´and University, Budapest, Hungary
M. Bart ´ok19, M. Csanad, N. Filipovic, P. Major, M.I. Nagy, G. Pasztor, O. Sur´anyi, G.I. Veres
Institute of Physics, University of Debrecen, Debrecen, Hungary
P. Raics, Z.L. Trocsanyi, B. Ujvari
Indian Institute of Science (IISc), Bangalore, India
S. Choudhury, J.R. Komaragiri, P.C. Tiwari
National Institute of Science Education and Research, HBNI, Bhubaneswar, India
S. Bahinipati22, C. Kar, P. Mal, K. Mandal, A. Nayak23, D.K. Sahoo22, S.K. Swain
Panjab University, Chandigarh, India
S. Bansal, S.B. Beri, V. Bhatnagar, S. Chauhan, R. Chawla, N. Dhingra, R. Gupta, A. Kaur, M. Kaur, S. Kaur, R. Kumar, P. Kumari, M. Lohan, A. Mehta, K. Sandeep, S. Sharma, J.B. Singh, A.K. Virdi, G. Walia
University of Delhi, Delhi, India
A. Bhardwaj, B.C. Choudhary, R.B. Garg, M. Gola, S. Keshri, Ashok Kumar, S. Malhotra, M. Naimuddin, P. Priyanka, K. Ranjan, Aashaq Shah, R. Sharma
Saha Institute of Nuclear Physics, HBNI, Kolkata, India
R. Bhardwaj24, M. Bharti24, R. Bhattacharya, S. Bhattacharya, U. Bhawandeep24, D. Bhowmik, S. Dey, S. Dutt24, S. Dutta, S. Ghosh, K. Mondal, S. Nandan, A. Purohit, P.K. Rout, A. Roy, S. Roy Chowdhury, G. Saha, S. Sarkar, M. Sharan, B. Singh24, S. Thakur24
Indian Institute of Technology Madras, Madras, India
P.K. Behera
Bhabha Atomic Research Centre, Mumbai, India
R. Chudasama, D. Dutta, V. Jha, V. Kumar, P.K. Netrakanti, L.M. Pant, P. Shukla
Tata Institute of Fundamental Research-A, Mumbai, India
T. Aziz, M.A. Bhat, S. Dugad, G.B. Mohanty, N. Sur, B. Sutar, RavindraKumar Verma
Tata Institute of Fundamental Research-B, Mumbai, India
S. Banerjee, S. Bhattacharya, S. Chatterjee, P. Das, M. Guchait, Sa. Jain, S. Karmakar, S. Kumar, M. Maity25, G. Majumder, K. Mazumdar, N. Sahoo, T. Sarkar25
Indian Institute of Science Education and Research (IISER), Pune, India
S. Chauhan, S. Dube, V. Hegde, A. Kapoor, K. Kothekar, S. Pandey, A. Rane, S. Sharma
Institute for Research in Fundamental Sciences (IPM), Tehran, Iran
S. Chenarani26, E. Eskandari Tadavani, S.M. Etesami26, M. Khakzad, M. Mohammadi Na-jafabadi, M. Naseri, F. Rezaei Hosseinabadi, B. Safarzadeh27, M. Zeinali
University College Dublin, Dublin, Ireland
M. Felcini, M. Grunewald
INFN Sezione di Baria, Universit`a di Barib, Politecnico di Baric, Bari, Italy