459
Seismic performance of an existing low-rise RC building considering the
addition of a new storey
Baris Gunes
(Main author)Istanbul University-Cerrahpasa, Department of Civil Engineering 34320, Istanbul (Turkey)
Turgay Cosgun
Istanbul University-Cerrahpasa, Department of Civil Engineering, 34320, Istanbul (Turkey)
Baris Sayin
(Corresponding author)Istanbul University-Cerrahpasa, Department of Civil Engineering, 34320, Istanbul (Turkey)
Atakan Mangir
Istanbul Medipol University, School of Engineering and Natural Sciences 34810, Istanbul (Turkey) [email protected] Manuscript Code: 1291 Date of Acceptance/Reception: 29.11.2019/03.01.2019 DOI: 10.7764/RDLC.18.3.459 Abstract
In low-rise reinforced concrete (RC) buildings, structural design is generally performed considering the seismic effects as well as the vertical loads. However, there may be situations where the additional or unpredicted loads may be encountered during the service life of the buildings. The loads that are governed from a new storey addition during the service life is a good example for these additional loads. Since the reconstruction permits and building height limits specified by the authorities may vary in life-cycle of the structures, it is critical to decide the addition of a storey to an existing building considering the structural safety concerns. In this study, an existing low-rise RC building is modelled with an added storey (subsequently planned for construction), and numerical analyses are carried out considering the extra loads of this additional storey. The aim is to evaluate the seismic performance of the structure considering this unpredicted situation which was not taken into account in the original structural design. The suitability of the preliminary structural design project to the existing building was checked by the site investigations. The results of the numerical analysis were compared with the seismic code requirements, and the seismic performance level of the building is determined. The study is intended to be useful in determining the path to be followed for the determination of the seismic capacity if existing buildings are subjected to additional loads.
Keywords: RC buildings, storey addition, seismic performance
Introduction
Various parameters are considered in seismic codes in order to determine the structural performance of the newly constructed reinforced concrete (RC) buildings. On the other hand, different parameters are used to determine the structural performance of existing RC buildings. The aim is to achieve one of the three results provided in the following sentence by the seismic assessment and numerical analyses conducted considering these parameters: i. Sufficient seismic capacity in its current form, ii. Sufficient seismic capacity if the structure is strengthened, iii. Insufficient seismic capacity and unsuitable for strengthening. The seismic performance of the existing buildings in the Turkish Earthquake Code (TEC, 2007) is associated with the structural behaviour of the building under seismic effects and is defined based on different damage cases. In this context, one of the linear or nonlinear calculation methods is selected for the analysis and assessment procedures. Then the element damage levels are defined, and seismic performance level of the building is determined. Based on the probability of exceedance of the earthquake and the purpose of occupancy of the building, the performance targets are foreseen, and the performance level is obtained for both orthogonal directions.Many researchers have conducted studies to investigate the seismic performance of existing RC buildings (Jalayer et al., 2010; Mazza, 2014; Wahyuni, 2015; Kocak et al., 2015; Melani et al., 2016; Combescure & Wang, 2007; Mosleh et al., 2016; Ghobarah et al., 1998; Repapis et al., 2006a; Repapis et al., 2006b; Cherifi et al., 2015; Qian & Fengge, 2001; Halder & Paul, 2016; Chaulagain et al., 2013; Sobaih & Nazif, 2012). Wahyuni (2015) presented the evaluation of the
460 vulnerability of RC buildings against earthquake loads. This study was conducted to find out the behaviour of damage and deviation that occurred in the case study based on numerical analysis. By comparing the test and numerical analysis results of the buildings, the analyses were used to make a recommendation whether the building was still in a state of immediate occupancy, life safety, or collapse prevention. Melani et al. (2016) performed the seismic evaluation of typical low-rise RC frames. Three frames were analysed with capacity design concepts considering shear capacity, flexural capacity and contribution of floor reinforcement and beams. Maximum inter-storey drift ratios obtained from time-history analyses are plotted against ground motion intensities. Mosleh et al. (2016) presented the application and methodology for the seismic assessment of existent real buildings. In this research, two existing reinforced concrete buildings which were designed with the older design codes are chosen and analysed by pushover and time history analysis methods in longitudinal and transverse directions. The seismic vulnerability was evaluated considering the earthquakes with different return periods, and the seismic demands were compared with the limits proposed in international codes, and the conclusions are drafted regarding safety. Cherifi et al. (2015) aimed to estimate the seismic vulnerability of the existing buildings. For this purpose, capacity curves are developed for the RC buildings using pushover analysis method. Halder & Paul (2016) evaluated the seismic vulnerability of low-rise RC frame building that is designed for gravity loads according to the earthquake code. The nonlinear static analysis is performed to find the capacity curve of the building. The result shows that the damage of considered building varies from moderate to severe damage state for the corresponding different seismic hazard levels. Chaulagain et al. (2013) studied the seismic performance of an existing building. The seismic behaviour of four different three-storey RC residential buildings was considered to achieve this goal. The structures were subjected to static pushover analysis with different loading patterns as triangular, uniformly and the first mode distributed loading. Besides, adaptive pushover analysis and non-linear dynamic time history analysis were also performed. Sobaih et al. (2012) specified an essential step for the required strategy to evaluate the seismic vulnerability of existing RC buildings on the national level. A proposed methodology is presented for that purpose by developing qualitative norms for factors that supposed to have a significant effect on the seismic behaviour of the buildings.
Barbosa et al. (2017) conducted on field surveys for medium-to-high rise reinforced concrete (RC) frame buildings with masonry infill. In this scope, rapid visual assessment, ambient vibration testing, and ground-based lidar showed that these buildings suffered damage ranging from light to severe, where the damage occurred in both structural and non-structural elements, but was most prevalent in non-non-structural masonry infills. Finite-element non-structural analyses of selected buildings corroborate field observations of only modest structural damage. The lack of severe structural damage in this relatively limited class of engineered medium-to-high rise RC infill frame buildings illustrates the impact of modern seismic design standards and stands in stark contrast to the severe damage and collapse observed in low-rise nonengineered RC infill frame buildings. Adhikari et al. (2019) presented a seismic capacity assessment for representative low-to-medium rise RC buildings in Nepal. The structural behaviour of buildings was studied with different analysis techniques and loading considerations. Gautam et al. (2016) presented the commonly observed failure patterns in the buildings of Nepal after Mw 7.8 Gorkha (Nepal) earthquake. Several types of damage patterns were observed for reinforced concrete buildings, as well as for unreinforced masonry and adobe houses during the reconnaissance survey performed immediately after the earthquake of 25 April 2015. Gautama & Chaulagain (2016) outlined the summaries of significant world earthquakes and 1934 and 1988 earthquakes in Nepal with special focus on structural performance and associated casualties and drew comparisons with significant world earthquakes to infer the lessons to be learned by Nepal for improving the performance of structures in case of future earthquakes in Nepal. Sezen et al. (2003) described the state-of-practice for building seismic design and construction in Turkey and compares the US and Turkish codes. The performance of the reinforced concrete frame and wall buildings and their components during the 1999 Kocaeli earthquake is presented and evaluated considering the seismic design and construction practice in the epicentral region. Elwood & Moehle (2006) developed an idealised backbone model defining the key damage states of an existing reinforced concrete column (flexural yielding, shear failure, and axial load failure) using drift capacity models. Assumptions and limitations of the drift capacity models are discussed. To demonstrate the application of the idealised backbone model to the evaluation of existing reinforced concrete columns, the model is compared to data from shake table tests and measured drifts from an instrumented building damaged during the Northridge earthquake. In the study, the results from the backbone model are also compared with modelling parameters recommended in current seismic rehabilitation guidelines. Kakavand et al. (2018) performed pushover analyses of four RC frames. The comparison of numerical and experimental results demonstrates the capability of refined FE-models to capture the lateral load-carrying capacity as well as the location and evolution of concrete damage very well. Kakavand & Mohammadi (2018) focused on fragility assessment of the buildings emphasising on shear-axial failure using two well-established methods; empirical limit state material versus ASCE/SEI 41-13 recommendations. To this aim, 2D reinforced concrete models (3 and 5-storey) according to typical detail of existing buildings in Iran were modelled using two aforementioned modelling approaches and analysed under monotonic analysis and incremental dynamic analysis (IDA). In the following, seismic fragility assessment was carried out through the obtained results from IDA. The results of fragility curves showed that collapse capacity of buildings modelled by ASCE/SEI 41-13 is more than the empirical
461 method, and fewer cases can pass the level of safety probability of failure suggested by ASCE/SEI-41. Kakavand & Allahvirdizadeh (2019) presented a comprehensive database for RC columns, which includes 196 experiments for column failure in flexure and shear, which the latter is further categorized into two failure mode subsets, i.e., flexure-shear and flexure-shear, and fifty experiments for column failure in the axial failure mode.
In the present study, the seismic performance of an existing RC building is investigated in the scope of field studies, laboratory tests and numerical analysis. The building is modelled with the subsequently added storey, and numerical analyses are carried out considering the extra loads of this additional storey which were not considered in the preliminary structural design. Firstly, structural material strengths (concrete & rebar steel) and soil properties are defined based on the existing data. In the second stage, the numerical analyses are performed by using non-linear pushover analysis method in MIDAS GEN (2020) software, and the seismic performance of the building is determined.
Description of the problem
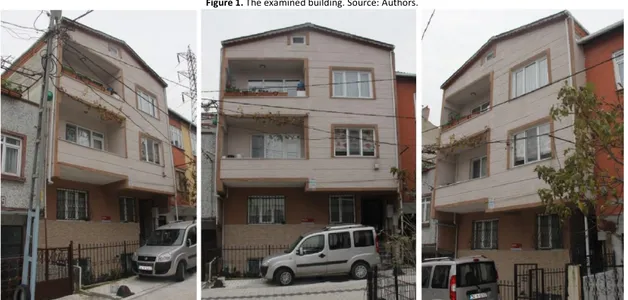
In this study, the change in the performance of the structures exposed to the extra loads which were not taken into consideration during the design stage is investigated under the vertical and seismic loads. As an example of this situation, the problems that may be encountered and the issues that need to be examined when a new storey is added to the existing structure shown in Figure 1 are presented. There was a demand to add an additional storey on the existing building as the local authorities increased the building height limit in the region. Within the scope of the study, firstly, field studies were carried out for the current state of the building, and structural design projects and calculations were examined. And then the structural performance of the building under the vertical and seismic loads was determined considering both the original state of the building and the addition of a new storey. The examined building was built in 2006 (Soylemez, 2006).Figure 1. The examined building. Source: Authors.
The building has an RC frame system and consists of four-storeys including basement, ground and two standard storeys. The building has a regular geometry in layout, having 8 m 10.5 m dimensions covering 84 m2 of a residing area (Figure 2). The storey heights are 2.8 m. at the basement, 2.75 m at the ground, first and second storeys. Site investigations have shown that the locations and dimensions of the structural members are consistent with the original structural design project. It is seen by the site observations that there were no structural cracks or damages on the structural members. Table 1 shows the dimensions of the structural members and rebar arrangement specified in the project.
Table 1. Dimensions and rebar arrangement of the structural members. Source: Karakas (2005).
Basement wall Column Beam Slab
Dimensions 20, 25 cm thickness 3030, 3040, 3050, 3090 cm 2550 cm 12, 12.5 cm thickness Longitudinal reinforcement (diameter) 12 16 14, 16 8, 10, 12 Lateral reinforcement (diameter/spacing) 10/15 10/10-15 8/11-20 -
462 Figure 2. The elevation view (left) and the basement floor plan (right) of the building. Source: Karakas (2005).
Methods and materials
Modelling
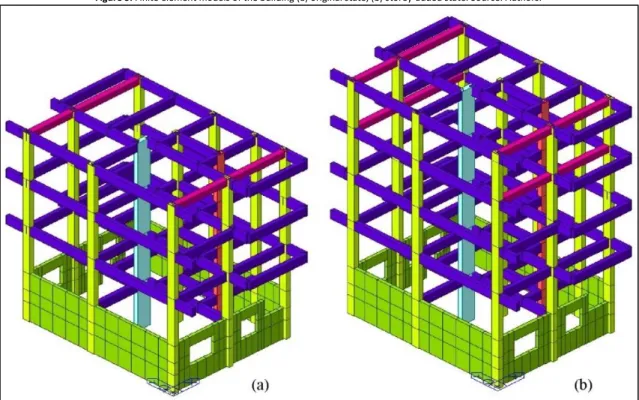
There are several analysis methods to obtain the non-linear behaviour of structures in which the geometric and material non-linearity concepts are considered with the developing computing technology. As one of the mentioned methods, the finite element method is an effective analysis method in determining the structural behaviour of reinforced concrete structures under vertical and seismic loads, and accordingly, the seismic performance level. In the presented work, finite element analyses are carried to determine the seismic performance of the example building considering both the original state of the building and the addition of a new storey. MIDAS GEN (2020) finite element software is used in the analyses. In the modelling phase, 2D shell elements are used for the basement walls, and 1D frame elements are used for the columns and beams. In Figure 3, the finite element analysis models of the building for the original state and the storey-added state are presented.
463
Materials
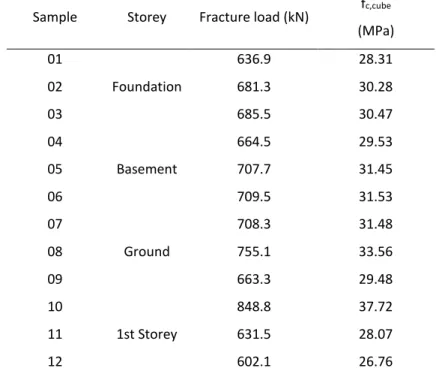
The laboratory work that carried out during the construction phase of the building is considered in the determination of concrete compressive strength and rebar steel strength (Soylemez, 2006). According to this data, concrete compressive strength values of twelve cubic samples are obtained to determine the average compressive strength of 28 days for the concrete (Table 2). The concrete compressive strength is found by the recommendations given in the related code. The concrete compressive strength and the modulus of elasticity are obtained as 23.78 MPa and 29847 MPa, respectively (Table 3) using these field data. The results of the existing laboratory test results are used in assigning the rebar properties. Thus, the quality class of longitudinal rebar and stirrups are determined as S420 class steel (Soylemez, 2006).
Table 2. Results of concrete compressive strength test values. Source: Soylemez (2006). Sample Storey Fracture load (kN) fc,cube
(MPa) 01 Foundation 636.9 28.31 02 681.3 30.28 03 685.5 30.47 04 Basement 664.5 29.53 05 707.7 31.45 06 709.5 31.53 07 Ground 708.3 31.48 08 755.1 33.56 09 663.3 29.48 10 1st Storey 848.8 37.72 11 631.5 28.07 12 602.1 26.76
Table 3. The evaluation of concrete compressive strength. Source: Authors.
fc,cube,av. (1) fc,cube = fc,cube,av fc,cyl = 0.85fc,cube *Ec
30.72 2.75 27.97 23.78 29847
(1) All units: MPa, : standard deviation, Ec: young’s modulus of concrete
The material properties of the existing storeys and the additional storey of the building are given together in Table 4. In the analysis model, the unconfined concrete strength of the existing storeys and the added storey are defined as 23.78 MPa and 30.00 MPa, respectively. The steel class of rebars for both the existing storeys and the added storey are defined as S420 class steel.
Table 4. Material properties of concrete and rebars. Source: Authors.
Properties Concrete Existing storeys Concrete Added storey Rebars All storeys Concrete strength, 𝑓𝑐′ 23.78 30 – Yield strength, 𝑓𝑦 – – 420 Ultimate strength, 𝑓𝑢 – – 500 Elastic modulus, 𝐸 29847 32000 200000 Units: MPa
464
Performance analysis
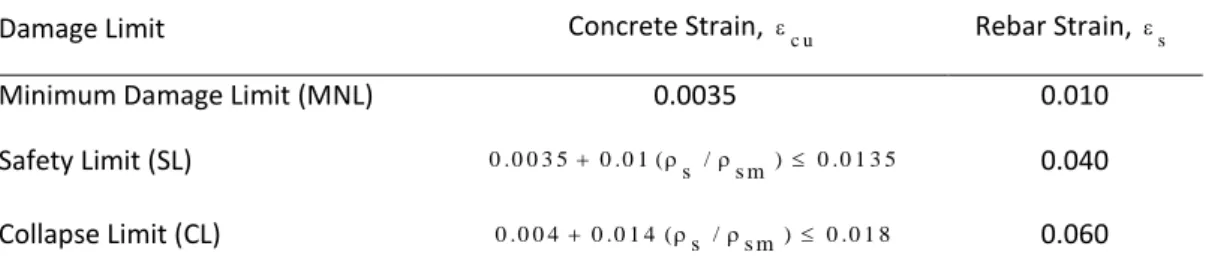
There are several calculation methods and criteria in the international codes and standards related to the evaluation of the seismic performance of existing RC buildings. The seismic performance evaluation of the examined RC building presented in this study is done through the recommendations given in the Turkish Earthquake Code (TEC, 2007). In the performance analysis section of this regulation, three damage limits are defined at the cross-section level for ductile structural members, as the Minimum Damage Limit (MNL), Safety Limit (SL), and Collapse Limit (CL). Minimum Damage Limit defines the onset of inelastic behaviour at a cross-section. Safety Limit defines the limit of the inelastic behaviour that the cross-section can safely provide its strength. Collapse Limit defines the limit of the pre-collapse behaviour of the section. The strain limit values correspond to these damage limits are presented in Table 5. Four damage states (regions) are also defined in the code for the ductile structural members. If the damage of a member’s critical section does not reach MNL, the member is assumed in the “Minimum Damage” region. The ones between MNL and SL are assumed in the “Significant Damage” region, and the ones between SL and CL are assumed in the “Advanced Damage” region. If the damage of a member’s critical section exceeds CL, the member is assumed in the “Collapse” region (Figure 4). Brittle members are not permitted to exceed Minimum Damage Limit and accordingly to be in “Significant Damage” region. The target performance levels of the buildings with their purpose of use according to TEC (2007) are presented in Table 6. The examined RC building should satisfy the “Life Safety” performance level considering the earthquake having 10% probability of exceedance in 50 years.
Table 5. The strain limits defined for the RC members. Source: TEC (2007)
Damage Limit Concrete Strain, c u Rebar Strain, s
Minimum Damage Limit (MNL) 0.0035 0.010
Safety Limit (SL) 0 .0 0 3 5 0 .0 1 ( / ) 0 .0 1 3 5
s s m
0.040
Collapse Limit (CL) 0 .0 0 40 .0 1 4 (s /s m) 0 .0 1 8 0.060
s
volumetric ratio of the existing lateral reinforcement of a section.
s m
volumetric ratio of the required lateral reinforcement of a section according to TEC (2007).
Figure 4. Damage limits and regions of ductile members. Source: TEC (2007).
Table 6. Building performance targets anticipated for different earthquake levels. Source: TEC (2007)
The usage purpose and the type of building
Probability for the earthquake to be exceeded in 50 years
50% 10% 2%
The buildings that should be used after earthquakes - RU LS
The buildings that people stay in for a long-time period - RU LS The buildings that people visit densely and stay in for a short time period RU LS -
Buildings containing hazardous materials - RU PC
Other buildings - LS -
465 According to TEC (2007), the structural members in the reinforced concrete buildings are classified in two parts as vertical members (columns, shear walls) and lateral members (beams). For the earthquake having 10% probability of exceedance in 50 years, the conditions that these vertical and lateral members must satisfy individually and on a storey basis are given below.
In any storey, for each earthquake direction separately, maximum 30% of the beams can be in “Advanced Damage” region.
In any storey, the total contribution of the vertical members in “Advanced Damage” region to the total storey-shear must not exceed 20%.
In any storey, the ratio of the shear force carried by the vertical members in which the MNL is exceeded at both their top and bottom sections to the total storey-shear must not exceed 30%.
There should be no brittle damaged members in the building.
In order to use in the performance analysis according to TEC (2007), the information level of the related building is selected as the “medium-level”, and the allowable stress/strength values of the walls are decreased with “0.90” coefficient concerning the selected information level.
Two different methods as linear and nonlinear are defined in TEC (2007) to determine the seismic performance level of structures. The nonlinear analysis is an effective analysis method in which the geometric and material nonlinearity concepts are considered. The behaviour of the structure under seismic loads can be obtained more realistically with this method. The nonlinear analysis method can be performed in two ways as the static pushover analysis and time-history analysis. In this study, static pushover analyses are performed for the original state and storey-added state of the examined building.
The nonlinear static analysis under incrementally increasing lateral forces distributed considering the dominant mode shapes in the specific earthquake direction. Lateral forces are increased until the earthquake displacement demand is reached. The capacity diagram (base shear – control point (roof) displacement) is gathered from the incremental analysis. Then, the coordinates of this plane are transformed into “spectral acceleration – spectral displacement”. Finally, the modal linear elastic displacement demand and the inelastic displacement demand are found and converted to the modal displacement demand (performance point) by an iterative formulation presented in the Section 7C of TEC (2007) code.
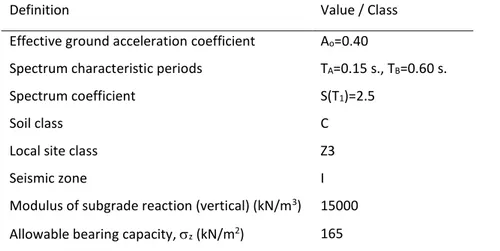
The seismic analysis and soil parameters (Table 7) used in the numerical analyses of the examined structure are specified in compliance with the current seismic code (TEC, 2007) considering the characteristics of the structure and the region, and the study of Guzey & Kaya (2005).
Table 7. The seismic and soil parameters used in the numerical analyses. Source: Guzey & Kaya (2005).
Definition Value / Class
Effective ground acceleration coefficient Ao=0.40
Spectrum characteristic periods TA=0.15 s., TB=0.60 s.
Spectrum coefficient S(T1)=2.5
Soil class C
Local site class Z3
Seismic zone I
Modulus of subgrade reaction (vertical) (kN/m3) 15000 Allowable bearing capacity, z (kN/m2) 165
It is aimed to determine the effect of adding a new storey to the existing building on structural performance. Accordingly, for both cases, (i) Static analysis under vertical loads, (ii) Modal analysis, (iii) Pushover analysis, and (iv) Foundation analysis are performed. The effect of the storey addition on the existing building in terms of structural performance is revealed by the comparison of obtained results.
466
Results and discussion
Static analysis under vertical loads
In this section, the static analysis of the examined building under vertical loads is performed considering its original state and the storey-added state. In addition to the building’s self-weight, 1.5 kN/m2 of dead load (floor covering) and 2.0 kN/m2 of live load are applied to the structure in accordance with TS498 (1997). Total weight of the original state of the building (the sum of dead and live loads) is 630 tons. In the storey-added case, the total weight of the building is increased to 732 tons where the addition brings 16% of an extra load to the structure.
Figure 5 shows the axial forces in the columns for the original and storey-added states of the structure. In the original state, the load level of the column with the highest axial load is 694 kN, whereas in the storey-added state it is 822 kN at the same column. The axial pressure on this column increased by 18%.
Figure 5. Axial load on columns considering the (a) original state and the (b) storey-added state. Source: Authors.
Modal analysis
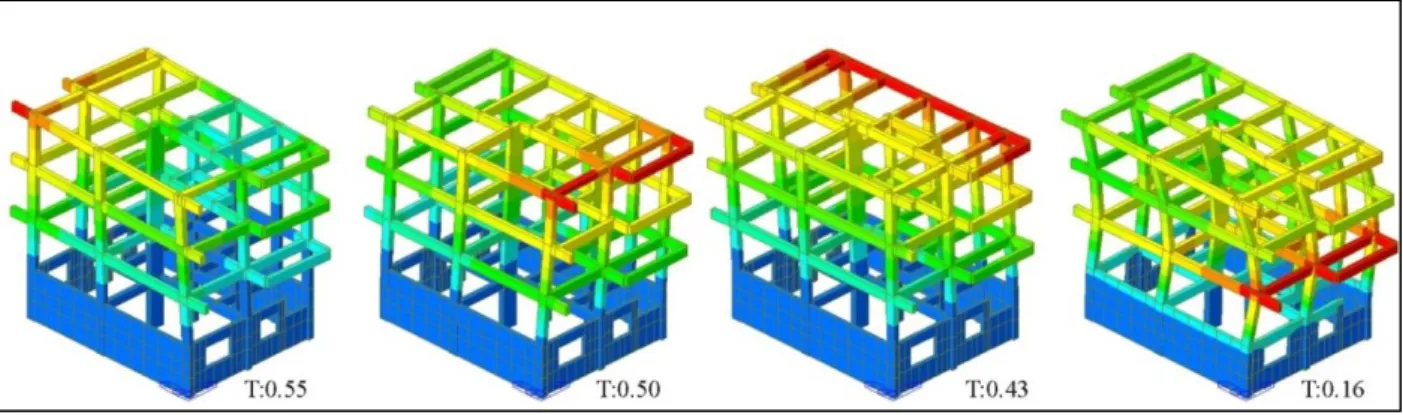
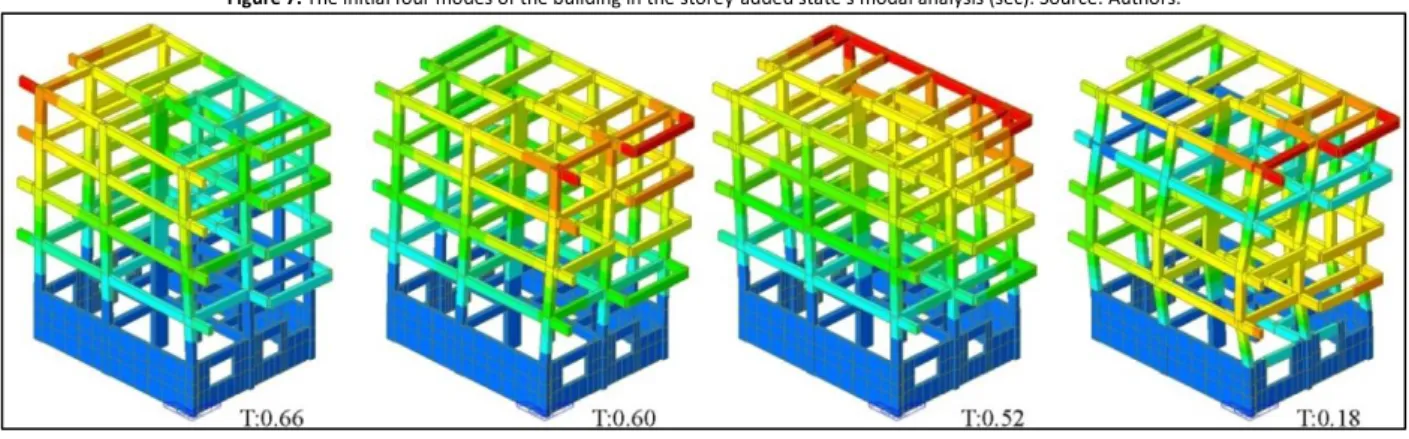
In this section, the modal analysis results of the examined building and comparisons made considering its original state and the storey-added state are presented. The initial four mode shapes of the original and the storey-added states of the building are presented in Figure 6 and Figure 7, respectively. The addition of a new storey to the structure did not result in a significant change on the mode shapes of the structure, but the period at the same mode increased by about 20%.
467 Figure 7. The initial four modes of the building in the storey-added state’s modal analysis (sec). Source: Authors.
Pushover analysis
In this section, the pushover analysis of the examined building in +X, -X, +Y and -Y directions is performed to determine the seismic behaviour of its original state and the storey-added state. Midas GEN (2020) software is used in the analyses, and the geometric and material nonlinearity concepts are considered. Mander (1988)’s confined concrete material model is used in order to define the nonlinear behaviour of concrete (Figure 8). In this model, the confinement conditions are provided by defining the longitudinal and lateral reinforcements of columns and beams in the software. The confinement effect is neglected and unconfined concrete material model of Mander (1988) is used in the investigations related to shear failure. The Menegotto-Pinto (1973) steel material model is used to define the nonlinear behaviour of rebars.
In the analyses, distributed fibre hinges are defined on columns, and lumped moment-rotation hinges which consider only bending in vertical direction are defined on beams. No hinges are defined for the reinforced concrete basement walls. Modelling of structural members with fibre hinges is a quite effective modelling method used in the nonlinear analysis. In the experimental study of Keun-Ho (2004), the seismic behaviour of an RC Pier is investigated. When the same RC Pier is modelled by fibre hinges and analysed with Midas GEN software, it is observed that the obtained results are very consistent with the experimental results (Midas, 2005).
Figure 8. Mander (1988) confined concrete material model parameters. Source: Midas Gen (2020).
Pushover loading is applied in two phases. Firstly, “Response Spectrum Loading” is performed by considering the effective modes (which provide 90% mass participation rate) in the examined direction (+X, -X, +Y or -Y). Then, the “Response Spectrum Inertia Forces” obtained as a result of this analysis are converted to static loads and applied to the structure as the initial loading of pushover analysis (Midas Gen, 2020).
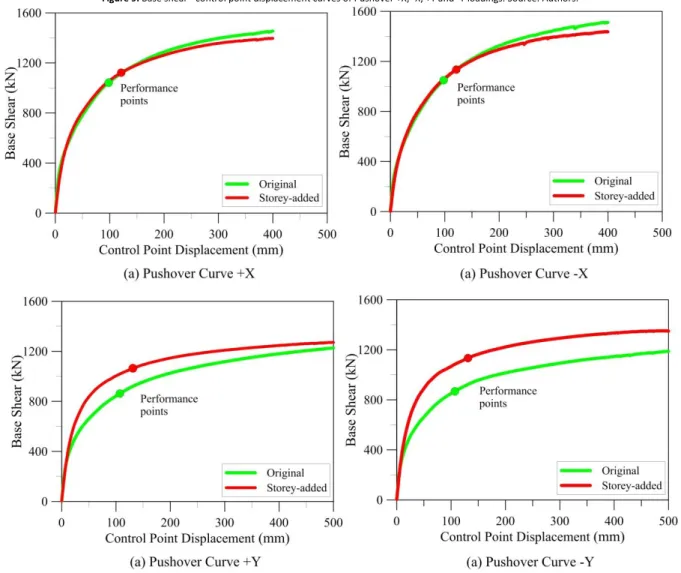
In Figure 9, base shear - control point displacement graphs under Pushover +X, -X, +Y and -Y loading for the original state and storey-added state of the structure are presented. The performance analyses of the original state and storey-added state of the building are carried out based on the control point (roof) displacements shown in Figure 9 and Figure 10. Pushover analysis is applied up to the displacement values beyond the performance point in order to observe the global structural behaviour of the structure. It is observed on these graphs that the base shear - control point displacement
468 curves are compatible with each other during loading under Pushover +X and -X load cases. Addition of a storey on the structure did not cause a significant difference in the curves of +X and -X directions. On the other hand, under the Pushover +Y and -Y load cases, while the base shear - control point displacement curves of the structure are compatible with each other at the beginning, significant differences occurred in the later stages of the loading. Addition of a storey on the structure resulted in higher base shear forces for the same control point displacement. The performance points for both states are marked on the graphs. For the original state of the structure, the performance points in the Pushover +X and +Y directions are calculated as 98 and 107 mm, respectively. These values are found as 121 and 131 mm (Pushover +X and +Y) for the storey-added state of the structure. Addition of a storey on the structure increased the performance points of +X and +Y directions by 23% and 22%, respectively.
Figure 9. Base shear - control point displacement curves of Pushover +X, -X, +Y and -Y loadings. Source: Authors.
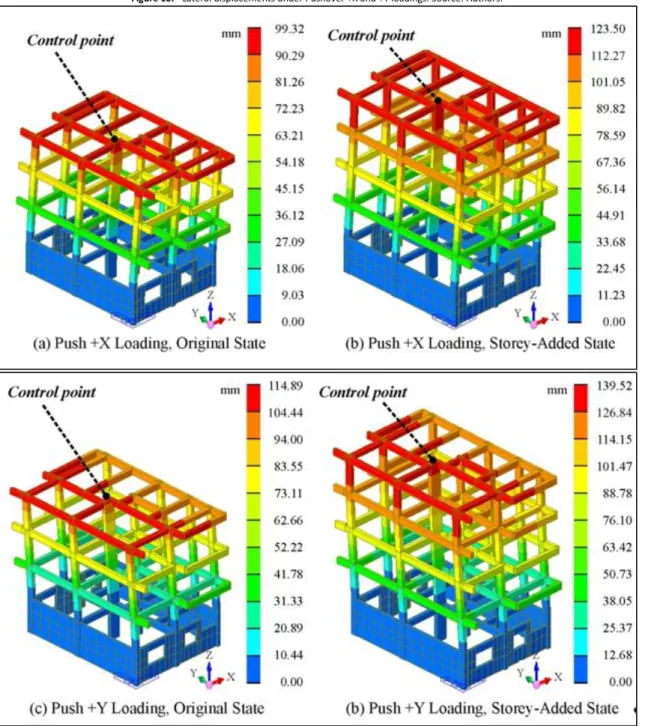
In Figure 10, the lateral displacements at the performance points related to Pushover +X and Pushover +Y loadings are presented. Figure 11 shows the spectral acceleration-spectral displacement curves of Pushover + X and +Y loadings for the original state and storey-added state of the structure. On these graphs, the seismic spectrum and modal displacement demand curves are presented in terms of spectral acceleration and spectral displacement.
469 Figure 10. Lateral displacements under Pushover +X and +Y loadings. Source: Authors.
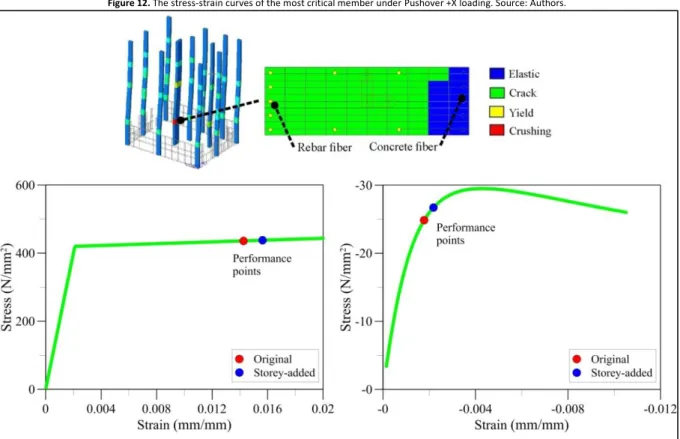
Figure 12 shows the stress-strain curves of the concrete and rebars in the most critical member under Pushover +X loading for the original state and storey-added state of the structure. The strain of rebar steel under Pushover +X loading in this member for the original state and storey-added state are obtained as 0.01426 and 0.01563 mm/mm, respectively. Addition of a storey on the structure caused an increase in the strain of the rebar by 9.6%. In the same member and same loading, the strain of concrete for the original state and storeyadded state are obtained as 0.001782 and -0.002181 mm/mm, respectively. Addition of a storey on the structure caused an increase in the strain of the concrete by 22.4%.
Figure 13 shows the stress-strain curves of the concrete and rebars in the most critical member under Pushover +Y loading for the original state and storey-added state of the structure. The strain of rebar steel under Pushover +Y loading in this member for the original state and storey-added state are obtained as 0.00427 and 0.00670 mm/mm, respectively. Addition of a storey on the structure caused an increase in the strain of the rebar by 56.9%. In the same member and same loading, the strain of concrete for the original state and storeyadded state are obtained as 0.001347 and -0.001718 mm/mm, respectively. Addition of a storey on the structure caused an increase in the strain of the concrete by 27.5%.
470 Figure 11. Spectral acceleration - spectral displacement curves of Pushover +X and +Y loadings. Source: Authors.
471 Figure 13. The stress-strain curves of the most critical member under Pushover +Y loading. Source: Authors.
It is determined that the vertical structural members on all storeys did not exceed the minimum damage limit and are in minimum damage region for X and Y earthquake directions. In other words, no vertical structural member is found to be in the significant damage, advanced damage or collapse regions. In all storeys, the primary beams are in minimum damage region in the X and Y earthquake directions. In other words, no primary beam is found to be in the significant damage, advanced damage or collapse regions. It is understood that the building’s seismic performance is sufficient regarding the seismic strength and ductility when an identical storey will be added on the existing building. Also, no shear critical structural element is observed at the performance point for both directions. The structural members ensure the safety concerning shear by satisfying the necessary conditions about brittle failure. As a result of the performance analyses carried out for the original state and storey-added state of the structure, the “Life Safety” performance level is ensured for both states, which is the target performance level considering the earthquake having 10% probability of exceedance in 50 years. The strains and their distribution on the reinforced concrete columns and beams satisfy the conditions are presented in Table 5.
Foundation analysis
The addition of a new storey on the examined building caused a change in the structural behaviour of the existing superstructure under vertical and seismic loads, as expected. It is clear that this change also has possible effects on the structural behaviour of the foundation and the soil stresses. The original state of the building has a raft foundation with 50 cm of thickness. The foundation of the building is modelled via Midas GEN software independently from the superstructure using 2D plate elements. Spring elements are defined under these plates to apply the rigidity of the soil. In the superstructure models created for the original and storey-added states of the structure, fixed supports are defined under (foundation level) the vertical structural members. The support reactions occurred as a result of Pushover +X, -X, +Y and -Y load cases are transformed (inverse signs), and applied on the foundation model. Finally, linear analysis is performed to evaluate the structural behaviour of the foundation and soil stresses.
In Figure 14, the distribution of soil stresses under the foundation as a result of Pushover +X and +Y load cases for both the original state and storey-added state of the structure are presented. The maximum soil stress under Pushover +X loading is found for the original state and the storey-added state as 203.25 and 255.18 kN/m2, respectively. The addition of a new storey on the structure caused an increase in the maximum soil stress value under the foundation by 25.5% due to the increased performance point. The maximum soil stress under Pushover +Y loading is found for the original state and storey-added state as 172.87 and 219.19 kN/m2, respectively. The addition of a new storey on the structure
472 caused an increase in the maximum soil stress value under the foundation by 26.7% due to the increased performance point. The allowable bearing capacity of the soil that the building is built on is 165 kN/m2. According to the design code, this limit value can be increased by 50% for the seismic load cases. Therefore, the allowable bearing capacity is calculated as “1.5x165=248 kN/m2”. Distribution of soil stresses under the foundation shows that occurred stresses are within the allowable limit in general, except some local stress concentrations which can be accepted at a permissible level of exceedance. Thus, it is concluded that, although the addition of a new storey on the structure mainly caused an increase in the soil stresses, the allowable bearing capacity of the soil is not exceeded.
In Figure 15, the moment distribution on the foundation as a result of Pushover +X and +Y load cases for both the original state and storey-added state of the structure are presented. The maximum moment under Pushover +X loading is found for the original state and storey-added state as 187.03 and 232.73 kNm, respectively. The addition of a new storey on the structure caused an increase in the maximum moment value on the foundation by 24.4% due to the increased performance point. The maximum moment under Pushover +Y loading is found for the original state and storey-added state as 204.28 and 243.36 kNm, respectively. The addition of a new storey on the structure caused an increase in the maximum moment value on the foundation by 19.1% due to the increased performance point. In the existing foundation, 16 mm diameter longitudinal rebars are used with 170 mm spacing. As a result of the reinforced concrete strength checks made for the original and storey-added states, the existing reinforcement configuration of the foundation is found to be sufficient. Thus, it is concluded that, although the addition of a new storey on the structure mainly caused an increase in the moments occurred on the foundation, the moment capacity of the foundation is not exceeded.
473 Figure 15. Moment distribution on the foundation as a result of Pushover +X and +Y loadings. Source: Authors.
Conclusions
In the present study, the effect of the addition of a new storey to an existing building which was not taken into account in the original structural design on the performance of the structure under vertical and seismic loads is evaluated. In this context, first of all, field studies are carried out for the original state of the building, and then the numerical analyses of the original and storey-added states of the building are performed. Accordingly, for both cases, (i) Static analysis under vertical loads, (ii) Modal analysis, (iii) Pushover analysis, and (iv) Foundation analysis are performed. The effect of the storey addition on the existing building in terms of structural performance is revealed by the comparison of obtained results. As a result of these analyses, it is concluded that the addition of a new storey on the existing building does not endanger the structural safety of this building.The addition of a new storey on the structure increased the vertical loads (dead + live loads) by 16%. Accordingly, the internal force of the column with the highest axial load increased by 18%. Although the storey addition did not result in a significant change on the mode shapes of the structure, the period at the same mode increased by about 20%. In order to determine the seismic performance of the original state and storey-added state of the structure, static pushover analysis is carried out considering the geometric and material nonlinearity concepts. The storey addition increased the performance points for +X and +Y directions by 23% and 22%, respectively. As a result of the performance analyses carried out for the original state and storey-added state of the structure, the “Life Safety” performance level is ensured for both states, which is the target performance level considering the earthquake having 10% probability of exceedance in 50 years. The strains occurred on the reinforced concrete columns and beams satisfy the necessary conditions of the design code, and no shear critical structural member is observed in the building.
Due to the increased performance point, the addition of a new storey on the structure caused an increase in the maximum soil stress values under the foundation for +X and +Y directions by 25.5% and %26.7, respectively. Therefore, the addition of a new storey on the structure caused an increase in the soil stresses, but the allowable bearing capacity of the soil is not exceeded. Similarly, the addition of a new storey on the structure caused an increase also in the maximum moment values on the foundation for +X and +Y directions by %24.4 and %19.1, respectively. Therefore, the
474 addition of a new storey on the structure caused an increase in the moments occurred on the foundation, but the moment capacity of the foundation is not exceeded.
Notation
The following symbols are used in this paper:
𝐴𝑜 = Effective ground acceleration coefficient E = Modulus of elasticity
𝐸𝑐 = Young’s modulus of concrete
R C = Reinforced Concrete L S = Life safety
P C = Pre-collapse R U = Ready for usage
M N L = Minimum Damage Limit
S L = Safety Limit C L = Collapse Limit
1S T = Spectrum coefficient
A B
T , T = Spectrum characteristic periods
c ,c u b e
f = Concrete compressive strength (cube)
c ,c u b e ,a v .
f = Average concrete compressive strength
c ,c y l
f = Concrete compressive strength (cylinder)
𝑓𝑐′ = Concrete strength
𝑓𝑦 = Rebar yield strength
𝑓𝑢 = Ultimate strength
s = Volumetric ratio of the existing lateral reinforcement of a section
sm = Volumetric ratio of the required lateral reinforcement of a section according to TEC (2007) c u = Concrete strain s = Rebar strain = Standard deviation z
= Allowable bearing capacity of the soil
References
Adhikari, A., Rao, K., Gautam, D. & Chaulagain, H. (2019). Seismic vulnerability and retrofitting scheme for low-to-medium rise reinforced concretebuildings in Nepal. Journal of Building Engineering, 21, 186-189. https://doi.org/10.1016/j.jobe.2018 .10.015.
Barbosa, A., Fahnestock, L., Fick, D., Gautam, D., Soti, R., Wood, R. & Rodrigues, H. (2017). Performance of Medium-to-High Rise Reinforced Concrete Frame Buildings with Masonry Infill in the 2015 Gorkha. Earthquake Spectra, 33(S1), 197-218.
Chaulagain, H., Rodrigues, H., Jara, J., Spacone, E. & Varum, H. (2013). Seismic response of current RC buildings in Nepal: A comparative analysis of different design/construction. Engineering Structures, 49, 284-294. https://doi.org/10.1016/ j.engstruct.2012.10.036.
Cherifi, F., Farsi , M.-N., Kaci, S., Belaidi, O. & Taouchei-Kheloui, F. (2015). Seismic Vulnerability of Reinforced Concrete Structures in Tizi-Ouzou City (Algeria). Procedia Engineering, 114, 838-45. https://doi.org/10.1016/j.proeng.2015.08.037 .
Combescure, D. & Wang, F. (2007). Assessment of existing RC structures under severe dynamic loading using non-linear modelling. CONSEC’07: Fifth
International Conference on Concrete under Severe Conditions Environment and Loading, (s. 1-10.). France.
Elwood, K. & Moehle, J. (2006). Idealized backbone model for existing reinforced concrete columns and comparisons with FEMA 356 criteria. The
Structural Design of Tall and Special Buildings, 15, 553–569. https://doi.org/10.1002/tal.382.
Gautam, D. & Chaulagain, H. (2016). Structural performance and associated lessons to be learned from world earthquakes in Nepal after 25 April 2015 (MW 7.8) Gorkha earthquake. Engineering Failure Analysis, 68, 222–243. http://dx.doi.org/10.1016/ j.engfailanal.2016.06.002.
Gautam, D., Rodrigues, H., Bhetwal, K., Neupane, P. & Sanada, Y. (2016). Common structural and construction deficiencies of Nepalese buildings.
Innovation Infrastructure Solutions, 1:1. https://doi.org 10.1007/s41062-016-0001-3.
Ghobarah, A., Aly, N. & El-Attar, M. (1998). Seismic reliability assessment of existing reinforced concrete buildings. Journal of Earthquake Engineering,
475 Guzey, S. & Kaya, A. (2005). Soil Site Survey and Evaluation Report. Istanbul: Güzey Ground Engineering and Consultancy.
Halder, L. & Paul, S. (2016). Seismic damage evaluation of gravity load designed low rise RC building using nonlinear static method. Procedia
Engineering, 144, 137313-80. https://doi.org/10.1016/j.proeng.2016.05.167.
Jalayer, F., Iervolino, I. & Manfredi, G. (2010). Structural modeling uncertainties and their influence on seismic assessment of existing RC structures.
Structural Safety, 32, 220-238. https://doi.org/10.1016/j.strusafe.2010.02.004 .
Kakavand, M. & Allahvirdizadeh, R. (2019). Enhanced empirical models for predicting the drift capacity of less ductile RC columns with flexural,shear, or axial failure modes. Frontiers of Structural and Civil Engineering, 13(5): 1251–1270. https://doi.org/10.1007/s11709-019-0554-2.
Kakavand, M. & Mohammadi, K. (2018). Seismic Fragility Assessment of Local and Global Failures in Low rise Non ductile Existing RC Buildings: Empirical Shear Axial Modelling vs. ASCE/SEI 41 Approach. Journal of Computational Engineering and Physical Modeling, 1-1, 38-57. http://dx.doi.org/10.22115/CEPM.2018.114549 .1008.
Kakavand, M., Neuner, M., Schreter, M. & Hofstetter, G. (2018). A 3D continuum FE-model for predicting the nonlinear response and failure modes of RC frames in pushover analyses. Bulletin of Earthquake Engineering, 16, 4893–4917. https://doi.org/10.1007/s10518-018-0388-7 . Karakas, B. (2005). Static project of the building. Istanbul: Uzay Engineering.
Keun-Ho, C. (2004). An Experimental and Analytical Study on the Seismic Behavior of RC Piers using High-Strength Concrete and High-Strength Rebars. Seoul National University.
Kocak, A., Zengin, B. & Kadioğlu, F. (2015). Performance assessment of irregular RC buildings with shear walls after Earthquake. Engineering Failure
Analysis, 55, 157-168. https://doi.org/10.1016/j.engfailanal.2015.05.016.
Mander, J., Priestley, M. & Park, R. (1988). Theoretical stress-strain model for confined concrete. Journal of Structural Engineering, 114, 8, 1804-1826. Mazza, F. (2014). Modelling and nonlinear static analysis of reinforced concrete framed buildings irregular in plan. Engineering Structures, 80, 98-108.
https://doi.org/ 10.1016/j.engstruct.2014.08.026 .
Melani, A., Khare, R., Dhakal, R. & Mander, J. (2016). Seismic risk assessment of low rise RC frame structure. Structures, 5, 13-22.
Menegotto, M. & Pinto, P. (1973). Method of Analysis for Cyclically Loaded Reinforced Concrete Plane Frames Including Changes in Geometry and Non-Elastic Behavior of Elements under Combined Normal Force and Bending. Proceedings, IABSE Symposium on Resistance and Ultimate
Deformability of Structures Acted on by Well Defined Repeated Loads, (s. 15-22). Lisbon.
Midas (2005). Verification Examples. Fiber Model Comparing with Experimental Results [1]29644.
Midas Gen (2020). Integrated Solution System for Building and General Structures. MIDAS Information Technology Co.
Mosleh, A., Rodrigues, H., Varum, H., Costa, A. & Arede, A. (2016). Seismic behavior of RC building structures designed according to current codes.
Structures, 7, 1-13. https://doi.org/10.1016/j.istruc.2016.04.001
Qian, T. & Fengge, J. (2001). Displacement-based seismic behavior evaluation for existing RC frame structures. Building Structure, 2001-07. Repapis, C., Vintzileou, E. & Zeris, C. (2006a). Evaluation of the seismic performance of existing RC buildings: I. Suggested Methodology. Journal of
Earthquake Engineering, 10, 265. https://doi.org/10.1080/13632460609350596
Repapis, C., Zeris, C. & Vintzileou, E. (2006b). Evaluation of the seismic performance of existing RC buildings: II. A case study for regular and irregular buildings. Journal of Earthquake Engineering, 10, 429-452. https://doi.org/10.1080/13632460609350604
Sezen, H., Whittaker, A., Elwood, K. & Mosalam, K. (2003). Performance of reinforced concrete buildings during the August 17, 1999 Kocaeli Turkey earthquake, and seismic design and construction practise in Turkey. Engineering Structures, 25, 103–114.
Sobaih, M. & Nazif, M. (2012). A proposed methodology for seismic risk evaluation of existing reinforced school buildings. HBRC Journal, 8(3),204-211. https://doi.org/10.1016/j.hbrcj.2012.10.006
Soylemez, C. (2006). Concrete test results. İstanbul: Uzman Laboratory.
TEC (2007). Turkish Earthquake Code: Specification for buildings to be built in earthquake regions. Ministry of Public Works and Settlement, Government of the Republic of Turkey, Ankara.
TS498 (1997). Design loads for buildings. Ankara: Turkish Standards Institute.
Wahyuni, E. (2015). Vulnerability Assessment of Reinforced Concrete Building Post-Earthquake. Procedia Earth and Planetary Science, 14, 76-82. https://doi.org/10.1016/j.proeps.2015.07.087