Beyond self-efficacy: Measuring pre-service teachers’ Instructional Technology
Outcome Expectations
Dale S. Niederhauser
a,*, Serkan Perkmen
ba
Center for Technology in Learning and Teaching, College of Human Sciences, Iowa State University, Ames, IA 50014, USA b
Balikesir University, Necatibey Faculty of Education, Department of Computer Education and Instructional Technologies, Balıkesir, Turkey
a r t i c l e
i n f o
Article history:
Available online 31 December 2009 Keywords: Outcome expectation Teacher preparation Computer attitude Instructional Technology
a b s t r a c t
The purpose of this study was to examine concurrent and construct validity for the Instructional Technol-ogy Outcome Expectation (ITOE) scale. Outcome expectation is an intrapersonal factor which influences individuals’ motivation. In the present study, we examined outcome expectation beliefs with regard to integrating technology into teaching practice. Findings revealed that outcome expectation is a multifac-eted construct consisting of three components (performance, self-evaluative and social outcome expec-tations), and that the ITOE scale shows good validity and psychometric properties. Use of the scale can help teacher educators and inservice providers more efficiently and effectively address outcome expec-tations as they help teachers integrate technology into their practice.
Ó 2009 Elsevier Ltd. All rights reserved.
1. Introduction
Significant efforts and resources have been expended in an at-tempt to integrate instructional uses of technology into US public schools since the early 1980s. Initial strategies included substantial investment of resources aimed at installing hardware and software in schools (Coley, Cradler, & Engel, 1997; Sivin-Kachala & Bialo, 2000), resulting in steady progress toward reducing student/com-puter ratios (Parsad & Jones, 2005). The basic premise in the early days of the integration movement seemed to be ‘‘Build it and they will come”; that is, if teachers were provided with access to com-puters, they would use it with their students. In hindsight, how-ever, access appeared to be a necessary, but not sufficient, condition for technology integration.
By the late 1980s it became clear that we had ignored a key fac-tor in the equation. Reports indicated that teachers were making limited use of the technologies available to them—in terms of both amount and nature of use (e.g.,Office of Technology Assessment, 1988). Teachers lacked basic skills in using the newly available technologies and, in response, a new wave of activity ensued that focused on teacher development. Most pre-service teacher prepa-ration programs provided an introductory course that devoted over 80% of a given class period to learning to use the computer (US Department of Education, 1986). For practicing teachers, profes-sional development typically involved participating in inservice training sessions and workshops (Glenn & Carrier, 1986). In either case, the intent was to increase skills and establish confidence with
using technology. The premise now seemed to be that if teachers had access to computers, and believed they had sufficient skills for using them, they would integrate classroom instructional tech-nology use into their pedagogical repertoires. Yet techtech-nology inte-gration was still not occurring to the anticipated degree (Office of Technology Assessment, 1995).
In light of these developments researchers began to look more closely at beliefs that influenced teachers’ decision-making pro-cesses about integrating the use of technology into their teaching. Much of this work was grounded inBandura’s Social Cognitive The-ory (1986,1997), which posited several intrapersonal factors that interacted to influence self-regulation when making decisions. Bandura’s work was extended to address the role of these intraper-sonal factors on career choices (seeLent, Brown, & Hackett, 1994), and has been widely applied with respect to how people make decisions about use of technology in the workplace.
To date, the primary focus of Social Cognitive Theory related re-search in educational technology has been on self-efficacy (cf.,
Anderson & Maninger, 2007; Delcourt & Kinzie, 1993; Ertmer, 1999; George & Camarata, 1996; Milbrath & Kinzie, 2000; Wang, Ertmer, & Newby, 2004)—teachers’ belief that they ‘‘[have] the capacity to work effectively with technology” (Wang et al., 2004, p. 231). Considerably less attention has been applied to examining the role of outcome expectations—the extent to which a behavior, once successfully executed, is believed to be linked to valued out-comes (Davis, 1989)—in shaping teachers’ technology integration.
Bandura (1982)argued that self-efficacy and outcome beliefs have differing antecedents and that, ‘‘In any given instance, behavior would be best predicted by considering both self-efficacy and out-come beliefs.” (p. 140).
0747-5632/$ - see front matter Ó 2009 Elsevier Ltd. All rights reserved. doi:10.1016/j.chb.2009.12.002
*Corresponding author. Tel.: +1 515 294 6841; fax: +1 515 294 2763. E-mail address:[email protected](D.S. Niederhauser).
Contents lists available atScienceDirect
Computers in Human Behavior
We have now reached a point that access to technology in US pub-lic schools no longer appears to be a central problem. According to
Parsad and Jones (2005), the student/computer ratio has dropped to 4.4 to 1, a substantial improvement from the 12.1 to 1 ratio re-ported in 1998 when it was first measured; and up to 93% of class-rooms had Internet access (although there continue to be ongoing upgrade and maintenance concerns regarding the aging computer base in schools). Further, it appears that we have made significant in-roads toward developing teachers’ self-efficacy beliefs. Fully 86% of teachers felt at least ‘‘somewhat well-prepared” to use computers for classroom instruction (US Department of Education, 2003). How-ever, teachers still tend to use technology in fairly limited and mun-dane ways (Chen, 2008; Niederhauser & Lindstrom, 2006).
While self-efficacy may provide teachers with confidence such that they believe they can integrate technology into their practice, to be effective they must also decide that technology integration is valuable enough to expend the necessary time and energy to de-velop ways to use technology in meaningful ways with students. That is, teachers must decide that they should integrate technology. Outcome expectations can serve a motivational role to prompt teachers to put forth the effort necessary to effectively plan, imple-ment, and reflect on the best ways to use technology with their students. Without the essential motivational aspect that outcome expectation engenders we may continue to find teachers who have
access and skills, but whose technology integration efforts are lim-ited and uninspired.
2. Outcome expectation
Outcome expectation (OE), sometimes referred to as usefulness or perceived usefulness (cf.,Albion, 2001; Davis, 1989; Delcourt & Kinzie, 1993) is an important construct that can be used to explain and predict human behavior. According toLent and his colleagues (1994), OE involves the anticipated outcomes of an action (If I do X, Y will happen) For example, ‘‘If I study for my test, I will receive a better grade.” Thus, OEs play an important role in human motiva-tion: ‘‘Unless people believe that their actions will have the desired consequences, they have little incentive to engage in those actions” (Pajares, 2006, p. 6); and promoting intentional human behavior: ‘‘Expectancies are important because they help people form cogni-tive maps, or internal plans [that they use] to determine the best course of action to attain a goal” (Schunk, 2001; p. 106). Thus, OE can motivate individuals to sustain behaviors over long periods of time if they believe their actions will eventually generate a de-sired result.
According to Social Cognitive Theory, outcome expectation con-sists of three components (Bandura, 1986). In the context of the tea-cher-technology-integration focus of the present work, performance
One-Factor Model (predicted by Schultz and Slevin, 1975)
OE
POE 1 POE 2 POE 3 SEOE 1 SEOE 2 SEOE 3 SOE 1 SOE 2 SOE 3 Two-Factor Model (predicted by
Compeau, Higgins, and Huff, 1999
)OE
POE 1 POE 2 POE 3 SEOE 1 SEOE 2 SEOE 3 SOE 1 SOE 2 SOE 3 Personal
OE Performance
OE
Three-Factor Model (predicted by Bandura, 1986, 1997)
OE
POE 1 POE 2 POE 3 SEOE 1 SEOE 2 SEOE 3 SOE 1 SOE 2 SOE 3 Social OE
Performance OE
Self- Ev OE
OE (POE) represents beliefs like using technology would make one a more effective teacher; self-evaluative OE (SEOE) represents beliefs that one would experience personal satisfaction from teaching with technology; and social OE (SOE) represents beliefs that one’s peers would favorably acknowledge one’s use of instructional technology. Bandura claimed that these three components are distinct, but inter-related, and combine to form the OE construct. However, others have suggested that the three constructs are not unique.
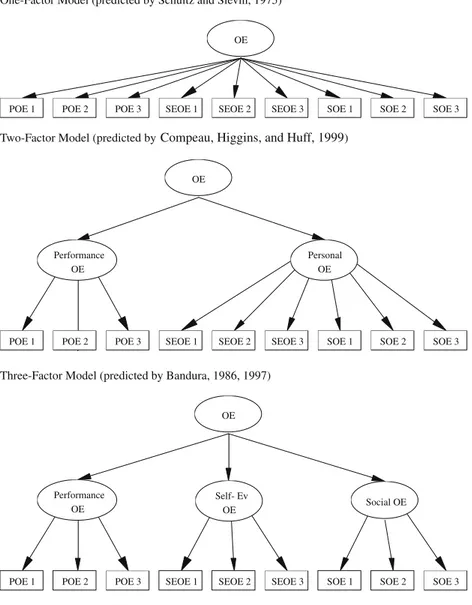
Fig. 1shows three representations of ways that OE has been conceptualized in the literature. The first model, proposed by
Schultz and Slevin (1975), is a single-factor model, in which POE, SEOE, and SOE reflect a unitary OE construct. However, Davis (1989)offered a critique of Schultz and Slevin’s scale, which was designed to measure expected performance improvements from using a computer. Problems that Davis identified included: (a) validity was addressed through exploratory (rather than verified through Confirmatory) Factor Analysis (CFA); (b) the ratio of sam-ple size to scale items was low (2:1); and (c) four of the 13 items had low factor loadings (less than .5).
The second is a two-factor model, in which the POE items loaded on one dimension, while SEOE items and SOE items were merged un-der a dimension referred to as personal OE (Compeau, Higgins, & Huff, 1999). These authors developed an OE scale that included a six-item performance OE, and a five-item personal OE sub-scale. Consistent with Bandura’s conception of POE, their performance OE addressed potential improvements in job performance (produc-tivity, effectiveness). However, in Compeau, Higgins and Huff’s con-ceptualization, personal OE was defined as ‘‘expectations in image or status or expectations of rewards, such as promotions, raises, and praise” (p. 148), and included items related to self-evaluative OE (e.g., ‘‘If I use a computer, I will increase my sense of accomplish-ment”) and social OE (e.g., ‘‘If I use a computer, I will be seen as higher in status by my peers”). In addition to this departure from Bandura’s original theory, Compeau, Higgins, and Huff’s scale also appeared to have some validity concerns: (a) validity was tested through Explor-atory Factor Analysis, rather than validated through ConfirmExplor-atory Factor Analysis; (b) 3 of the 11 items had relatively low loadings (less than .60); (c) only 1 item measured self-evaluative OE, and it had a factor loading less than .60 on the personal OE factor.
The third representation presents a three-factor model in which each type of OE represented a unique form of OE—which is consis-tent withBandura’s (1986,1997)claim that the three types of OE are related but distinct. Our scale was developed to reflect the three types of OE identified by Bandura, and we hypothesize that the best fit for our data will be this three-factor model.
Although numerous scales have been developed to assess the intrapersonal factors associated with Social Cognitive Theory, most are in fields outside of education (e.g.,Compeau & Higgins, 1995; Davis, 1989; Lent et al., 2005; Maurer, 2001). Of the scales devel-oped to assess technology use by teachers, some focus solely on self-efficacy (e.g.,Wang et al., 2004) while others include a smat-tering of OE type items, seeming to accept Shultz and Slevin’s con-ceptualization of a unitary OE construct (e.g., Albion, 2001; Anderson & Maninger, 2007; Delcourt & Kinzie, 1993), thereby ignoringBandura’s (1997)suggestion that the two other OE dimen-sions, SEOE and SOE, deserve equal attention. To date, we are aware of only one scale that has addressed OE in a thorough and systematic manner (Niederhauser and Perkmen, 2008). The pres-ent study extends and refines the argumpres-ent for the importance of OE when examining teacher technology integration.
The need for an Instructional Technology Outcome Expectation (ITOE) scale is clear. First, we appear to be at an impasse with re-spect to teacher technology integration. It appears that we have provided adequate technology access in schools, and a reasonably large percentage of teachers report feeling somewhat well-pre-pared to integrate technology. Yet teachers still do not appear to
be motivated to use instructional technologies with their students. Outcome expectations provide an opportunity to examine teach-ers’ motivation to integrate technology use into their practice; however, current scales have methodological shortcomings, were not developed for teacher education, and/or do not differentiate among the three OE components. In the present study we provide evidence of the validity of the scale, an examination of our hypoth-esis that our instrument will yield three distinct OE constructs (consistent with Bandura’s Social Cognitive Theory), and data on the psychometric properties of the ITOE scale.
3. Method 3.1. Data source
Subjects were 92 pre-service teachers (67 female) enrolled in an introductory instructional technology course at a large US Mid-western university. Grade level distribution was 26 freshmen, 33 sophomores, 20 juniors, and 13 seniors. Ages ranged from 18 to 35 (M = 20.08, SD = 3.11). Students were planning to teach across the full range of grade levels upon graduation, with half in early childhood/elementary education (n = 46) and half in secondary education (n = 46).
3.2. Instrument
Twenty-five items were used to assess Social Cognitive Theory-based intrapersonal factors along four dimensions: self-efficacy (6 items), outcome expectation (9 items), interest (6 items), and goals (4 items). Of interest for the present study, the nine-item outcome expectation scale included three items for POE, three for SEOE, and three for SOE. For all items, subjects indicated their level of agree-ment with each stateagree-ment on a five-point Likert scale: strongly dis-agree (1), disdis-agree (2), neither dis-agree nor disdis-agree (3), dis-agree (4), and strongly agree (5). All 25 items were presented in random se-quence in a single questionnaire.
3.3. Development of OE items
Since the primary work on OE has occurred outside of the field of teacher education, we used scales developed for technology use by engineering students and information workers as a starting point for developing our OE items.
Davis (1989)defined POE (or what he called perceived useful-ness) as ‘‘the degree to which a person believes that using a partic-ular system would enhance his or her job performance” (p. 24). Performance OE items were adapted from Davis’ perceived useful-ness scale items, which were originally designed to examine the technology use of management information systems (MIS) profes-sionals. We rephrased Davis’ items to make them relevant to teach-ers: ‘‘Using instructional technology in the classroom will increase my effectiveness as a teacher.” Higher scores reflect more positive IT performance outcome expectations. Davis reported a Cronbach alpha coefficient of .97 on the usefulness sub-scale from which we extracted questions in his validation study with 120 MIS pro-fessionals at IBM Canada’s Toronto Development Laboratory.
Self-evaluative outcome expectations include anticipated pride, satisfaction, and excitement with one’s work. SEOE items were based on the performance and personal outcome expectations scale (Compeau & Higgins, 1995), and a scale used by Lent and his colleagues to examine students’ interests and goals in Engi-neering education (Lent et al., 2005). These scales also were de-signed for use in areas other than teacher education so items were rephrased for participants in our study. For example, the item we used to assess teachers’ anticipated satisfaction with technol-ogy integration was: ‘‘Using instructional technoltechnol-ogy in the
classroom will make my teaching more satisfying.” Higher scores reflect more positive IT self-evaluative outcome expectations. Compeau and Higgins reported a Cronbach alpha coefficient of .87 on the relevant outcome expectations sub-scale from which we extracted questions in their validation study with 1020 knowl-edge workers; that is, individuals whose work requires them to pro-cess large amounts of information (like managers, insurance adjusters, financial analysts, and accountants). Lent and his col-leagues reported a Cronbach alpha coefficient of .89 on the outcome expectations sub-scale in their validation study with 221 under-graduate engineering students from three Universities in the East-ern United States.
Feedback from others (e.g., respect and recognition) constitute social outcome expectations. SOE items were also derived from the scales developed byLent and his colleagues (2005)and Com-peau and Higgins (1995). A sample SOE item from our instrument was: ‘‘Effectively using instructional technology in the classroom will increase my colleagues’ respect of my teaching ability.” Higher scores reflect more positive IT social outcome expectations. Lent and his colleagues reported a Cronbach alpha coefficient of .86 for Social Support items, and Compeau and Higgins reported a Cron-bach alpha coefficient of .87 for SOE items.
3.4. Initial survey validation procedures
The initial survey was pilot tested with 28 pre-service teachers taking the same introductory instructional technology course as current study participants to address face validity. Several items were revised slightly in response to issues raised by students con-cerning phrasing and clarity. Questionnaire items were then re-viewed by three Social Cognitive Career Theory experts (including Lent) to establish content validity. Expert reviewers agreed that items were consistent with the constructs they were intended to measure. Minor phrasing revisions were incorporated into the final version of the survey that was used in the present study. Factorial validity will be addressed in the results section. 3.5. Survey administration procedure
Participants completed the survey during a regular class session in the last week of the semester. Participation was voluntary. 3.6. Approach to modeling
To establish construct validity for the ITOE scale, a series of Con-firmatory Factor Analyses (CFA) were performed. We chose to use Confirmatory Factor Analytical (CFA), rather than Exploratory Fac-tor Analysis, because we had a priori hypotheses about plausible model structures (seeBollen, 1989). In the present study we tested our hypothesis that Bandura’s three-factor model would better ex-plain our data than would Schultz and Slevin’s one-factor model, or Compeau and Higgins two-factor model. The purpose of CFA is to determine if the number of factors and the loadings of measured (indicator) variables on those factors conform to what is hypothe-sized based on theory and previous research literature. If the mod-el-implied covariates correspond with observed covariances, then the hypothetical constructs are supported (Kline, 1998).
The overall fit between proposed models and the data was as-sessed by using the chi-square goodness-of-fit index, chi-square/ df ratio, comparative fit index (CFI), and Root Mean Square Error of Approximation (RMSEA). The chi-square value measures the overall fit of the data to the model, with a smaller chi-square value indicating a better fit between the data and the proposed model. The ratio of chi-square to degrees of freedom (a global-fit measure) indicates the relative efficiency of competing models in accounting for patterns in the data. Ratios of less than five indicate a
reason-able fit, and values close to two represent a good fit (Marsh & Hau, 1996).
CFI was used to measure the fit of the model relative to the null model, while minimizing the affect of sample size. Values range from 0 to 1.00, with larger values reflecting a better fit; values lar-ger than .90 are typically considered to be acceptable models (Hu & Bentler, 1999).
RMSEA was included because it is a measure of fit that takes model parsimony into account (i.e., goodness-of-fit values can sometimes be inflated artificially as the number of parameters in the model are increased). Lower RMSEA values represent a better fit, with values below .10 considered reasonable (Hair, Anderson, Tatham, & Black, 1998).
4. Results
4.1. Validity of the Instructional Technology Outcome Expectations scale
In addition to face validity and construct validity described in Section3, we examined concurrent validity using Pearson correla-tion. Concurrent validity is based on the degree to which the 9-item ITOE scale is related to other constructs in ways that are con-sistent with Social Cognitive Theory research.Bandura (1986,1997)
theorized that the intrapersonal factors he had identified were highly inter-correlated. To provide evidence of concurrent validity, OE constructs were examined relative to three other intrapersonal constructs measured in the current study: self-efficacy, vocational interests, and choice goals.
Concurrent validity of the ITOE scale was demonstrated through significant correlations between OE variables and other Social Cog-nitive Theory-related questionnaire sub-scales including self-effi-cacy (r = .67, p < .01), vocational interest (r = .69, p < .01), and choice goals (r = .78, p < .01). The relatively high correlations among all of the intrapersonal variables in the study are consistent with the predictions of Social Cognitive Theory (seeTable 1).
4.2. Optimal factorial model to represent these data
To test our hypothesis that Bandura’s conceptualization of three distinct OE components (POE, SEOE, and SOE), we conducted three Confirmatory Factor Analyses to determine which of the potential factor models identified inFig. 1fit best with our data, and com-pare the results of these analyses here.Table 2shows that three of the four goodness-of-fit indices: chi-square, chi-square/df, and RMSEA values were substantially lower for the three-factor model (recall that smaller values for these measures represent a better fit). Further, the three values for CFI were very similar—with all three meeting the .90 cutoff for a good model. Taken together, these goodness-of-fit indicators present a fairly clear pattern sug-gesting that the three-factor model provides the best representa-tion of these data.
Standardized parameter estimates of factor loadings for each ITOE scale item were also examined to determine which model best fit these data. Results can be seen inTable 3. For POE items,
Table 1
Pearson correlations among sub-scales in the study.
Variables OE SE Int Goal
Outcome expectation 1 .672** .692** .786**
Self-efficacy 1 .616** .727**
Interest 1 .756**
Goal 1
both the two-factor and three-factor models showed stronger fac-tor loadings than did the one-facfac-tor model. The similarity between the two- and three-factor models is not surprising given that both of these models represent POE items as distinct constructs, while the one-factor model does not.
SEOE items show the greatest homogeneity across the three models. Differences among and within factor models are minimal, with no model showing a clearly superior advantage for SEOE. However, SOE shows a clear advantage for the three-factor model. Factor loadings for the one- and two-factor models are actually fairly similar, while loadings on the three-factor model are sub-stantially higher. In light of the standardized parameter estimate data—high loadings on POE for the two-factor and three-factor models, ambiguous results for SEOE, and very strong support for the three-factor model for SOE items—the three-factor model ap-pears to be well supported in this analysis as well.
Based on our analysis of both goodness-of-fit data and stan-dardized parameter estimates of factor loadings, we conclude that the three-factor model provides the best representation of these data. These findings support Bandura’s (1986,1997) claims that
POE, SEOE, and SOE represent distinct constructs within OE. In addition to being the strongest of the three hypothesized models, the three-factor model showed good overall factorial validity.
Confirmatory Factor Analysis fit indices for the three-factor model indicated an acceptable fit for these data. The small chi-square value and global-fit chi-chi-square ratio/df measure of 2.21 falls at the lower end of the 2–5 range (recall that lower values repre-sent better fit with values close to 2 reprerepre-senting a good fit); the CFI value, at .94, is well over the .90 cutoff for a good model; and the .11 RMSEA value closely approached the .10 standard. Taken together, these indices provide reasonable evidence for a good fit between these data and the 3-factor model.
4.3. Psychometrics properties of the ITOE scale
Internal consistency analyses were performed on POE, SEOE, and SOE factors (seeTable 4). Overall Cronbach’s alpha for the scale was .93; with .84 for POE sub-scale, .85 for SEOE sub-scale, and .92 for SOE sub-scale. These coefficients show high internal consis-tency for ITOE scale, and for each of the sub-scales. Item–item cor-relations ranged from .57 to .84, indicating homogeneity among the sub-scale items. Specifically, item–item correlations ranged from .60 to .74 for the POE scale, .57 to .75 for the SEOE sub-scale and .76 to .84 for the SOE sub-sub-scale. Furthermore, each item comprising the ITOE scale was associated with the total test score as demonstrated by the corrected item-total correlations. Cor-rected item correlations ranged from .61 to .77 for the POE sub-scale, .73 to .81 for the SEOE sub-sub-scale, and .70 to .78 for the SOE sub-scale.
A further estimate of internal consistency was indicated by the squared multiple correlations (SMC) of factor scores. The SMC ran-ged from .55 to .72 for the POE sub-scale, .60 to .67 for the SEOE sub-scale, and .78 to .88 for the SOE sub-scale. Since SMC ranged between 0 and 1, the observed variables accounted for substantial variance in the factor scores. These findings suggest that the three-factors are clearly defined by the observed variables comprising each sub-scale. Together these findings provide empirical evidence for the internal consistency of the ITOE scale.
5. Conclusion
Results from this study provide empirical evidence that OE is a multifaceted construct consisting of three components: POE, SEOE, and SOE. This finding supported our initial hypothesis and is con-sistent withBandura’s conceptualization of OE relative to Social
Table 2
Goodness-of-fit indices.
Model Chi-square Chi-square/df CFI RMSEA
One-factor model 172.09 4.92 0.95 0.21
Two-factor model 153.90 4.66 0.96 0.20
Three-factor model 70.58 2.21 0.94 0.11
Table 3
Standardized parameter estimates. Items Model factor loadings
One-factor Two-factor Three-factor
POE 1 .70 .75 .74 2 .81 .86 .88 3 .80 .85 .85 SEOE 1 .81 .79 .82 2 .79 .81 .77 3 .83 .83 .81 SOE 1 .78 .81 .91 2 .72 .75 .88 3 .76 .80 .94 Table 4
Internal consistency of the ITOE scale.
M (SD) Corrected item-total correlations
Squared multiple correlations Factor 1: Performance outcome expectations
Using instructional technology in the classroom will increase my effectiveness as a teacher 3.95 (.90) .77 .77 Using instructional technology in the classroom will increase my productivity 3.70 (.91) .77 .72 Using instructional technology in the classroom will make it easier for me to teach 3.80 (.94) .61 .55 Factor 2: Self-evaluative outcome expectations
Using instructional technology in the classroom will make my teaching more exciting 4.27 (.81) .73 .67 Using instructional technology in the classroom will make my teaching more satisfying 3.65 (.91) .81 .66 Effectively using instructional technology in the classroom will increase my sense of
accomplishment
3.57 (.89) .76 .60
Factor 3: Social outcome expectations
Effectively using instructional technology in the classroom will increase my status among my colleagues
3.30 (.96) .78 .88
Effectively using instructional technology in the classroom will increase my colleagues’ respect of my teaching ability
3.45 (.92) .78 .84
My colleagues will see me as competent if I effectively use instructional technology in the classroom
Cognitive Theory (1986,1997). Further, the three-factor solution had good validity and psychometric properties, indicating that the scale is useful in discriminating between the three OE components.
In contrast to other scales that we critiqued earlier, we used Confirmatory, rather than Exploratory Factor Analysis, because the ITOE scale was grounded in a theoretical framework, and the study was designed to examine three hypothesized factor configurations. UnlikeSchultz and Slevin (1975), who used a sub-ject/item ratio of 2:1, we had a ratio of 10:1 (Bentler and Chou (1987)suggested that the ratio be at least 5:1). Further, unlike
Compeau et al.’s (1999) scale, which included only one SEOE item, we used three items for each OE component. And finally, while Schultz and Slevin had several factors that loaded at less than .50, and Compeau, Higgins and Huff had items that loaded at less than .60, all of our items loaded at .74 or higher, with all but two-factors loading over .80. Thus, our scale seems to have accounted for several of the shortcomings associated with previ-ous OE scales.
According to Ertmer (1999), ‘‘Even if every [external] barrier were removed, teachers would not automatically use technology to achieve the kind of meaningful outcomes advocated.” (p. 51). Intrapersonal factors, like outcome expectation, play a central role in whether teachers choose to integrate technology into their instructional practices. A deeper understanding of the OE construct can help with the technology integration effort in several ways.
First, OE serves as a powerful motivator to catalyze change. Developing positive outcome expectations requires a shift in per-ception and attitude, necessitating that teachers become intrinsi-cally motivated through recognition of the value in using technology with their students. More detailed knowledge of out-come expectations can help teacher educators and inservice train-ers move beyond the skills approach aimed at developing self-efficacy, and focus their efforts on helping pre-service and inser-vice teachers recognize the value, for both themselves and their students, when they integrate technology into their instructional practice. Although we developed and tested the scale for use with pre-service teachers, we believe it has applicability for all teachers. Additional research is needed to verify the scale with practicing teachers.
Achieving technology integration will not be easy. First, effec-tive technology integration is a difficult and often frustrating pro-cess. It is especially challenging and daunting at the outset—when considerable up-front work is needed to prepare for technology integration, and uncertainty about whether it will work as ex-pected. There is also a delicate balance between self-efficacy and outcome expectations as individuals push themselves beyond cur-rent skill levels, then strive to gain new skills to catch up. This cycle provides opportunities for lifelong learning, but requires persever-ance and a willingness to risk. However, if the outcome expecta-tions are strong enough, teachers will likely be more willing to put forth the effort.
Further, an understanding of the three differentiated compo-nents of outcome expectations can help us better identify the pre-dispositions of teachers toward instructional technology integration, and provide data that can help guide strategies for enhancing teachers’ classroom technology use. For example, rais-ing awareness of the potential usefulness of technology in the So-cial Studies curriculum by creating peer teaching situations in which an expert technology-using teacher works with one or more teachers with low POE scores can serve to help the low POE teach-ers see the potential benefits of teaching with technology. This activity would also likely enhance SEOE and SOE for the mentor teacher. As teachers improve their use of technology, recognition at faculty meetings or through awards could be used to further en-hance SOE.
As we continue to integrate technology into educational set-tings through initiatives like one-to-one laptop initiatives and in-creased opportunities for collaboration offered through Web 2.0 technologies, it becomes imperative that teachers embrace tech-nology and integrate it into their pedagogy in thoughtful and effec-tive ways. Addressing outcome expectation issues may help provide the motivational force that will help teachers reach the next level in technology integration.
References
Albion, P. R. (2001). Some factors in the development of self-efficacy beliefs for computer use among teacher education students. Journal of Technology and Teacher Education, 9(3), 321–347.
Anderson, S. E., & Maninger, R. M. (2007). Preservice teachers’ abilities, beliefs, and intentions regarding technology integration. Journal of Educational Computing Research, 37(2), 151–172.
Bandura, A. (1982). Self-efficacy mechanisms in human agency. American Psychologist, 37(2), 122–147.
Bandura, A. (1986). Social foundations of thought and action: A social cognitive theory. Englewood Cliffs, NJ: Prentice Hall.
Bandura, A. (1997). Self-efficacy: The exercise of control. New York: Freeman. Bentler, P. M., & Chou, C. (1987). Practical issues in structural modeling. Sociological
Methods & Research, 16, 78–117.
Bollen, K. A. (1989). A new incremental fit index for general structural equation models. Sociological Methods and Research, 17, 303–316.
Chen, C. H. (2008). Why do teachers not practice what they believe regarding technology integration? The Journal of Educational Research, 102(1), 65–75. Coley, R. J., Cradler, J., & Engel, P. K. (1997). Computers and classrooms: The status of
technology in US schools. Princeton, NJ: Policy Information Center, Educational Testing Service. Retrieved November 15, 2009, from http://eric.ed.gov/ ERICWebPortal/contentdelivery/servlet/ERICServlet?accno=ED412893. Compeau, D. R., & Higgins, C. A. (1995). Computer self-efficacy: Development of a
measure and initial test. MIS Quarterly, 19, 189–211.
Compeau, D. R., Higgins, C. A., & Huff, S. (1999). Social cognitive theory and individual reactions to computing technology: A longitudinal study. MIS Quarterly, 23(2), 145–158.
Davis, F. D. (1989). Perceived usefulness, perceived ease of use, and user acceptance of information technology. MIS Quarterly, 13(3), 319–340.
Delcourt, M. A., & Kinzie, M. B. (1993). Computer technologies in teacher education: The measurement of attitudes and self-efficacy. Journal of Research and Development in Education, 27(1), 35–41.
Ertmer, P. A. (1999). Addressing first- and second-order barriers to change: Strategies or technology integration. Educational Technology Research & Development, 47(4), 47–61.
George, G., & Camarata, M. R. (1996). Managing instructor cyberanxiety: The role of self-efficacy in decreasing resistance to change. Educational Technology, 36(4), 49–54.
Glenn, A. D., & Carrier, C. A. (1986). Teacher education and computer training: An assessment. Peabody Journal of Education, 64(1), 67–80.
Hair, J., Anderson, R. E., Tatham, R. L., & Black, W. C. (1998). Multivariate data analysis (5th ed.). Upper Saddle River, NJ: Prentice Hall.
Hu, L., & Bentler, P. M. (1999). Cutoff criteria for fit indexes in covariance structure analysis: Conventional criteria versus new alternatives. Structural Equation Modeling, 6(1), 1–55.
Kline, R. B. (1998). Principles and practice of structural equation modeling. New York: Guilford.
Lent, R., Brown, S., & Hackett, G. (1994). Toward a unifying social cognitive theory of career and academic interest, choice, and performance. Journal of Vocational Behavior, 45, 79–121.
Lent, R. W., Brown, S. D., Sheu, H., Schmidt, J., Brenner, B. R., Gloster, C. S., et al. (2005). Social cognitive predictors of academic interests and goals in engineering: Utility for women and students at historically black universities. Journal of Counseling Psychology, 52(1), 84–92.
Marsh, H. W., & Hau, K. T. (1996). Assessing goodness of fit: Is parsimony always desirable? The Journal of Experimental Education, 64, 364–380.
Maurer, T. J. (2001). Career-relevant learning and development, worker age, and beliefs about self-efficacy for development. Journal of Management, 27, 123–140. Milbrath, Y. L., & Kinzie, M. B. (2000). Computer technology training for prospective teachers: Computer attitudes and perceived self-efficacy. Journal of Technology and Teacher Education, 8(4), 373–396.
Niederhauser, D. S., & Lindstrom, D. L. (2006). Addressing the NETS for students through constructivist technology use in K-12 classrooms. Journal of Educational Computing Research, 34(1), 91–128.
Niederhauser, D. S., & Perkmen, S. (2008). Validation of the Intrapersonal Technology Integration Scale: Assessing the influence of intrapersonal factors that influence technology integration. Computers in the Schools, 25(1-2), 98–111. Office of Technology Assessment (1988). Power on! New tools for teaching and
learning. Washington, DC: US Government Printing Office.
Office of Technology Assessment (1995). Teachers and technology: Making the connection. Washington, DC: US Government Printing Office.
Pajares, F. (2006). Overview of social cognitive theory and of self-efficacy. Retrieved March 12, 2006, fromhttp://www.emory.edu/EDUCATION/mfp/eff.html.
Parsad, B., & Jones, J. (2005). Internet access in US Public Schools and Classrooms: 1994–2003 (NCES 2005–015). US Department of Education. Washington, DC: National Center for Education Statistics.
Schunk, D. H. (2001). Learning theories: An educational perspective (3rd ed.). Upper Saddle River, NJ: Prentice-Hall/Merrill.
Schultz, R. L., & Slevin, D. P. (1975). Implementation and organizational validity: An empirical investigation. In R. Schultz & D. Slevin (Eds.), Implementing operations research/management science (pp. 153–182). New York: Elsevier.
Sivin-Kachala, J., & Bialo, E. (2000). 2000 research report on the effectiveness of technology in schools (7th ed.). Washington, DC: Software and Information
Industry Association. Retrieved November 15, 2009, from http:// www.sunysuffolk.edu/Web/Central/InstTech/projects/iteffrpt.pdf.
US Department of Education (1986). Teacher preparation in the use of computers. Washington, DC: Office of Educational Research and Improvement.
US Department of Education (2003). Federal funding for educational technology and how it is used in the classroom: A summary of findings from the integrated studies of educational technology. Washington, DC: Policy and Program Studies Service. Wang, L., Ertmer, P. A., & Newby, T. J. (2004). Increasing preservice teachers’ self-efficacy beliefs for technology integration. Journal of Research on Technology in Education, 36(3), 231–250.