THE INFLUENCE OF USING QR CODES AS AN INFORMATION DELIVERY METHOD TO INCREASE USER ENGAGEMENT IN
EXHIBITION SPACES
The Graduate School of Economics and Social Sciences of
İhsan Doğramacı Bilkent University
by
BENGİSU GÖREL
In Partial Fulfillment of the Requirements for the Degree of MASTER OF FINE ARTS
THE DEPARTMENT OF
INTERIOR ARCHITECTURE AND ENVIRONMENTAL DESIGN İHSAN DOĞRAMACI BİLKENT UNIVERSITY
ANKARA
ABSTRACT
THE INFLUENCE OF USING QR CODES AS AN INFORMATION DELIVERY METHOD TO INCREASE USER ENGAGEMENT IN
EXHIBITION SPACES
Görel, Bengisu
MFA, Department of Interior Architecture and Environmental Design Supervisor: Asst. Prof. Dr. Çağrı İmamoğlu
June 2019
The use of QR codes as an information delivery method and its’ effects on visitor engagement in exhibition spaces is investigated in the present thesis. The use of QR codes as an information delivery method and its’ resulting effects on visitor engagement in terms of visitors’ experiences of learning and social interaction are examined. Moreover, if younger people are more likely to use QR codes in comparison to middle-aged participants is studied during the study. A field experiment that applied the analysis of the timing data and questionnaire was conducted with 63 participants in two different conditions at an art gallery. The control condition consisted of traditional information labels with an informative text while the experiment condition consisted of information labels with a QR code directing visitors to a designed website of artworks’ explanations. The results of the study are expected to construct a basis on implementing the QR code technology in exhibition environments to improve visitors’ interaction level with exhibited objects.
Keywords: Exhibition Spaces, Information Delivery Methods, QR Codes, Visitor Attention, Visitor Engagement
ÖZET
SERGİ ALANLARINDA BİLGİ AKTARIMI YAPILIRKEN KARE KOD KULLANIMININ ZİYARETÇİ KATILIMI ÜZERİNDEKİ
ETKİLERİ
Görel, Bengisu
İç Mimarlık ve Çevre Tasarımı Bölümü, Yüksek Lisans Tez Danışmanı: Dr. Öğr. Üyesi Çağrı İmamoğlu
Haziran 2019
Tezde bilgi aktarımı yöntemi olarak kare (QR) kodlarının kullanımını ve bunun sergi alanlarında ziyaretçi katılımı üzerindeki etkilerini incelenmektedir. Çalışma aynı zamanda kare kodlarının kullanımını ve bunun ziyaretçilerin öğrenme ve sosyal etkileşim deneyimleri üzerindeki etkilerin incelenmektedir. Ayrıca, gençlerin yaşlı ziyaretçilere kıyasla kare kodlarını kullanma olasılığının daha yüksek olup olmadığı araştırılmaktadır. Bir sanat galerisinde iki farklı döngüde 63 katılımcı ile zaman verilerinin ve anketlerin analizini yapan bir saha deneyi gerçekleştirildi. İlk döngü, bilgilendirici bir metin içeren geleneksel bilgi etiketlerinden oluşurken, ikinci döngü, ziyaretçileri bir kare kod aracılığıyla sanat eseri açıklamalarının yer aldığı web sitesine yönlendiren bilgi etiketlerinden oluşmaktaydı. Çalışmanın sonuçlarının, ziyaretçilerin sergi objeleriyle etkileşim seviyesini arttırmak amacıyla kare kod teknolojisinden faydalanmanın sergi alanlarında uygulanmasına yönelik bir temel oluşturması beklenmektedir.
Anahtar Kelimeler: Bilgi Aktarımı Yöntemleri, Kare (QR) Kodlar, Sergi Alanları, Ziyaretçi Dikkati, Ziyaretçi Katılımı
ACKNOWLEDGEMENTS
I would like to thank my advisor Asst. Prof. Dr. Çağrı İmamoğlu for his
invaluable support, guidance, and suggestions throughout the preparation of this thesis.
I would like to thank Prof. Dr. Billur Tekkök Karaöz and Asst. Prof. of Practice Burçak Altay for their invaluable comments and support during my thesis defence.
I want to express my appreciation to Bilkent University Library Art Gallery Coordinator Atilla Güllü for allowing me to use the art gallery for the purpose of my study.
I would like to thank my amazing parents, family, and friends for the love, support, and patience.
Lastly, I will thank my beloved one who kept me encouraged, inspired and smiling.
TABLE OF CONTENTS
ABSTRACT ... iii ÖZET ... iv ACKNOWLEDGEMENTS ... v TABLE OF CONTENTS ... vi LIST OF TABLES ... ix LIST OF FIGURES... x CHAPTER I: INTRODUCTION... 11.1. Aim of the Study ... 2
1.2. Structure of the Thesis ... 3
CHAPTER II: LITERATURE REVIEW ... 6
2.1. Factors Affecting Visitor Engagement ... 7
2.1.1. Visitor Factors ... 7
2.1.1.1. Visitor Characteristics... 7
2.1.1.2. Learning ... 9
2.1.1.3. Social Interaction ... 12
2.1.2. Exhibit Factors ... 13
2.1.3. Information Delivery in Exhibition Spaces ... 14
2.1.3.1. Information Delivery Methods ... 15
2.1.3.2. Exhibit Labels ... 15
2.1.3.2.1. Factors Influencing Label Reading ...16
2.1.3.2.2. Exhibit Label Design ... 19
2.1.3.2.4. Label Reading Behaviors ... 29
2.2. Defining the Measures of Visitor Attention ... 30
2.2.1. Visual Contact and Active Engagement ... 30
2.2.2. Measures of Association ... 32
2.3. QR Codes ... 34
2.3.1. What are Quick Response (QR) Codes? ... 34
2.3.2. QR Code Studies in Museums ... 36
CHAPTER III: METHODOLOGY ... 44
3.1. Procedure ... 46
3.1.1. Sample ... 47
3.1.2. Setting of the Experiment ... 48
3.1.3. Pilot Study ... 52
3.1.4. Analysis of the Exhibit Objects ... 57
3.1.5. Analysis of the Information Delivery Methods ... 58
3.1.5.1. Exhibit Labels of Control Condition ... 59
3.1.5.2. Exhibit Labels of Experiment Condition ... 61
3.1.5.2.1. Website Design ... 61
3.1.5.2.2. QR Codes ... 63
3.2. Measurement ... 65
3.3. Instruments ... 66
CHAPTER IV: RESULTS ... 67
4.1. Descriptive Statistics ... 67
4.2. Analysis of the Quantitative Data ... 70
4.2.1. Timing Data ... 70
4.2.1.1. Tests of Normality ... 70
4.2.1.2. Nonparametric Tests for Independent Samples .... 73
4.2.1.3. Average Holding Time (AHT) ... 74
4.2.2. Survey Data ... 75
4.2.2.1. Reliability Analysis ... 75
4.2.2.2. Survey Results ... 76
4.2.2.2.1. Group Type ... 76
4.2.2.2.2. Age Groups ... 77
4.3. Analysis of the Qualitative Data ... 78
4.3.2. Interaction ... 81 4.3.3. Learning ... 81 4.3.4. Technology ... 82 4.3.5. Format ... 82 4.3.6. Usefulness ... 82 4.3.7. Text ... 83 4.3.8. Content ... 83 4.3.9. Size ... 84 4.3.10. Placement ... 84 CHAPTER V: DISCUSSION ... 85
CHAPTER VI: LIMITATIONS AND CONCLUSIONS ... 91
REFERENCES ... 95
APPENDICES ... 102
A. QUESTIONNAIRES ... 103
B. EXHIBIT OBJECTS ... 108
C. INFORMATION LABELS OF CONTROL CONDITION ... 115
D. INFORMATION LABELS OF EXPERIMENT CONDITION ... 118
LIST OF TABLES
1. Detailed Examination of Selinda Model of Visitor Learning ... 11
2. Exhibit Characteristics ... 14
3. Empirical Factors Influencing Label Reading ... 17
4. Demographic Characteristics of Participants ... 69
5. Tests of Normality ... 70
6. Extreme Values of Time Spent During Each Condition ... 72
7. Mann Whitney-U Test for Testing Significance Levels ... 73
8. Average Holding Time Values for Each Condition ... 74
9. Reliability Analysis for Survey Data ... 75
10. Corrected Reliability Analysis for Survey Data ... 76
LIST OF FIGURES
1. Illustration of the Selinda Model of Visitor Learning ... 10
2. Illustration of the Process of Attention, Knowing Your Audience .... 21
3. Illustration of the Process of Attention, Capture Audience Attention... 23
4. Illustration of the Process of Attention, Hold Audience Attention .... 25
5. Illustration of the Process of Attention, Selectivity ... 26
6. Illustration of the Process of Attention, Motivated Focusing ... 28
7. Illustration of the Process of Attention, Motivated Focusing ... 28
8. Example of a QR Code ... 35
9. (a) Patrons’ Knowledge (b) General Reactions about the Use of QR Codes (c) Reactions to Institutions ... 38
10. Example of a QR Generator Web Page ... 39
11. QR code Label Panel ... 42
12. Screen Label Panel ... 42
13. Methodology Scheme ... 46
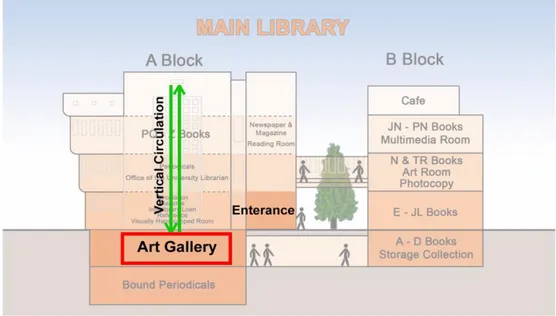
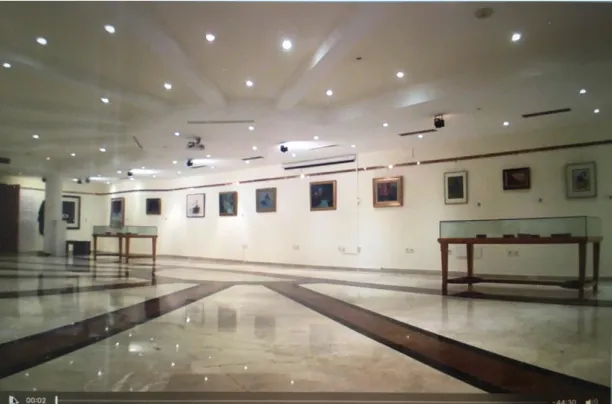
14. Elevation of the Bilkent University Library Art Gallery in Ankara, Turkey in which Exhibition Will Take Place ... 48
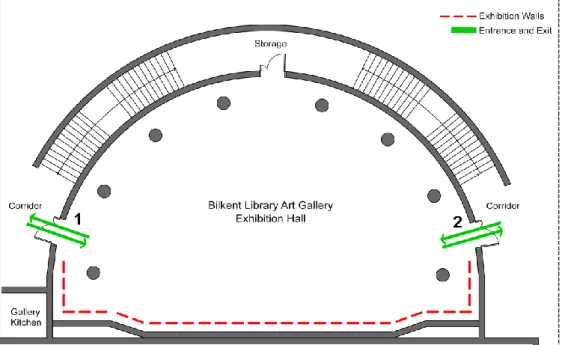
15. Ground Floor Plan of the Bilkent University Library Art Gallery in
Ankara, Turkey in which Exhibition Will Take Place ... 49
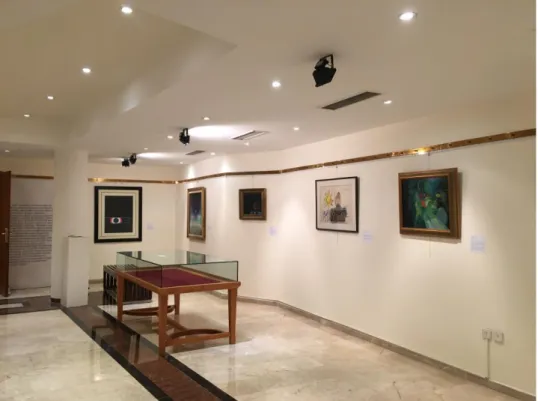
16. The Physical Setting of the Experiment During Control Condition ... 50
17. A screenshot of the Video Recording During Experiment ... 51
Condition 18. Pilot Study Setting ... 52
19. Home Page of the Website ... 53
20. The Website Page Containing The Artists’ Works ... 53
21. Example of an Information Page About the Artworks ... 54
22. Appearance of the Website from Mobile Devices ... 54
23. The Video Page of the Website ... 55
24. (a) Information Label Design (b) Placement of the Information Label ... 56
25. Analysis of the Exhibit Label Used During Control Condition ... 60
26. Example of Label Placement ... 60
27. Artists Page on the Website ... 62
28. Example of an Information Page About the Artworks ... 62
29. Example of Comment Section on the Information Page ... 63
30. Analysis of the Exhibit Label Used During Experiment Condition ... 64
31. Distribution for Group No QR ... 71
32. Distribution for Group QR ... 71
CHAPTER 1
INTRODUCTION
Over the years, museum curators and gallery managers have been
concerned with increasing their visitors’ engagement in exhibition spaces. To achieve this goal, researchers studied the factors affecting attracting and holding visitor attention; visitors’ engagement level is influenced by visitor and exhibit characteristics (Falk, Koran Jr., Dierking, & Dreblow, 1985). First, visitor factors are demographic characteristics (Bitgood, 2002) and visitor profiles (Dean, 1994; Hooper-Greenhill, 1999; Serrell, 1996). Second, exhibit factors can be divided into exhibit characteristics (Borun & Dritsas, 1997), information delivery methods (vom Lehn, 2006) and exhibit label design (Bitgood, 1989; Chang, 2006a; Serrell, 1983). These factors play a critical role in understanding visitors’ behavior. Considering these factors affect visitors’ engagement in exhibition spaces.
Regarding visitor and exhibit factors, massive expansion of mobile digital technologies leads museum and gallery administrations to find new
interactive ways of presenting their collections to their visitors. QR codes are one of these mobile digital technologies that provide an innovative way of delivering information. QR codes are two-dimensional barcodes created for delivering digital information. QR codes have become very popular in recent years because they deliver a wide range of data at a sufficient speed. Also, any user having a smartphone can reach the information by scanning the QR code to obtain the information through a link to a website (Shin, Jung, & Chang, 2012). In addition, QR codes are a cost-effective alternative of mobile digital technologies compared to other media tools. While QR codes are widely used across the world within the marketing sector (Demir, Kaynak, & Demir, 2015), the use of QR codes is gradually expanding in cultural life and museums (Chivarov, Ivanova, Radev, & Buzov, 2013). The use of QR codes as an information delivery method can improve visitor engagement by
supporting their learning experience. Moreover, QR codes can facilitate and enrich communication between the visitors and exhibit objects by offering additional data such as graphics, audio, and, video, etc.
1.1. Aims and Hypotheses of the Study
Previous studies done on the use of QR codes in museums and galleries focused on implementing QR codes in an institution and surveying the participants (Schultz, 2013). There is little information in the literature
investigating the use of QR codes as an information delivery method and its’ resulting effects on visitor engagement (Pérez-Sanagustín, Parra, Verdugo,
García-Galleguillos, & Nussbaum, 2016). Also, a lack of comparative studies is another gap in the literature.
To fill the gap in the literature, the main purpose of this thesis is to explore “How does using QR Codes as an information delivery method influence user engagement in exhibition spaces?” The first Hypothesis of the study is “Using QR Codes as an information delivery method is positively correlated with user engagement in exhibition spaces.” The study aimed to discover if the QR codes influence visitor engagement by compare the viewing time of traditional information labels with informative text and QR code implemented information labels. Moreover, the influence of using QR codes for delivering information to visitors’ learning experience will be studied. The effects of implementing a communication tool for visitors to interact with each other will be examined in terms of the relationship between social interaction and visitor engagement. In addition, the exhibit label factors and its’ affects on visitor engagement will be studied.
The second aim of the study is to investigate “How are younger people more likely to use QR codes in exhibition spaces?” The second Hypothesis is “Younger people are more likely to use QR Codes in exhibition spaces.” According to the previous studies, mostly young people use QR codes because it requires a smartphone and knowledge on how to use the QR codes (Schultz 2013). Moreover, younger adults adapt to these new
participants, and their degree of adaptiveness to the QR code technology. Also, another aim of the study is to compare the preference levels of
designer and non-designer participants while they are using the QR codes. Last, the exhibit viewing times of participants with different nationality groups will be compared to understand the influence of nationality on using QR codes.
1.2. Structure of the Thesis
This thesis consists of six chapters. The first chapter is introductory to the thesis and the aims of the study. The issue will be presented with the key elements that are going to be discussed in the further chapters in accordance with previous studies. Lastly, Hypothesis 1 and Hypothesis 2 is presented.
The second chapter will cover previous literature on visitor engagement in exhibition spaces and QR codes. First, visitor engagement will be explained in terms of two categories. These categories are the factors affecting visitor engagement and defining the measures of visitor attention. Secondly, a brief explanation of QR codes will be done followed by the examination of
previous QR code studies in museums.
In the third chapter methodology of the thesis will be explained firstly by stating the approach of the study. The procedure of the thesis will be
covered. The procedure of the study will indicate the pilot study, participants and experiment place, analysis of the exhibit objects, and analysis of the
information delivery methods. Last, measurement and instruments of the method will be justified.
In the fourth chapter, the results of the study will be explained. The
demographic characteristics of the participants will be studied. Moreover, the analysis of the timing data and survey data will be covered under the
analysis of quantitative data. The analysis of the qualitative data will be evaluated.
In the fifth chapter, a discussion of the findings will be done in accordance with the previous literature presented in the second chapter. In the sixth chapter, the limitations and conclusions about the study will be done. Last, suggestions for further studies will be proposed.
CHAPTER 2
LITERATURE REVIEW
Museums and exhibition spaces present artworks to visitors for their self-education and satisfaction. Visitor studies have an important role to
understand visitor behavior and engagement in an exhibition environment. Researchers and museum curators have long been investigating visitor engagement in terms of two categories:
Factors affecting visitor engagement and
Measures of visitor attention, which will be covered to explain visitor engagement in exhibition spaces.
2.1. The Factors Affecting Visitor Engagement
Previous studies have demonstrated that visitor, environmental, and exhibit factors influence visitor engagement (Falk et al., 1985). To answer the research question mentioned previously, this review will only be focusing on visitor and exhibit factors. First, visitor factors will be studied to investigate the relationship between visitor factors and visitor engagement. Second, exhibit factors will be studied under two subcategories of information delivery methods and exhibit labels to understand the exhibit characteristics that are affecting visitor engagement in exhibition spaces.
2.1.1. Visitor Factors
Visitor factors influence visitor engagement in exhibition spaces. Research conducted regarding this issue covered various visitor factors such as visitor characteristics, learning, and social interaction.
2.1.1.1. Visitor Characteristics
Visitor satisfaction is related to visitors’ expectations and needs. These variables are formed by visitor characteristics and profiles. Demographic characteristics affect visitors’ engagement in exhibition spaces. Visitor variables affecting the visitor behavior are characteristics of age, gender, education level, profession, and nationality (Bitgood, 2002). In general, museum visitors are more likely to be in upper education and income groups, younger than the population and more active in different social groups (Hood, 1983). Koran and Koran (1983) stated that adult males seem to cover more elements in a shorter range of time while adult females focus attention to one
object and linger longer.
Visitor profiles influence visitor engagement in exhibition spaces. According to the characteristics of the visitors, researchers identified three different categories of visitor profiles (Dean, 1994; Hooper-Greenhill, 1999; Serrell, 1996). Hooper-Greenhill identified a number of profiles according to visitors’ physical and social characteristics. These groups are families, educational groups, tourists, leisure learners, elderly and people with visual auditory, mobility or learning disabilities (Hooper-Greenhill, 1999).
Dean (1994) categorizes visitor profiles into three types. According to his study these are casual visitors, cursory visitors, and learners. Casual visitors are identified as ‘people who rush’ which describes the visitors who do not pay much attention to exhibit objects. Cursory visitors are identified as
‘people who stroll’ which describes the visitors who are more stimulant to the exhibit objects but still do not pay much attention to read labels and are not actively engaged with the exhibit objects. Learners are identified as ‘people who study’ which describes those who spend most of their time reading the labels, closely examining the exhibit objects and absorbing all the information available for them during their visit. These characteristics can differ according to prior experiences and education levels of visitors (Dean, 1994).
Serrell (1996) generated a similar categorization of visitor profiles with Dean (1994). She argues that there are three types of profiles as the transient, the sampler, and the methodical viewers. However, Serrell (1996) suggested that
grouping visitors’ profiles is not a subjective and useful method for conducting visitor studies. To measure visitor engagement, it is more sufficient to learn the average time spent at the exhibition environment.
Finally, in addition to visitor characteristics and profiles, leisure values are key factors affecting visitor engagement in exhibition spaces. According to Hood (1983), visitors decide on how they satisfy their leisure experience including their museum visits. There are different attributes affecting visitors’ decisions on how they use their leisure time. These attributes are learning, social interaction, actively participating, having new experiences and feeling comfortable in ease of use while experiencing new activities. Learning and social interaction will further be explained in the following sections while actively participating, having new experiences and ease of use when experiencing new activities will be covered in exhibit factors chapter.
2.1.1.2. Learning
For the purpose of increasing visitor engagement, museums should provide multiple experiences to their visitors such as emotional and aesthetic delight, learning and sociability (Ahmad, Abbas, Yusof, & Mohd.Taib, 2015). Museum curators see the role of the museums evolving from only presenting exhibit objects to multi-functional facilities. Besides their other functions, museums are now seen as important sources of information and educational spaces (Othman, 2012).
Museums and exhibition spaces offer learning and educational leisure to their visitors enabling visitor satisfaction and engagement correlated with the experience of learning (Ahmad, Abbas, Yusof & Mohd.Taib, 2015). This chapter will cover the factors affecting visitors’ learning experience.
Perry (2012) studied the visitor learning to have an understanding of visitor engagement through factors affecting their learning experience. She
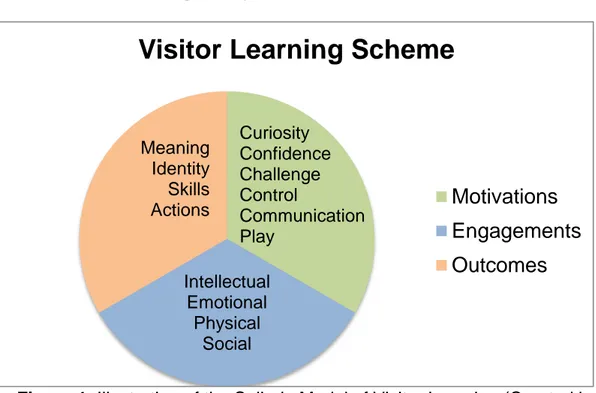
discovered six motivation types that exhibit and information delivery methods need to fulfill to enhance visitors’ engagement in learning. These affect visitors’ engagement and determine the outcomes of their behavior (Figure 1). According to the visitor-learning scheme, motivations influence visitor engagement and key factors of the visitor engagement shape visitor behavior outcomes. Table 1 explains the effects of motivation types to visitor behavior in terms of their learning activity.
Figure 1. Illustration of the Selinda Model of Visitor Learning (Created by Görel, 2019) Source: Ahmad, Abbas, Yusof & Mohd. Taib. (2015); Perry
(2012).
Visitor Learning Scheme
Motivations
Engagements
Outcomes
Curiosity Confidence Challenge Control Communication Play Intellectual Emotional Physical Social Meaning Identity Skills ActionsTable 1. Detailed Examination of Selinda Model of Visitor Learning (Created by Görel, 2019)
Types of Motivation Engagement Behavior of Visitors
The feeling of achieving something because of the learning activity A degree of challenge in
learning new things Having the power to control
the environment Encouraging social interaction and group discussions among other visitors Playfulness, ability to engage
imagination Sources: Perry (2012); Ahmad, Abbas, Yusof & Mohd. Taib. (2015).
Visitors’ active learning is enhanced by the technology integrated information delivery methods (Othman, 2012). Mobile digital technologies provide various information delivery techniques to enable new forms of interactions among visitors and exhibit objects (Heath & vom Lehn, 2008). These could support a learning environment where users are given alternative ways to explore exhibit objects that suit their preferences (Othman, Petrie, & Power, 2013). According to Heath & Lehn, visitors participation is directly related to various forms of information being delivered in exhibition spaces (Heath & vom Lehn, 2008). They argue that computer-based interactive exhibitions and
information delivery techniques enhance visitor engagement and increase
1.Curiosity Intellectual Curiosity of visitors towards the information being delivered
2.Confidence Emotional
3.Challenge Emotional
4.Control Physical
5.Communication Social
learning through interactivity.
2.1.1.3. Social Interaction
Museum visitation becomes a social experience. Therefore, exhibitions often influence group discussions and social interaction. There is research
indicating a relationship between social interaction and visitor engagement in exhibition spaces (Bitgood, 2002; vom Lehn, 2006; Sandifer, 1997). Bitgood (2002) states that the majority of visitors visit exhibitions with their friends or families. According to Sandifer (1997), family members visiting exhibition together are engaged with the exhibits more than non-family visitors. Vom Lehn (2006) found that visitors share their experience with their companions while visiting an exhibition through verbal and bodily actions. These
interactions affect how visitors experience the exhibition and how they examine the exhibit elements. Group visitors attend to museum experience as a social unit (Goulding, 2000). Vom Lehn (2006) suggests to the
designers and curators that while interpretation of resources such as exhibit labels, touch-screens or any other additional information delivery methods, social interaction should be taken into consideration. As a result of the
2.1.2. Exhibit Factors
Exhibit objects are the main factors affecting attracting and holding times and visitors’ attention in exhibition spaces. In this section, exhibit factors, exhibit characteristics, information delivery methods and exhibit labels will be examined.
Previous research established that exhibit characteristics affect visitor engagement. For example, static, soundless and small objects hold visitors’ attention to a smaller degree (Bitgood, 2002; Borun & Dritsas, 1997; Melton, 1972; Bitgood, Patterson & Benefield, 1988; Peart, 1984; Sandifer, 2003; Serrell, 1997; Serrell, 2002). On the other hand, moving (Melton, 1972) large (Bitgood, Patterson, & Benefield, 1988) and sound emitting (Peart, 1984) exhibits hold visitors’ attention in a greater degree. Sandifer (2003) claims that interactive exhibits increase the average time per exhibit spent by visitors.
Bitgood (2002) examined exhibit characteristics to find their relationship to visitor engagement. He found that salience, and distinctiveness of an exhibit object influences the visitor attention. Exhibit object’s degree of salience increases its’ noticeability. Isolation, size, contrast with setting background, multi-sensory characteristics, lighting, line of sight placement are the exhibit object’s characteristics of distinctiveness.
Borun & Dritsas (1997) proposed seven exhibit characteristics that attract and hold visitor attention (see Table 2). These characteristics influence visitor engagement and promote their learning activity.
Table 2. Exhibit Characteristics (Created by Görel, 2019)
Exhibit Characteristics Explanations Visitors can cluster around the exhibits Exhibits allow visitors to interact Comfortably used by all of the visitors regardless of
their age, sex, and abilities Observations and outcomes encourage group discussions Provide different learning methods and a variety of knowledge Easy to read Satisfy new cognitive links to visitors
knowledge Source: Borun & Dritsas (1997)
2.1.3. Information Delivery in Exhibition Spaces
The museum experience is enhanced by the quality and quantity of the learning activity as was previously mentioned. Learning is correlated with the methods of information delivery methods and exhibit label characteristics. In this section of the review, these two sub-categories will be examined.
1.Multisided 2.Multiuser 3.Accessible 4.Multioutcome 5.Multimodal 6.Readable 7.Relevant
2.1.3.1. Information Delivery Methods
According to vom Lehn (2006), in order to facilitate collaborative engagement with exhibit objects, information delivery methods such as exhibit labels, text panels as well as technological devices play a critical role on engaging visitors’ attention. These materials should be integrated into the exhibition spaces to enhance visitor engagement.
Russell (1994) states that museums should provide meaningful and
enjoyable experiences to facilitate learning. Following this, museums have started to study additional ways of delivering information and offer different kinds of learning activities to their visitors. In this way, museums have created a variety of learning experiences that could satisfy different visitor profiles (see Chapter 2.1.1.1).
Othman (2012) claims that enjoyment, creativity, and inspiration are
important features of information delivery methods. Therefore, using mobile digital technologies as an information delivery method may provoke creative and innovative thoughts during visitors’ museum experience. Othman (2012) claims that the integration of technology into learning methods is affects visitors’ problem-solving abilities and creative thought.
2.1.3.2. Exhibit Labels
Behavior related to exhibit labels is a significant variable for measuring visitor engagement and learning in exhibition spaces. Exhibit labels play a critical role in visitors’ cognitive learning. According to Gutwill (2006), exhibit labels
offer different perspectives, challenge assumptions, and provide
explanations. Chang (2006) remarks that exhibit labels are fundamental learning tools in museum and exhibition spaces. It is essential to examine visitors’ behavior on reading exhibit labels, because labels may create different learning results (Chang, 2006). Therefore, label development has been an important concern of the researchers in the past years (Bitgood, 1989). Researchers and museum curators have been studying exhibit labels to understand their relationship to visitor engagement. There are different approaches to exhibit label studies. Exhibit labels are examined in two focus points to understand its’ relationship with visitor engagement (Bitgood, 1989; Bitgood, 1991; Bitgood, 2000; Bitgood, 2002; Chang, 2006; Serrell, 1983). The first approach is defining exhibit label characteristics for designing effective exhibit labels. In the second one, researchers studied the
relationship between visitors’ label reading behavior with visitor attention. In the following pages we will examine these two focus areas according to the related literature.
2.1.3.2.1. Factors Influencing Label Reading
Bitgood (1989) studied the parameters of effective label design. He offered 16 major empirical factors that influence visitors' label reading behavior. Definitions and suggestions about these empirical factors are explained in Table 3.
Table 3. Empirical Factors Influencing Label Reading (Created by Görel, 2019)
Factors Definitions Suggestions
1.Label Length 2.Label Placement: Vertical Position 3. Label Placement: Relational Position 4.Size of Letters and Graphics 5.Density of Labels Number of words, sentences, and lines
Visitors prefer to read short labels.
Visitors’ number of stops is higher if the text on the label is shorter
Placement of labels in
accordance with the floor height
Visitors do not seem to notice labels placed above eye level
Studies suggest to place labels 122-167 cm above ground level
Labels’ relationship with other labels, objects, and
architectural elements as entrances, exits, circulation paths
Labels should be within the visitors’ line of sight
Labels should be placed near the exhibits and easily accessed
Labels close to exits recieve low attention
Size of the texts and graphics on the labels
Larger letters draw more attention
The number of labels placed on the
exhibiton space
High density of labels is associated with a low probability of viewing
Table 3. (Cont’d) 7.Subject Matter 8. Cueing 9. Movement 10. Multi-Sensory Inputs 11. Manipulative Stimuli 12. Color 13. Diagrams, Illustrations and Photographs 14. Typography Figure-ground contrast between lettering and label background color
There should be sufficient contrast between lettering and label background color
The text should not be too technical
Human interest can be increased by the use of a good style of language
Content and
grammar of the text
Written instructions or signs
Cueing can stimulate visitors’ attention
Movement in labels Movement can attract visitors’
Sensory inputs added to to labels
Sensory inputs such as sound and touch
increases visitor attention
Label designs that provokes
manupulative stimulation
Flip labels can be used to attract visitors’ attention
Interpretation of color into text or label background
Not enough studies found in the literature
Interpretation of diagrams, illustrations and photographs to exhibit labels
Such interpretation does not have an universally enhancing effect
Visuals placed on the labels can distract visitors’ attention
Style, arrangement, and appearance of the text
Line length, spacing, and justification are important aspects 6.Figure-Ground
Table 3. (Cont’d)
Source: Bitgood (1989); Serrell (1983).
2.1.3.2.2. Exhibit Label Design
Bitgood (1991) proposed three categories of visitor attention that help designers and museum curators to produce more effective exhibit labels. These components are: knowing your audience, capturing their attention, and holding their attention.
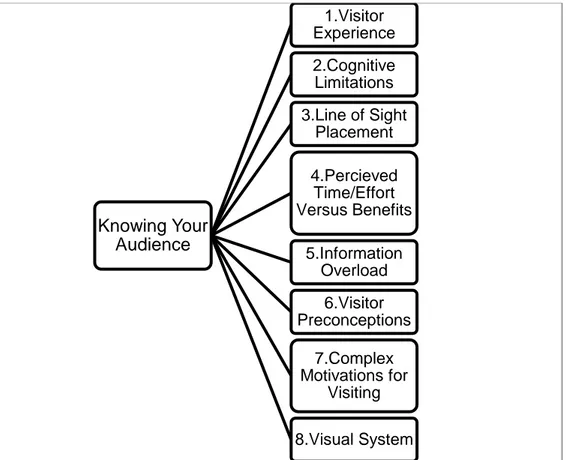
Knowing your audience is the first key factor for creating effective labels in exhibition spaces. Psychological and physiological components need to be clarified to understand audiences’ behavior. These components affect visitors’ reactions to exhibits. Therefore, Bitgood (1991) suggests that designers should consider them while designing exhibit labels. Bitgood (1991) categorizes them into eight categories (see Figure 2). First, one of the psychological factors is to understand what types of experiences satisfy visitor experiences. The visitor experience is multi-dimensional that consists of four constituents which are cognitive, affective, sensory-perceptual and behavioral experiences. Cognitive experiences influence intellectual stimuli.
15. Ambiguous Coding
16. Size of the Label’s
Background
Coding system for visualizing exhibits
Visitors may have difficulty understanding a particular coding system
Label’s background size
Can be useful if there are many objects that are visually competing with each other
Affective constituents are reflected through excitement and satisfaction. Sensory-perceptual experiences occur by the sights, sounds and tactile cues. Psychomotor movements are defined as behavioral experiences that include physical interaction with exhibits. Bitgood (1990) suggests that providing more than one experience to visitors enhance visitor engagement. Visitors can have a hard time recalling the information learned from labels. Bitgood (1991) defines this situation as a cognitive limitation. To eliminate these effects, exhibit labels could be organized in a manner that information is meaningful to visitors. While moving through an environment visitors are most likely to see the objects that fall within their visual field (Bitgood, Benefield, Patterson, 1990), which is referred to as the line of sight placement. Visitors should not give additional effort to find exhibit labels (Bitgood, 1991). Label tags should be placed accordingly to the principles of the line of sight placement. Visitors’ decisions of reading or not reading the labels are affected by the cost-benefit principle. It is positively correlated with visitors’ interest level in that particular subject area (Bitgood, 1991). When there are too many simultaneous stimulus inputs, visitors have a hard time processing information that is called information overload; therefore, the amount of information delivered to visitors should be carefully decided (Bitgood, 1991). Bitgood (1991) suggests that exhibit labels’ content and design should consider visitor preconceptions. Seventh, people visit museums and exhibition spaces for different motivations such as learning something new, social interaction and challenge of new experiences. According to Bitgood (1991), designers should keep in mind these complex motivations for visiting and design effective labels accordingly. Finally, the
human visual system has different limitations (Bitgood, 1991). For instance, middle-aged participants can have visual acuity and lighting level problems. Therefore, the visual system should be designed according to the needs of all visitors.
Figure 2. Illustration of the Process of Attention, Knowing Your Audience (Created by Görel, 2019) Source: Bitgood, (1991).
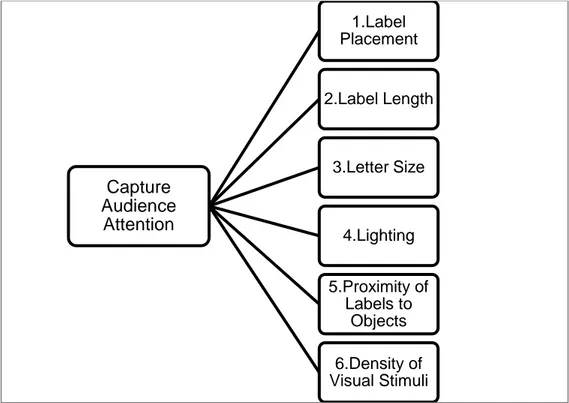
Capture their attention is the second key factor for creating effective labels in exhibition spaces. Physical characteristics of the labels help capture visitors’ attention. Bitgood (1991) examine six characteristics of exhibit labels that influence visitor engagement (see Figure 3). Parallel to the line of sight placement explained in the previous section, label placement is essential for capturing visitors’ attention. According to Bitgood (1991) visitors are more
Knowing Your Audience 1.Visitor Experience 2.Cognitive Limitations 3.Line of Sight Placement 4.Percieved Time/Effort Versus Benefits 5.Information Overload 6.Visitor Preconceptions 7.Complex Motivations for Visiting 8.Visual System
likely to read the labels placed next to the exhibits that require minimum eye movement. According to the researchers (Borun & Miller, 1980; Bitgood, 1998) label length is another variable that influences visitor engagement in exhibition spaces. Shorter labels are more likely to be read than longer labels; texts with less than 75 words have a higher chance of reading
(Bitgood, 1991). Moreover, as it is mentioned in the previous section interest levels and perceived time/effort versus benefits affect visitors’ motivation to read longer labels. Letter sizes should be easily read from the points that visitors’ stop to review the exhibit objects (Bitgood, 1991). According to a study (Bitgood, et al., 1986), the number of readers increased to 15 percent when the font sizes are raised from 18 to 36 point at the exhibit labels. On the other hand, when the font sizes are too large they can compete with the rest of the exhibit objects. Therefore, while designing exhibit labels; font sizes should be carefully considered. Moreover, designers should eliminate glare, shadows and low levels of light that affects the contrast between letters and backgrounds (Bitgood, 1991). Fifth, Bitgood, et al., (1986) states that
proximity of labels to objects is important for two major factors. It is important to have labels close to the related exhibit objects to minimize the
misunderstandings. Also, the same explanation applies to the label
placement principles. Visitors are more likely to read exhibit labels when they provide minimum physical effort for reading the texts. The density of visual stimuli is the last variable that affects capturing audience attention. According to various studies (Bitgood, 1991; Melton, 1935) if labels’ visual density is a higher amount of attention given to each exhibit object decreases. If there are too many labels placed in one exhibition space, labels start to compete
with each other and also with the exhibit objects (Bitgood, 1991).
Figure 3. Illustration of the Process of Attention, Capture Audience Attention (Created by Görel, 2019) Source: Bitgood, (1991).
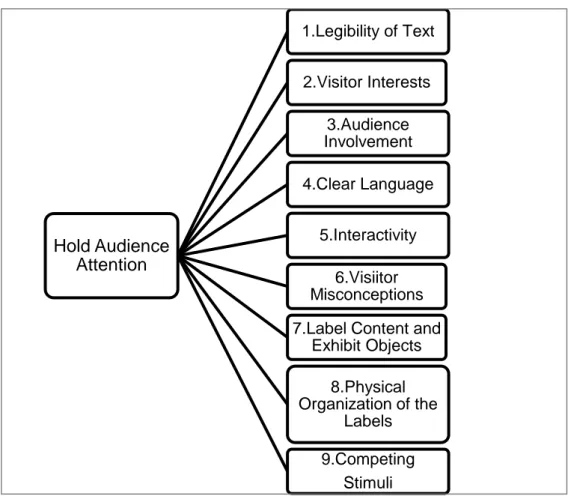
Hold audience attention is the third key factor for creating effective labels in exhibition spaces. In the previous section factors affecting to capture visitor attention were explained. After capturing audience attention there are 9 sets of variables that enable holding audience attention (see Figure 4). Firstly, the legibility of the text should be considered while creating exhibit labels. There is a lack of studies in this field. However, researchers find a correlation between perceived legibility of text and the parameters such as contrast, letter typography and different typefaces (as cited in Bitgood, 1991). Secondly, visitor interests affect holding audience attention. To have an opinion about visitor interests, museum curators can observe their visitors
Capture Audience Attention 1.Label Placement 2.Label Length 3.Letter Size 4.Lighting 5.Proximity of Labels to Objects 6.Density of Visual Stimuli
increased by the label content (Bitgood, 1991). Fourthly, clear language contributes to retaining audience attention. Clear and non-technical language helps visitors to engage with exhibits better than texts with technical words and jargons (Bitgood, 1991). Fifthly, interactivity affects visitor engagement in exhibition spaces. Adding questions and graphics to the labels increase the level of engagement. Sixthly, visitor misconceptions about the subject matter can be eliminated by the use of exhibit labels (Bitgood, 1991). Seventhly, label content should be parallel with the information about the exhibit objects. Eighthly, parallel to the information given under capture audience attention (label placement, label length and letter size) physical organization of the labels influence visitor engagement. According to the researchers, there are three different ways of organizing a text (Screven, 1986). Information
mapping is a text writing method that enables grouping the text in different visual categories by using visual cues, indentations, diagrams, bold or italic characters and colors (Screven, 1986). Assigning different sizes and weights for primary and secondary texts can affect readability and ability to focus (as cited in Bitgood, 1991). Layering is the second technique used for organizing a text. In order to enable visitors to select the information that they interested in, designers can divide the information into different layers. The last method is to bullet the information to make it easy for visitors to attain information. Ninthly, the exhibition environment should reduce distracting sights and sounds to reduce competing stimuli because visitors often get easily disturbed while reading exhibit labels (Bitgood, 1991).
Figure 4. Illustration of the Process of Attention, Hold Audience Attention (Created by Görel, 2019) Source: Bitgood, (1991).
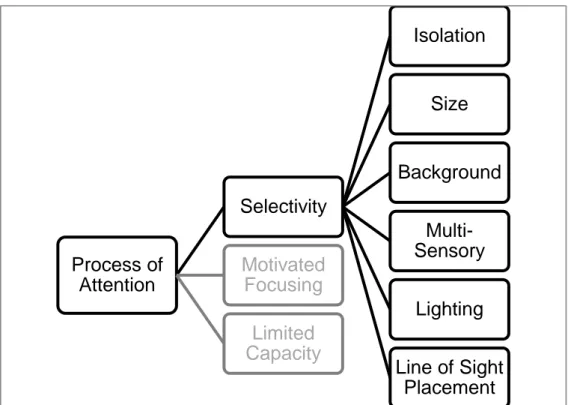
2.1.3.2.3. Process of Attention
Bitgood (2000) studied the process of attention and its’ relationship between designing interpretive labels. The process of attention is consists of three elements. These are the principle of selectivity, motivated focusing, and limited capacity. Attention is selective (Bitgood, 2000). Visitors selectively focus on one thing at a time. Selectivity is affected by different factors of the distinctiveness of a label. These factors are listed in Figure 5. Detailed information about these factors can be found in the previous section of the review. Hold Audience Attention 1.Legibility of Text 2.Visitor Interests 3.Audience Involvement 4.Clear Language 5.Interactivity 6.Visiitor Misconceptions 7.Label Content and
Exhibit Objects 8.Physical Organization of the Labels 9.Competing Stimuli
Figure 5. Illustration of the Process of Attention, Selectivity (Created by Görel, 2019) Source: Bitgood, (2000).
The process of attention requires motivated focusing. According to Bitgood (2000), perceived effort, cognitive-emotional arousal and distractions are three parameters affecting visitors’ motivated focusing (see Figure 6). In this review, we will be focusing on cognitive-emotional arousal.
Cognitive-emotional arousal can be increased by provoking interest and thought
(Bitgood, 2000). Different factors affect the motivation of visitors according to cognitive-emotional arousal model (see Figure 7). First, the phrasing of labels influences visitor attention (Gutwill, 2006). Rand (1990) suggests that asking questions rather than only delivering facts about the exhibits increase visitor engagement. Researchers (Gutwill, 2006; Hohenstein & Tran, 2007) investigated the relationship between the use of questions in exhibit labels and visitor engagement. Both studies indicate that type of phrasing
Process of Attention Selectivity Isolation Size Background Multi-Sensory Lighting Line of Sight Placement Motivated Focusing Limited Capacity
influences visitors’ actions but the overall time spent at the exhibition space is not increased. Gutwill (2006) adds that the result of the case study
suggests using both questions and explanations in the labels than only having informative texts. Second, challenging the visitors can result in increasing their engagement with the exhibit labels (Bitgood, 2000). For instance, giving a task can stimulate visitors to solve a problem or achieve accomplishment that may result in higher engagement with the exhibit objects. Third, Robinson et al. (1928) found that giving handouts with
explanations and additional material related to the exhibits increased visitors’ total time spent at the museums and the engagement with the artworks. Fourth, labels can be designed in different formats such as graphic panels with text blocks, flip labels, and self or visitor activated auditory labels, etc. Bitgood (2000) claims that the design of the label format affects visitor engagement. Bradburne (2002) studied different label types such as textual, authority, observation, and games to generate a taxonomic inventory.
However, he did not study the relationship between exhibit label types and visitor behaviors. Therefore, there is a lack of studies on how different exhibit label designs influence visitor engagement. Bitgood (2000) suggests that while designing alternative exhibit labels designers can indicate instructions on what to do or what to look for to enable misconceptions. Last, as
mentioned previously, social interaction is a key factor affecting visitor
engagement with exhibits (Bitgood, 2000). Social interaction can be provided by the design of the interpretive labels. Moreover, labels can enable
interactive communication among visitors. The design of the labels should consider how visitors can exchange ideas and knowledge and how the
design of the labels can motivate visitors to share comments. Designers should search for new ways to deliver knowledge while motivating visitors to interact with each other.
Figure 6. Illustration of the Process of Attention, Motivated Focusing (Created by Görel, 2019) Source: Bitgood, (2000).
Figure 7. Illustration of the Process of Attention, Motivated Focusing (Created by Görel, 2019) Source: Bitgood, (2000).
Process of Attention Selectivity Motivated Focusing Percieved Effort Cognitive- Emotional Arousal Asking Questions Challenge the Reader Handouts Format of Label Provide Instructions on what to do Enable Social Interaction Minimize Distractions Limited Capacity Process of Attention Selectivity Motivated Focusing Percieved Effort Cognitive- Emotional Arousal Distractions Limited Capacity
Finally, resources of attention have a limited capacity (Bitgood, 2000). Resources of attention decrease when the effort is expanded. To retain and renew resources of attention; principles of cognitive-emotional arousal can be applied to the exhibit labels.
2.1.3.2.4. Label Reading Behaviors
Researchers, studied visitors’ label reading behaviors according to social content and found three types of visitor behavior in terms of reading exhibit labels: not seen to be reading, brief glances at a text, and attentive reading (Chang, 2006; McManus, 1989). Visitor group types, duration of visitors visit, and how the text on the label is read influence visitors’ label reading behavior (Chang, 2006). For instance, visitors who examine labels in groups are observed to have one member of the group read the text for his/her companions. According to the same research, exhibit labels encourage group members for group discussions (Chang, 2006) In short, analyzing visitors’ label reading behavior clarifies how visitors engage with the exhibit labels and hereby with the exhibit objects.
Other studies remark the importance of the labels according to the
differences in visitors’ conversations among others in the presence of the exhibit labels (Hohenstein & Tran, 2007). McManus (1989) studied the visitors’ reading behaviors and found that visitors who seemed not paying attention to the exhibit labels appeared to have conversations with their companions about the texts written on the exhibit labels.
2.2. Defining Measures of Visitor Attention
Previously we have studied visitor and exhibit factors that are affecting the visitor engagement. Review will explore how visitor engagement can be identified and how visitor attention is measured. Museum curators and
educators have long been investigating visitor attention because it is a critical factor in understanding and measuring visitor learning and visitor
engagement in exhibition spaces (Wittlin, 1968; Shettel, 1973, cited in Koran & Koran, 1983). Exhibit objects and exhibit labels need to attract and hold visitor attention in order to provide information. This process begins with attracting visitors’ attention to provide visual contact with the objects. After having visual contact, visitors’ will began to engage with the artworks
actively. In the following sections visual contact and active engagement, and measures of visitor attention will be explained to have a deep understanding of defining measures of visitor attention.
2.2.1. Visual Contact and Active Engagement
To understand the degree of engagement, Peponis et al. (2004) studied visual contact, and active engagement. While visiting museums and other exhibition spaces visitors view or detect an exhibit element. Visual contact is formed when a visitor browses to the exhibit element, while visitor stops and examines the exhibit content during active engagement (Güler, 2009;
According to Nehamov (1971) and Danilov (1979), museums are
multidimensional spaces. Therefore, visitors’ attention is quickly disturbed by different environmental factors. Visitors’ mostly have trouble focusing and keeping their attention on exhibit objects (Koran & Koran, 1983); complexity of static exhibits form attention directing elements that are more essential for learning and maintaining active engagement.
Visitors visually contact with most of the elements until something tempts them to stop and actively engage with a particular exhibit object (Bicknell & Mann, 1992). Visitors mostly spend less time in an exhibition space than designers and curators predicted (Serrell, 1997). Research indicates that (Bicknell & Mann, 1992; Serrell, 1997) exhibit elements often receive less than 50 percent of active engagement in an exhibition environment. Moreover, an average visitor spends less than thirty seconds for visually contacting with an exhibited object (Koran & Koran, 1983). Serrell (1997) states that a visitor can cover an area of 28 square meters per minute on average of an exhibition area. Furthermore, a successful speed for covering a 28 square meter of an exhibition area can be done averagely per minute (Serrel, 1996). Visitors that make more stops and move slowly in the
exhibition space are more engaged than visitors who move quickly from one object to another (Serrell, 1997). Visitors that make more stops are actively engaged with the exhibit objects because they examine more objects at an exhibition area. Last, visitors that examine the exhibits, read the exhibit labels and have discussions with companions are actively engaged with the exhibit elements (Serrell, 1997).
2.2.2. Measures of Association
Time-based statistics are used for measuring visitor engagement in exhibition spaces. Time has been used as a powerful measure for visitor attention (as cited in Sandifer, 2003). Prior knowledge focused on mainly three statistical measures for visitor attention (Sandifer, 2003). These measures of association are defined below:
Holding Power (HP)
Holding power is the ratio (averaged over visitors) spent at an exhibition space to review the exhibit objects, read the exhibit labels, and make sense of the key points of the exhibition (Sandifer, 2003). Holding power can be calculated through finding the mean of total time spent at an exhibition space by visitors.
Average Holding Time (AHT)
Average Holding Time is defined as the average time that a visitor spends at an exhibit. Average holding time measures the duration of active
engagement (Sandifer, 2003). According to Sandifer (2003, p.131) average holding time is calculated by the formula presented below:
AHT = Total time spent at the exhibit by engaged visitors / Total number of engaged visitors
Average holding time is deferred according to the characteristics of the exhibit elements, the number of exhibit objects and the content of the
exhibition. However, Sandifer (2003) found that 36 seconds to 1 minute is the average holding time of %35 of the exhibit elements. Average holding time has no upper or lower limits, but Sandifer (2003) concluded in his study that limits of holding time varies between 0.2 to 5.9 minutes.
Attracting Power (AP)
“Attracting power is typically defined as the percentage (fraction) of visitors who stop at a given exhibit for a minimum amount of time (e.g., 5 seconds)” (Sandifer, 2003: 122). According to Sandifer (2003, p.131) attracting power is calculated by the formula presented below:
AP = Number of visitors who became engaged with the exhibit / Total number of visitors who enter the exhibition
All of these measures of association presented above can be examined per visitor or per exhibit. Mean, median or distribution of measures can be calculated respectively for all visitors and exhibits (Sandifer, 2003).
2.3. QR Codes
As was previously mentioned, there are a variety of ways to deliver
information in exhibition spaces. The information related to exhibit objects could be delivered by exhibit labels and text panels as well as technological devices. Developments in digital technologies and the availability of
technology mediums lead museums to integrate these systems into information delivery methods. There are different forms of digital
technologies that can be used for delivering information about the exhibit objects. These are; quick response (QR) codes, radio frequency identification tags (RFID), personal digital assistant (PDA) system, touch screen devices, virtual reality (VR) applications, etc. To answer the research question of “How does using QR Codes as an information delivery method influence user engagement in exhibition spaces?” QR codes and QR code studies done in museums will be examined in the next chapters.
2.3.1. What are the Quick Response (QR) Codes?
“A QR code is a type of matrix bar code or two-dimensional code designed to be read by smartphones.” (Shin, Jung & Chang, 2012, para. 1) Example of a QR code can be seen in Figure 8. Black modules inside the code enable users to connect to a website. The information can be a text, image, sign, URL or any other alternative media. QR codes are interactive methods because a QR code’s basic feature is responsive interaction (Shin et al., 2012). QR codes are an effective way of delivering information because they have sufficient speed to transfer data. A person can easily access a data no matter how many times a QR code is scanned. Also, using QR codes
enables users to have total control of the information delivery activity. Lastly, QR codes offer interactive and cost-effective experiences to their users.
Figure 8. Example of a QR Code, accessed from
https://upload.wikimedia.org/wikipedia/commons/d/d0/QR_code_for_mobile_ English_Wikipedia.svg
Research for measuring the usage level of QR codes is mostly done for the marketing sector. Demir et al. (2015) conducted a study for measuring the usage level of QR codes for mobile marketing among college students in a private collage located in Turkey. According to the survey results, more than 80 percent of the students recognized the QR codes but only half of the students had used a QR code before the study (Demir et al., 2015). Demir et al. (2015) state that the main usage of the QR codes is in marketing. Also, QR codes are often used for accessing additional information such as
graphics, videos, audio, etc. Moreover, women students are more interested in QR codes than men. The study concluded that the current interest in QR codes is low because of the recognition level. However, the possibility of using the codes is higher because of the adaptation levels of QR codes among college students in the near future (Demir et al., 2015).
2.3.2. QR Code Studies in Museums
Museums and curators are increasingly looking for new digital technologies to better serve their visitors. Developments in digital technologies and the availability of technology media lead museums to integrate these systems into their information delivery methods. There are different forms of digital technologies that can be used for delivering information about the exhibits. QR codes are new alternative tools for delivering information. In response to the increased used of QR codes for a marketing tool, museums are starting to use this technology in exhibition spaces. Therefore, there are limited numbers of studies investigating the use of QR codes in museums. This section of the review will focus on previous QR code studies in museums.
Schultz (2013) conducted a study to investigate patrons’ and staff members’ perceptions and expectations about using QR codes in museums and
libraries. The study took place in the Museum of Inuit Art and Ryerson
University Library. Both of the institutions have recently added the use of QR codes in different areas. In the Museum of Inuit Art, QR codes were used at one exhibition hall beside a couple of artworks. There was written information about the exhibits but QR codes directed the visitors to additional information about exhibits such as a link to a video or a map. Also, museum patrons placed a QR code connecting their visitors to a link to the museum’s social media accounts at the entrance of the museum. Schultz collected data from interviews with patrons and staff members. At each institution, 12 staff members and 16 patrons were interviewed (Schultz, 2013). There are three themes according to the results. First, most of the patrons and staff members
(approximately 54%) suppose that mostly younger people use QR codes because it requires a smartphone. Second, most of the participants
(approximately 54%) think that QR codes provide information with a sufficient speed but it is a one-way communication tool. However, some staff members indicate that QR codes could be used to start a conversation and interaction between visitors, artists, and patrons (Schultz, 2013). Last, most of the participants think that QR codes can be used to personalize their visit to museums (Schultz, 2013). Figure 9 indicate bar charts for patrons’
knowledge, general reactions, and reactions to institutions about QR codes. These data applies to both the Museum of Inuit Art and Ryerson University Library.
(a)
(b)
(c)
Figure 9 (a) Patrons’ (observed not using QR codes) Knowledge about (b) General Reactions about the use of QR codes
(c) Reactions to Institutions Adapted from “A case study on the appropriateness of using quick response (QR) codes in libraries and
museums” by M. K. Schultz, 2013, Library and information science research, 35(3), p.211.
Chivarov et al., (2013) studied the implementation process of using QR codes as an interactive presentation of the exhibits in the museums. Researchers prepared a guideline and suggestions for forming an
information delivery system using QR codes in museums. Chivarov et al., (2013) studied this process by explaining the technology and implementation process. Technology part gives explanations about QR generators, QR readers, how the system works, and the connection to the Internet. The first step of producing a QR code is using a QR generator program (Chivarov et al., 2013). An URL, text, picture or any other media can be used to generate a QR code. There are different alternatives to QR generator programs (see Figure 10).
Figure 10. Example of a QR Generator Web Page Adapted from “Interactive presentation of the exhibits in the museums using mobile digital
After generating a QR code there are three factors required to successfully decode it. These requirements are having a mobile device, having a QR reader application on the mobile device, and having an internet connection (Chivarov et al., 2013). After fulfilling all of the requirements explained above, the system is ready to be explored by the user. The user will open the QR reader application. The QR code will be scanned through the camera of the user’s mobile device. After scanning the code, the user will be automatically directed to the assigned multimedia page (webpage, video, text, picture, etc.).
Above, the technology needed for decoding a QR code is explained. To implement this technology to create interactive presentations of the exhibit objects, it is necessary to perform several scientific tasks (Chivarov et al., 2013). Firstly, the exhibit objects will be selected. Secondly, researchers will gather scientific information about the exhibits. According to Chivarov et al., information can cover past and current research about the selected items, dating, function, origin, and meaning of the artifacts. After preparing the text, it can be translated into several languages. Thirdly, the digital library will be created. This library can be constituted of related images and graphic reconstructions about the exhibit objects. Fourthly, prepared texts and
graphic elements will be gathered in a web portal of the museum. The design and organization of the web portal are very important. Designers should keep in mind that the portal should be easy to use, thematically oriented, and comprehensive (Chivarov et al., 2013). The final step is preparing information label cards with QR codes and placing the labels next to the related exhibits.
Chivarov et al. (2013) suggest that an informatory text can be placed at the entrance of the museum explaining how visitors will use their mobile devices to use the QR codes. According to Chivarov et al. (2013) expected results of such a study has a high potential transferring knowledge and modernizing the presentation of the museum exhibition. Moreover, this media will attract the attention of a new range of visitors and will create a possibility for communication among visitors on site and also after leaving the museum. Last but not least, this new technology will enhance the opportunity to educate museum visitors in a new, exciting, and engaging way (Chivarov et al., 2013).
Pérez-Sanagustín, Parra, Verdugo, García-Galleguillos, & Nussbaum (2016) conducted a study to investigate the use of QR codes to deliver information and its’ effects on visitor engagement. The study consisted of 2 groups and took place at Kew Public Garden Museum with 200 participants. During the first group, researchers compared using a QR code vs video screen (Figure 11 & 12) to deliver information. As a result of the first group, there is a greater consumption of textual content among the visitors rather than using the QR code (Pérez-Sanagustín et al., 2016). Figure 12 shows that QR codes only offer an additional video about the exhibits. In Figure 13 video is implemented to the label by the use of a screen. Therefore, visitors prefer to use screen & paper to gain information because of the ease of use. The second group compared delivering information by the use of One-Way QR and Two-way QR codes. One-Way QR codes enable visitors to only gain information about the exhibits while Two-way QR codes allowed visitors to
share comments with each other. This additional social aspect to the QR codes had a positive effect on the time spent at exhibition space by the visitors (Pérez-Sanagustín et al., 2016). The study concluded that further studies can investigate the usage of QR codes in different age groups. Finally, additional research can be done in museum environments.
Figure 11. QR code Label Panel
Figure 12. Screen Label Panel Adapted from “Using QR codes to increase user engagement in museum-like spaces” by Pérez-Sanagustín et al., 2016,
Studies presented above (Chivarov et al., 2013; Pérez-Sanagustín et al., 2016; Schultz, 2013) indicate that QR codes offer great potential of
transferring knowledge to museum visitors about exhibit objects. QR codes are cost-effective and easy to use. Also, they deliver a wide range of media such as text, video, graphics, photographs, audio, etc. Moreover, using QR codes will provide an opportunity to improve visitors’ experience while achieving institutional goals.
CHAPTER 3
METHODOLOGY
During the study, we aim to explore “How does using QR codes as an information delivery method influence user engagement in exhibition
spaces?” Regarding this research topic, there is a limited number of studies done comparing the visitor engagement level while using traditional exhibit labels versus new methods of information delivery such as QR codes (Pérez-Sanagustín et al., 2016; Schultz, 2013). Also, there are limited studies
investigating the use of QR codes as an information delivery method and its’ relationship between enhancing visitors’ level of learning and social
interaction in exhibition spaces. In addition, this study examines the influence of exhibit label characteristics to visitors’ label reading behavior. Therefore, the approach of this study is to analyze the use of QR codes for delivering information and its’ resulting effects on visitor engagement in exhibition spaces.
Another aim of this study is to find an answer to “How are younger people more likely to use QR codes in exhibition spaces?” According to a study, mostly younger people use QR codes because it requires a smartphone (Schultz, 2013). Regarding this research question, the present study aims to discover middle-aged visitors’ engagement level with the exhibits while delivering the information with QR codes in exhibition spaces.
To answer the research questions experimental research has been selected as the method of the study. Experimentation is explained as, recording observations, quantitative and qualitative data in defined conditions and followed by the examination of the data by statistical analysis to discover the existence of significant relationships (Nesselroade & Cattell, 2013, cited in Cash, Stanković, & Štorga, 2016). This type of study provides the best control over the variables. In this study, control and experiment conditions (Figure 13) are controlled variables to test visitor engagement level. During control condition, information tags with only written information are placed, while during experiment condition information tags with QR codes were placed among the exhibit objects. Different sample groups in different time periods participated in both conditions at the same exhibition place with the same exhibits. The experiment was followed by the measurement and result parts as explained in the Methodology Scheme (Figure 13). During the research, mixed methods will be used to analyze the level of visitor
engagement. Timing data and data from questionnaires will be collected as quantitative and qualitative data.
Figure 13. Methodology Scheme
This section covers the procedure, measurement, and instruments of the study. Pilot study, participants, setting of the experiment, analysis of the exhibit objects, and analysis of the information delivery methods will form the procedure section.
3.1. Procedure
A pilot study was conducted before the experiment to test the independent variables of the study. The experiment place was observed during the pilot study to understand the visitors’ circulation path. The website was designed to examine the online platform which is planned to use for creating the
website. Moreover, the QR code generator was tested for constituting the QR codes. Also, the design and placement of the information labels were
examined. After the pilot study, the experiment took place at Bilkent University Library Art Gallery and proceeded for one week. The selected exhibition was “Artist Friends: Selected works from the Alev-Kenan Eratalay collection”. Participants who entered to the gallery for the purpose of visiting
METHOD Control Group Information Tags Exhibit 30 Participants Experiment Group QR codes Same Exhibit 33 Participants MEASUREMENT Control & Experiment
Groups
Average Holding Time Age Profession Nationnality RESULTS Quantitative Qualitative