RESEARCH ARTICLE
The utility of NBS-profiling for characterization of yellow rust
resistance in an F
6durum wheat population
HALE A. TUFAN1, BELGIN GO¨ C¸MEN TAS¸KIN2* , RUTH MACCORMACK3, LESLEY A. BOYD3,4,
ZEKI KAYA5and MU¨ GE TU¨RET1
1Department of Molecular Biology and Genetics, Bogazici University, 34342 Bebek, Istanbul, Turkey 2Department of Biology, Mugla Sitki Kocman University, 48100 Mugla, Turkey
3Department of Disease and Stress Biology, John Innes Centre, Norwich Research Park, Norwich NR4 7UH, UK 4NIAB, Huntingdon Road, Cambridge CB3 0LE, UK
5Department of Biology, Middle East Technical University, Ankara 06531, Turkey
*For correspondence. E-mail: [email protected].
Received 6 September 2018; revised 11 June 2019; accepted 26 July 2019; published online 25 October 2019
Abstract. Seedling and adult plant (field) resistance to yellow rust in the durum wheat (Triticum turgidum ssp. durum) cross Kunduru-1149 x Cham-1 was characterized using a functionally-targeted DNA marker system, NBS-profiling. Chi-squared analysis indicated a four gene model conferring seedling yellow rust resistance against Puccinia striiformis f. sp. tritici isolate WYR85/22 (virulent on Yr2, Yr6, Yr7 and Yr9). Interval mapping located two QTL for yellow rust resistance on the long arm of chromosome 1B, while Kruskal–Wallis single marker regression identified a number of additional marker loci associated with seedling and/or adult plant, field resistance to yellow rust. These results suggested that much of the yellow rust resistance seen in the field may be due to seedling expressed resistance (R) genes. Characterization of the DNA sequence of three NBS marker loci indicated that all showed significant homology to functionally-charac-terized R-genes and resistance gene analogues (RGAs), with the greatest homology being NBS-LRR-type R-genes and RGAs from cereal species.
Keywords. disease resistance; durum wheat; NBS-profiling; quantitative trait loci analysis; yellow rust; Puccinia striiformis.
Introduction
About half of the agricultural land in Turkey is devoted to wheat production. In a more marginal wheat growing areas, durum wheat is preferred because of its drought tolerance (Go¨c¸men 2001). In these economically poorer regions, the deployment of disease resistance genes is the only eco-nomically viable option of disease control. Cultivated durum wheat is an allotetraploid (Triticum turgidum ssp. durum; AABB, 2n = 28) species originating from T. turgidum ssp. dicoccoides, a wild, emmer wheat, following the selection of free-threshing genotypes.
The rust diseases are a major constraint to wheat pro-duction in Turkey, as seen in all wheat growing regions of the world (Go¨c¸men 2001; Marris 2009). Among the rust diseases, yellow rust of wheat, also known as stripe rust (Puccinia striiformis f. sp. tritici) is by far the most important disease causing yield losses in all parts of the
country. A significant yellow rust epidemic occurs once or twice every decade, often more frequently (C¸ etin et al.
2000; Go¨c¸men2001; Chen2005; Gilbert2010). Since the year 2000, the central and west regions of Asia (including Turkey) has been plagued by severe epidemics of yellow rust, due to new virulent isolates of the fungus emerging (Ziyaev et al.2011).
It is estimated that most of the wheat genome is non-transcribed, consisting of transposons and duplicated pseu-dogenes, with *5% genes often present in clusters (Dilbirligi and Gill 2003; Gill et al. 2004; Feuillet and Eversole 2007). The genomic organization of wheat there-fore consists of small, gene-rich regions interspersed with large, gene-poor regions mostly made up of repetitive DNA (Dilbirligi et al. 2004; Charles et al. 2008). DNA marker systems that randomly target the genome therefore stand a high probability of falling within a noncoding region of the wheat genome. Alternative approaches, using known
https://doi.org/10.1007/s12041-019-1143-9 (0123456789().,-volV)(0123456789().,-volV)
transcribed sequences to develop DNA markers allows the gene rich regions of the genome to be targeted (van der Linden et al.2004).
The majority of cloned resistance genes (R-genes) encode for proteins with a nucleotide-binding site (NBS) domain and a series of leucine-rich repeat residues (LRR). The NBS domain is composed of a number of motifs which are highly conserved and considered unique to NBS-type R-genes, with the kinase 1a (p-loop), kinase 2 and the putative kinase 3a being the best conserved motifs (Meyers et al.1999; Dilbirligi and Gill2003; Mun et al.2009). The NBS-LRR-type R-genes, which are present in both mono-cot and dimono-cot plant species, tend to be present as multi-genic families along with resistance gene analogs (RGAs) (Hammond-Kosack and Jones 1997; Meyers et al. 1999; Ellis et al. 2000; Zhang et al. 2007; Miller et al. 2008; Ellen et al. 2009).
Using the search string ‘NBS-LRR’ the Chinese Spring RefSeq genome (International wheat genome sequencing
consortium et al. 2018) and the Svevo, durum wheat
RefSeq genome sequences reveal over 3600 and 3100 open reading frames annotated as potential NBS-LRR-type R-genes, respectively. While many of these may not be functional, the co-localization of R-genes and RGAs means that markers that target the conserved NBS-motifs have a higher probability of targeting genomic regions containing functional R-genes (Ayliffe and Lagudah 2004; Dilbirligi et al. 2004; Liu and Ekramoddoullah 2007; Maccaferri et al. 2019).
NBS-profiling (van der Linden et al. 2004) is a PCR-based marker system that screens for polymorphisms associated with conserved NBS-motifs. In potato, 50–90% of NBS-profiling fragments were found to be linked to disease R-loci and RGA sequences (Ayliffe and Lagudah
2004). NBS-profiling therefore provides a functionally-targeted marker system that enables the rapid identifica-tion of disease resistance genes, being particularly useful with large, complex plant genomes such as polyploid wheat.
The durum wheat variety Kunduru1149 has long been favoured by Turkish farmers for its suitability to arid con-ditions, but it lacks yellow rust resistance (Go¨c¸men 2001). At ICARDA in Syria a recombinant inbred lines (RIL) population (F6) was developed by crossing Kunduru-1149
with Cham-1, a durum variety known for its yellow rust field resistance. This material was developed as part of a breeding program to improve yellow rust resistance in the Kunduru 1149 background (Go¨c¸men et al.2003). The field resistance in this RIL population was previously characterized by Go¨c¸men et al. (2003).
The objective of the current study was to characterize the molecular basis of the seedling and adult plant resis-tance to yellow rust in the Kunduru-1149 x Cham-1 RIL (F6) durum wheat population using NBS-profiling as a
potentially powerful tool for molecular resistance
characterization.
Materials and methods
Plant material
The F6durum wheat RIL population used in this study was
developed at the International Centre for Agricultural Research in the Dry Areas (ICARDA, Aleppo, Syria) by Dr. M. Nachit and was provided by the Central Research Insti-tute for Field Crops (CRIFC; Ankara, Turkey). The popu-lation was developed from a cross between the yellow rust resistant durum wheat Cham-1 and the yellow rust suscep-tible Kunduru-1149 selection (Nachit et al. 2001; Go¨c¸men et al. 2003). The population, consisting of 150 RILs was previously tested for yellow rust resistance in the field at CRIFC against a P. striiformis field population (showing virulence for Yr2, Yr6, Yr7 and Yr9) (Go¨c¸men et al.2003).
Yellow rust disease assessment – seedling tests
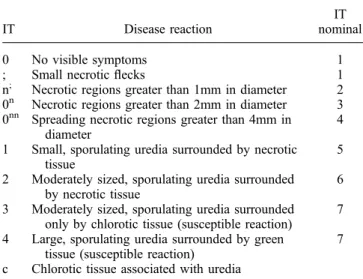
Seed of each of the 150 RILs and parents were pre-germi-nated in the dark at 25°C. Three days after sowing, five germinated seeds were transferred into John Innes number-2 compost, in 7x7 cm pots. The plants were grown in a spore-free greenhouse, with a 16/8 hour light/dark cycle supple-mented with sodium lighting (300lm m-2 s-1) at 18°C during the day and 15°C during the night (Boyd and Min-chin 2001). The International and European wheat differ-ential sets and the Avocet near-isogenic lines (NILs) for yellow rust (provided by C.R. Wellings, Plant Breeding Institute, Cobbitty, Australia) were included as controls. Fourteen day old seedlings were inoculated with the P. stri-iformis isolate WYR 85/22 (avir/vir 1,3,4,5,8,10,15,17/ 2,6,7,9). The inoculation procedure was as described by Boyd and Minchin (2001). Disease reactions were scored 14 days after inoculation using a modification of the Plant Breeding Institute, Cobbity, Australia descriptive infection type (IT) scale (table 1). For further analysis, the descriptive IT scale was converted to numerical values, ranked accord-ing to the phenotype of the plant resistance response (IT nominal; Rodrigues et al.2004). The greater the resistance response is (i.e. small versus large necrotic areas and small versus large uredia) the lower the numerical value (tables1
and 2).
Yellow rust disease assessment – field tests
Seed of the 150 RILs and the two parents were grown, in three replicates, in a disease nursery at the CRIFC in Ankara-Yenimahalle in 1999/2000 (Go¨c¸men et al. 2003). Yellow rust infection was measured on each RIL using the modified Cobb Scale. With this scale infection severity was evaluated from 1 to 100% and the following nomenclature used for the reaction type (RT); 0: no visible infection; R: Resistant, having necrotic areas with or without small uredia,
MR: Moderately Resistant, having small uredia surrounded by necrotic areas, MS: Moderately Susceptible, having medium-sized uredia, no necrosis, but some chlorosis pos-sible, S: Susceptible, having large uredia, no necrosis or chlorosis. The RT was converted to a numerical value using the conversions; R = 0.2, MR = 0.4, MR-MS = 0.6, MS = 0.8, MS-S = 0.9, and S = 1.0. Coefficient of infection (CoI) values were calculated for each RIL by multiplying the reaction intensity score by the reaction type numerical value (table 2) (Go¨c¸men et al.2003).
DNA extraction and marker analysis of yellow rust resistance
The 150 RILs were assessed based on their reaction to P. striiformis isolate WYR85/22. This produced four phe-notypic categories. A subpopulation of 53 lines were ran-domly selected which represented the four categories and maintained the same ratio of lines within each category. This subpopulation, along with the parents was used for DNA extraction and marker analysis. DNA was isolated from leaf tissue of uninfected 14 day-old seedlings using a modified protocol that combined the protocols for DNeasy 96 Plant kit and the DNeasy Plant Mini kit (Tufan2006). To determine chromosomal locations, the parents Kunduru 1149 and Cham-1 were screened with 75 SSR markers, including GWM (Ro¨der et al. 1998), BARC (Song et al. 2002) and WMC (Edwards et al.1996) wheat SSR markers. The SSR markers were selected, aided by the wheat consensus maps (Ro¨der et al.1998; Elouafi et al.2001andwww.graingenes. org) to represent each chromosome arm of the A and B genomes. Out of 75 SSR markers screened, 33 polymorphic SSR markers were selected, representing at least one marker per chromosome arm.
For NBS-profiling, the protocol of van der Linden et al. (2004) was used. Genomic DNA was digested with the
restriction enzyme MseI. Selective NBS primers NBS2 (targets the conserved p-loop/kinase-1a motif) and NBS5 (kinase-2 motif), plus a modified NBS2 primer, NBS3 (Calenge et al.2005) were used to amplify the target DNA along with the adapter primer (van der Linden et al.2004). NBS2 and 3 were designed to amplify DNA 50 of the tar-geted NBS-motif, while NBS5 amplifies 30.
Both polymorphic SSR markers and NBS-profiling PCR products were separated on 5% denaturing polyacrylamide gels (19:1 acrylamide/bisacrylamide) and visualized by sil-ver staining (Boyd et al. 2002). Polyacrylamide gels were run in 1 x TBE buffer (Seven Biotech Ltd) for 90 to 120 min at 80 Watts. To perform silver staining, polyacrylamide gels were passed through the following steps; fixation for 30 min 10% acetic acid; washed in ddH2O for 10 min; stained in
silver nitrate solution (0.0057N silver nitrate plus 0.15% (v/v) formaldehyde) for 30 min; and placed in developer (0.73M sodium carbonate, 0.15% (v/v) formaldehyde plus 0.015N sodium thiosulphate), chilled to 4°C, until bands were clearly visible. The reaction was then stopped by adding 10% acetic acid to the developer.
The parents and each RIL of the subpopulation were screened with the polymorphic SSR markers and the three NBS primers. For SSR markers polymorphism is detected based on a shift in the size of the bands amplified in each parent. The allele contributed by the susceptible parent, Kunduru-1149 was designated as the ‘a’ allele, while the allele contributed by the resistant parent, Cham-1 was designated as the ‘b’ allele. NBS-profiling bands are dominant, so the RIL will either show a band representing an allele from one of the parents, or no band, as in the other parent. Bands present in the resistant parent were designated ‘c’, the null allele (absence of the band in the susceptible parent) being designated ‘a’. Bands present in the susceptible parent, but absent from the resistant parent were designated ‘d’, the null allele (no band) being des-ignated ‘b’.
Scores from SSR and NBS-profiling marker analyses were entered into JoinMap version 5.0 for Windows (Kyazma; Stam and Ooijen 1995). Linkage groups were determined using a minimum LOD score of 3.0 and a maximum recombination frequency (REC) of 0.45. The recombination values were converted into genetic distances using the Kosambi mapping function. Linkage groups formed in JoinMap, along with phenotypic data and marker scores were entered into the QTL mapping program MapQTL version 5.0 for Windows (Kyazma). MapQTL was used to locate QTLs for resistance to yellow rust in the Kunduru-1149 x Cham-1 subpopulation using the Kruskall–Wallis and interval mapping (IM) functions. Kruskall–Wallis is a nonparametric test in which no assumptions are made about the probability distribution of the quantitative trait (Ro-drigues et al.2004). For QTL mapping an imposed signifi-cance value of 5% gave an upper LOD signifisignifi-cance threshold of 1.7 following a permutation analysis (1000 permutations, MapQTL).
Table 1. IT scale used to score yellow rust infection on wheat seedlings and corresponding numerical IT nominal used for genetic mapping.
IT Disease reaction
IT nominal 0 No visible symptoms 1 ; Small necrotic flecks 1 n; Necrotic regions greater than 1mm in diameter 2
0n Necrotic regions greater than 2mm in diameter 3
0nn Spreading necrotic regions greater than 4mm in diameter
4 1 Small, sporulating uredia surrounded by necrotic
tissue
5 2 Moderately sized, sporulating uredia surrounded
by necrotic tissue
6 3 Moderately sized, sporulating uredia surrounded
only by chlorotic tissue (susceptible reaction)
7 4 Large, sporulating uredia surrounded by green
tissue (susceptible reaction)
7 c Chlorotic tissue associated with uredia
Table 2. Seedling and adult plant, field yellow rust infection phenotypes of parents and 150 RILs of the Kunduru-1149 x Cham-1 cross.
Line IT
IT
Nom CoI Line IT
IT
Nom CoI Line IT
IT
Nom CoI Line IT
IT Nom CoI 1a ;/0n/cto 3 3.60 10.13 40 3/4 7.00 17.50 79b 0c 2.10 3.47 118a ; to 3 2.20 2.27 2 ; to 1 1.60 4.47 41 ; 1.00 1.33 80b ; 1.00 0.13 119 0n/cto 1/2 3.80 10.25 3a ;/0n/cto 3/4 3.70 3.90 42a ;/0n/c to 2 2.10 19.25 81 ; 1.00 1.47 120b 0n/cto 1/2 4.30 16.00 4a ;/0n/cto 2 2.20 1.47 43b ; 1.00 0.13 82a 0n/cto 3/4 4.90 1.80 121 ;/0n/cto 1/2 3.30 21.00 5 ; 1.00 0.13 44 ; 1.00 0.13 83 ; 1.00 7.13 122a ; to 2/3 3.00 15.33 6 ; 1.00 0.00 45b ; 1.00 0.27 84 2/3 5.70 13.13 123b ; 1.00 0.00 7b ; 1.00 0.00 46 0n/c to 2 3.30 21.15 85 ; 1.00 10.15 124 1 to 2 4.00 19.42 8b ; 1.00 0.00 47b ; 1.00 0.13 86b ; 1.00 0.20 125a ;/0n/cto 3/4 2.80 25.50 9b ; 1.00 0.00 48 ;/0n/c 1.80 5.90 87a ; to 3/4 5.10 3.25 126 0n/cto 2 4.30 50.00 10 ; 1.00 0.00 49b ;/0n/c 1.20 0.00 88b ;/0n/c 1.60 6.00 127b 2 to 3 6.50 34.00 11b 0n/c/1 3.00 6.73 50 ; 1.00 0.00 89b ;/0n/c 2.10 8.53 128a 0n/cto 2/3 4.25 17.33 12 ; 1.00 4.27 51b 0n/cto 1 3.20 17.58 90a ; to 2/3 3.80 4.33 129 0n/cto 2 3.70 7.33 13b 0n/c 1.90 21.00 52 ; 1.00 0.27 91 ; 1.00 18.48 130a ; to 3/4 2.00 0.00 14 1 to 2 4.20 9.75 53b 2 to 4 6.30 33.00 92a ;/0n/cto 1/2 2.00 3.23 131b 2 to 3 5.80 64.67 15 ; 1.00 0.00 54 ; 1.00 0.13 93 1 to 2 4.50 5.60 132 ; 1.00 0.00 16 ; 1.00 0.00 55 ; 1.00 0.00 94b 0n/c 2.00 4.33 133 1 to 2 4.50 14.43 17a 0n/cto 3/4 3.90 22.30 56 1 to 3 5.20 21.00 95 ; 1.00 1.13 134 1 to 2 4.20 22.50 18b ; 1.00 0.00 57 ; 1.00 1.50 96b ; 1.00 0.13 135b 3/4 7.00 18.75 19b 3/4 7.00 37.50 58 1 to 3 5.10 30.00 97b 3/4 7.00 16.68 136 1 to 2 5.50 21.33 20a 0n/cto 3 4.20 3.40 59 ; 1.00 0.00 98 ; 1.00 6.67 137 1 to 2 4.20 6.65 21 0n/cto 1 3.40 24.33 60 ; 1.00 0.27 99b ; 1.00 0.13 138 ; 1.00 3.77 22 3/4 7.00 7.33 61b 3/4 7.00 11.40 100b ;/0n/c 1.30 0.13 139 0n/cto 2 3.60 26.17 23b 2 to 3 6.20 11.83 62b ; 1.00 0.00 101 ; 1.00 0.00 140b 3/4 7.00 15.33 24 0n/cto 1 3.10 8.98 63a ; to 1/2 3.20 7.00 102 ; 1.00 5.20 141b 0c 2.00 0.00 25 ; 1.00 0.30 64 2/3 5.50 8.85 103b ;/0n/cto 1 1.80 12.47 142 ;/0n/c 1.20 0.40 26b ; 1.00 0.13 65a ; to 1/2 3.30 4.90 104 0n/cto 1 3.00 7.37 143 ; 1.00 0.67 27 1/2 to 3 4.70 19.00 66a ; to 1/2 1.75 16.13 105 0n/c 3.00 2.65 144a 0n/cto 3/4 3.60 18.00 28b ; 1.00 0.00 67 2 to 3/4 6.10 27.83 106 ; 1.00 4.58 145 0n/cto 2/3 5.50 13.08 29b ;/0c 2.00 0.00 68b ; 1.00 0.00 107 0n/cto 2 4.30 4.47 146 ; 1.00 0.53 30 3/4 7.00 2.73 69 ; to 2 4.00 8.13 108b ; 1.00 0.00 147 0n/cto 1 3.40 18.83 31b ;/0n/c 1.70 3.20 70b ; to 2 3.20 7.33 109b ;/0n/c 1.80 0.73 148b 0c 2.00 0.00 32 0n/c 1.80 16.08 71b 2/3 6.30 10.00 110b ; 1.00 0.13 149 0c 2.00 0.87 33 ; 1.00 0.40 72b 3/4 7.00 22.50 111b 1/2 to 3 5.40 11.05 150 ; 1.00 0.40 34b 3/4 7.00 10.33 73 ; 1.00 0.00 112b ; to 1/2 2.20 11.25 35b ;/0n/c 2.30 19.10 74 ; 1.00 1.60 113 ; 1.00 4.00 151b 2 to 3 5.30 60.00 36 ;/0n/c 1.30 0.27 75b 1 to 3 5.70 21.92 114 ; to 1 1.70 0.40 152b ; 1.00 0.00 37a ; to 2 2.30 58.00 76 1 to 3 5.70 27.75 115b ; 1.00 0.00 38 ;/0n/c 1.20 0.13 77a ; to 3/4 3.90 14.40 116b ; 1.00 1.00 39a 0n/cto 5.10 2.27 78 ; 1.00 0.13 117 0n/cto 1/2 3.70 11.47
IT, seedling infection type score; IT Nom, average seedling infection type nominal from five seedlings; CoI, coefficient of Infection of adult plant, field scores (Go¨c¸men et al.2003); 151, Kunduru-1149; 152, Cham-1.
a
Lines segregating for seedling yellow rust infection phenotypes.
b
Lines selected for marker analysis.
c
Statistical analysis of yellow rust resistance
Chi-squared (v2) analysis was used to predict the number of genes conferring seedling yellow rust resistance in the Kunduru-1149 x Cham-1 cross against P. striiformis isolate WYR85/22. The models for 1 gene (1R:1S), 2 genes (3R:1S), 3 genes (7R:1S), 4 genes (15R:1S) and 5 genes (31R:1S) segregating within a recombinant inbred popula-tion were tested. A correlapopula-tion analysis was carried out comparing the seedling IT nominals to the adult plant CoI values using Genstat (version 7.0 for Windows).
Sequence analysis of polymorphic NBS bands
NBS bands were excised from the parent that donated the band and one line that carried the band. NBS bands were cut from the polyacrylamide gel and left in 100 lL 1X TE overnight at 4°C. The gel slice was heated at 50°C for 10 min and centrifuged at 16,000 rpm for 5 min. The super-natant was re-amplified using the same primers and PCR conditions as used for the exponential PCR step of the NBS-profiling protocol (van der Linden et al.2004; Calenge et al.
2005). PCR products were cloned into the pGEM-T Easy vector (Promega) as described by Smith et al. (2002). Sixty white recombinant colonies of each cloned band (30 from the parental donor and 30 from the positive RIL) were selected. Plasmids were isolated using the Wizard Plus SV Minipreps DNA purification system (Promega). The size of the insert in each recombinant plasmid was confirmed by T7-Sp6 PCR amplification (Smith et al.2002). Single strand confirmation polymorphism (SSCP) analysis (Hayashi1991) was carried out on plasmid insert DNA to identify a pre-dominant clone type (Smith et al.2002).
The DNA inserts from 12 recombinant plasmids of each cloned NBS band were sequenced using the BigDye (Ap-plied Biosystems) sequencing reaction system with the T7 primer. Sequence reactions were read using an ABI 3700 automated sequencer (Applied Biosystems, USA). All 12 sequences were analysed using the Gap 4 program (version 4.10) (Bonfield et al.1995). DNA sequences obtained from the same cloned NBS band, but displaying less than 95% homology were considered distinct sequences and removed from further analysis. A consensus sequence was con-structed for each NBS band from the contig of the remaining sequences. The consensus sequence was blastx (nucleotide query – protein database; Altschul et al. 1997) searched for homology to other sequences held within the NBCI data-bases (www.ncbi.nlm.nih.gov).
Results
Genetic assessment of seedling and adult plant (field) yellow rust resistance in the durum wheat Kunduru-1149 x Cham-1 cross.
The 150 RILs of the Kunduru-1149 x Cham-1 population were tested for seedling yellow rust resistance using the P. striiformis isolate WYR 85/22 (virulent for Yr2, Yr6, Yr7, Yr9). Isolate WYR 85/22 was chosen because its virulence profile represented that of the isolate mixture used in field tests to determine adult plant yellow rust resistance in the Kunduru-1149 x Cham-1 RIL population (Go¨c¸men et al.
2003). Ten lines were fully susceptible as seedlings to isolate WYR85/22, having IT3/4, the remaining 140 lines showing some degree of resistance (table2). Chi-squared analysis gave an optimum fit to an expected ratio of 15R:1S (v2= 0.044, df = 1), which for a homozygous, RIL popu-lation indicates a four resistance gene model.
Kunduru-1149, the yellow rust susceptible parent, was not fully susceptible in seedling tests, with 23 of the lines being more susceptible than Kunduru-1149 (table2). This was not observed in the field tests, where only one line was slightly more susceptible than Kunduru-1149. This would indicate residual seedling resistance in Kunduru-1149 towards isolate WYR85/22. Seedling yellow rust IT nominals were com-pared to the adult plant CoI values obtained by Go¨c¸men et al. (2003) (figure1). Some of the lines deviated from the predicted linear correlation (r = 0.60), being susceptible at the seedling stage, but resistant to yellow rust in the field, indicating resistance segregating in this cross that was not detected by isolate WYR85/22.
Genetic marker analysis of seedling and adult plant (field) yellow rust resistance in the durum wheat Kunduru-1149 x Cham-1 cross
Within the Kunduru-1149 x Cham-1 RIL population 22 lines (14.6%) were segregating for seedling yellow rust resistance, indicating residual heterogeneity within those lines (table2). These lines were therefore omitted from the marker analysis. To concentrate the marker analysis to those regions of the wheat genome having a higher probability of containing functional R-genes, NBS-profiling was applied (van der Linden et al.2004). To optimize the NBS-profiling system, and to test its utility in a cross population, the marker analysis was carried out in a randomly selected, 53 RIL subpopulation of the Kunduru-1149 x Cham-1 cross (fig-ure2). However, to ensure optimal genetic variation within this subpopulation all disease phenotypes were equally represented, comparable to the original population.
Three NBS primers; NBS2, NBS3 and NBS5 were screened against Kunduru-1149 and Cham-1 using the restriction enzyme, MseI (van der Linden et al. 2004; Calenge et al. 2005). NBS-profiling produces dominant markers, with bands being present in one parent and absent in the other. Polymorphic bands, present in Kunduru-1149 and Cham-1 were scored. In total, 14 polymorphic NBS bands were selected for mapping in the subpopulation. Five bands originated from NBS2 (3.8% polymorphism), six from NBS3 (5.0% polymorphism) and three from NBS5
(2.5% polymorphism), all in combination with MseI. NBS-MseI band profile’s ranged in size from 100 to 800 bps (figure 2).
A and B genome SSR markers were used to identify the chromosomal locations of yellow rust resistance loci identi-fied within the cross. Seventy-five SSR markers were screened against the parents Kunduru-1149 and Cham-1, of which 39 were polymorphic (52%). Thirty-three of these polymorphic markers were successfully screened in the subpopulation, providing an SSR marker locus for nearly all chromosome arms. Six linkage groups were formed using a mapping LOD threshold of 3.00 (figure 3). Linkage group 1: The four NBS marker loci, NBS2-350, NBS2-750, NBS3-350 and NBS3-800 formed a single linkage group. Linkage group 2: three SSR markers (BARC188, GWM268 and GWM153) assigned to the long arm of chromosome 1B amplified loci linked to the NBS locus NBS3-290. Linkage group 3: loci of the SSRs GWM297 (7BS) and GWM333 (7BL) linked with the NBS marker locus NBS2-290. Linkage group 4: the SSR GWM526 (2BL) identified a locus linked with NBS locus NBS2-325. Linkage group 5 consisted of
SSR loci on chromosome 3A, Xgwm376 (3AS) and Xg-wm391 (3AL). Linkage group 6: the two 1BL SSRs,
BARC181 and WMC156 (Somers et al. 2004), while
remaining unlinked to the 1BL SSR marker loci forming Linkage group 2, did link together, forming Linkage group 6. The seedling and adult plant, field yellow rust infection phenotypes were analysed separately using the Kruskal– Wallis and IM functions in MapQTL (version 5.0 for Win-dows). Two significant QTL associated with yellow rust resistance (LOD values above the LOD threshold of 1.7) were identified on the long arm of chromosome 1B using the seedling yellow rust data set (figure4). The QTL of biggest effect, explaining 25% (LOD=2.11) of the phenotypic vari-ation segregating in the Kunduru-1149 x Cham-1 cross lay on Linkage group 2, between loci Xgwm153 and NBS3-290. This QTL was given the designation Qyr.jic-1B.1. The sec-ond QTL, explaining 19% (LOD=2.19) of the phenotypic variation, was associated with the SSR loci Xwmc156 and Xbarc181 (linkage group 6), and was given the designation Qyr.jic-1B.2. Both QTL were derived from the yellow rust resistant parent, Cham-1.
Figure 1. Correlation between seedling IT nominal scores and adult plant, coefficient of infection values of yellow rust infection in the Kunduru-1149 x Cham-1 population. The linear correlation has an r-value = 0.60.
Figure 2. NBS2-Mse1 primer profile of the 53 RILs and parents of the Kunduru-1149 x Cham-1 cross. The two polymorphic bands, NBS2-290 and NBS2-350 are highlighted.
70 C: Cl> 60 O U ·
-~
-u_ C:so
Cl> Cl'>'E
'cit 40 - Cl>'o
a:
- -
C: C: Cl> ~ 30·
c::; ii:
!E Cl> : ,.=
20 O't:J <.>-
<( 10 0 0 1~
---
...
...ww-
---
_
·
-
•
·
2 3 4s
6IT nominal (Seedling Resistance)
l,j
'
M
.~
.-IJ'lf ,.•··
'l"
7 I 8 BS2350 BS2 290With the adult plant, field yellow rust data set a significant QTL (Qyr.jic-1B.2) was also found associated with loci Xwmc156 and Xbarc181 (LOD=2.42), accounting for 20.8%
of the phenotypic variation (figure 4). However, Qyr.jic-1B.1, located between loci Xgwm153 and NBS3-290, was not detected by IM using the adult plant, field data set,
Figure 3. Linkage groups identified in the Kunduru-1149 x Cham-1 cross. Marker loci showing significant associations with yellow rust resistance following a Kruskal–Wallis analyses (MapQTL, version 5.0 for Windows; Van Ooijen et al.2004) of the seedling (asterisk; *) and adult plant, field (cross; ?) yellow rust data sets are shown at P \ 0.1*, 0.05**, 0.01***, 0.005****, 0.001***** and 0.0005******.
Figure 4. (a) The wheat consensus map of Somers et al. (2004) was used to align, (b) linkage groups 2 and 6, and the unlinked marker locus, Xgwm140 on the long arm of chromosome 1B. (c) QTL for yellow rust resistance found on the long arm of chromosome 1B in the Kunduru-1149 x Cham-1 cross. Two significant QTL, Qyr.jic-1B.1 and Qyr.jic-1B.2, were identified by IM (MapQTL, version 5 for Windows) using the seedling yellow rust data set (solid line). However, only Qyr.jic-1B.2 was significant with the adult plant, field yellow rust data set (broken line). The LOD values associated with each significant QTL peak are given for the seedling yellow rust data set (plain text) and the adult plant, field yellow rust data set (italics).
Dist CM 0 2 8 10 L 11k11 0 15 17 M r1ler ,ES:'
..
,
.
G1oup1 NS.
,.,
...
.
.
,,,,. ~ m f 6.UJ -20 , r,4,,•1 .. ,. Link ge GrOUJ) 2 chrornosome 18) (a) OIU e,
l<tf cM '.11 ...,:,.
lll f ' SI 1•1 11,
..
,
0 Sia M.irker Olll-t. nee Marker
CM CM
:i
I • 7 0 awmJl. •( • J m Ink Cf0Uf}3 (chromo ome 7B) 0 Ill'} ~ll•
fff/l~J Lin geCroup5 {chromoson'l 3A) Link ,: Croup 6 ( liromos.ome 18) I C L nk gc Group" ( 11romosom 28) (b) (c) OIHD"
M.>rl<er 01 l;,n(c,,
.
rker cM cMo-fl-1 ••
..
·
,
''.
t-v
.
,
.
q.
,.,.
,,es , 1$ • I,..,,~
IT'
m• l ,, r'
.
.
'
I I I I I o-{r ,nf,•
--fr-although a significant association was found with these marker loci in the Kruskal–Wallis analysis (figure 3). In addition, the Kruskal–Wallis analysis identified significant marker loci associations on linkage groups 1 with both the seedling and adult plant yellow rust phenotype data sets (figure 3).
Sequence analysis of NBS markers
Three NBS loci, NBS3-290, NBS2-350 and NBS2-290, were selected for sequencing. NBS3-290 (linkage group 2-1BL) was associated with both seedling and adult plant, field yellow rust resistance (figures3 and 4), NBS2-350 (linkage group 1) was only associated with seedling yellow rust resistance (figure3), while NBS2-290 (linkage group 3; figure3) showed no association with yellow rust resistance in the Kunduru-1149 x Cham-1 cross against the P.
striiformis isolates used in the seedling and field yellow rust assessments.
Although the cloned NBS bands all produced PCR fragments of the expected size, SSCP analysis indicated the presence of multiple DNA sequences, a single domi-nant clone not being distinguishable. Therefore, for each isolated NBS band six clones from the donating parent and six clones from a RIL containing the band were sequenced. For each NBS band a consensus sequence was obtained using Gap 4 (version 4.10). For NBS2-290 and NBS2-350, 11 DNA sequences all formed one contig. With NBS3-290 eight of ten DNA sequences formed one contig (table3). NBS2-290 and NBS3-290 produced the same DNA sequence, although linkage analysis placed these two NBS bands on different linkage groups, Linkage group 3 (chromosome 7B) and 2 (chromosome 1B), respectively.
Table 3. The nucleotide and predicted protein sequences of three cloned NBS loci. The p-loop motif of the NBS domain is marked in bold.
NBS3-290 (Genbank accession number: DQ978778.1)
gtttactcgattctcaacccgaaagtatagatcccataaggtctttagtaaaattgccgagg L L D S Q P E S I D P I R S L V K L P R aagttatagagatagagggggagatcaggcacatcaaagaactacatatttattggagta K L - R - R G R S G T S K N Y I F I G V ctatagtccaacccattagaaatgagcatgcagaggttgataggcagcgatgaggacctt L - S N P L E M S M Q R L I G S D E D L gtcggaattggtgaaaacaggggcaagttgaccgaatggctgatcaccgatgaaaaagaa V G I G E N R G K L T E W L I T D E K E accacagtgattacagtttctggcatgggcggcttgggcaaaacaac T T V I T V S G M G G L G K T
NBS2-290 (Genbank accession number: DQ978777.1)
gtttactcgattctcaacccgaaagtatagatcccataaggtctttagtaaaattgccgagg L L D S Q P E S I D P I R S L V K L P R aagttatagagatagagggggagatcaggcacatcaaagaactacatatttattggagta K L - R - R G R S G T S K N Y I F I G V ctatagtccaacccattagaaatgagcatgcagaggttgataggcagcgatgaggacctt L - S N P L E M S M Q R L I G S D E D L gtcggaattggtgaaaacaggggcaagttgaccgaatggctgatcaccgatgaaaaagaa V G I G E N R G K L T E W L I T D E K E accacagtgattacagtttctggtatgggcggcttaggcaaaacaac T T V I T V S G M G G L G K T
NBS2-350 (Genbank accession number: DQ978779.1)
gtttactcgattctcaacccgaaagtatagatcccataagctgaaggaccgccatcggatt F T R F S T R K Y R S H K L K D R H R I gccagccaaattcgtgatctcaaagcaagagtagaagaggtgagcaacaggaacacacgc A S Q I R D L K A R V E E V S N R N T R tacaacttgatcaccgtcgatgcctccagtagcattgatgaggtgaattcctacacggaa Y N L I T V D A S S S I D E V N S Y T E gatattcgcaaccactcagctagcaacattgatgaggcagagcttgtgggctttgctaag D I R N H S A S N I D E A E L V G F A K gctaaacaagagctgattgagatggtggatgtcaactccagagatggtctttgcaagatg A K Q E L I E M V D V N S R D G L C K M atatttctcgttggtatgggcggcttaggcaaaacaac I F L V G M G G L G K T ______________________________________________________________________
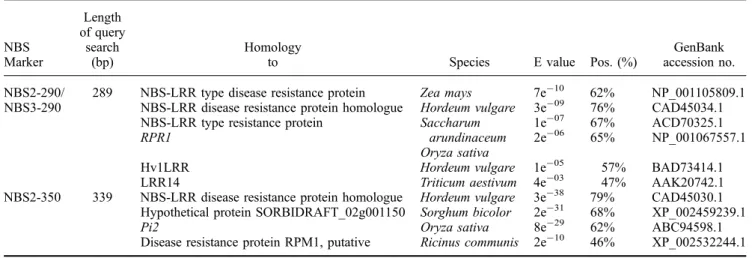
A Blastx analysis produced hits to phenotypically identi-fied NBS-LRR-type R-genes and to DNA sequences pre-dicted to be NBS-LRR-type R-genes, i.e. RGAs (table 4). Those hits with the greatest amino acid similarity were to R-genes and RGAs from cereal species. The NBS2-350 sequence showed 62% amino acid similarity to the cloned rice blast resistance gene Pi2 (Zhou et al.2006). NBS2-290 and NBS3-290 produced the same blastx hits, showing 65% amino acid similarity to the rice R-gene RPR1 (Sakamoto et al.1999), 57 % similarity to the barley Hv1LRR sequence (Feuillet and Keller 1999) and 47% similarity to a wheat candidate R-gene for leaf rust resistance, LRR14 (Feuillet et al. 2001). NBS2-350 and NBS2/3-290 hits to cereal RGAs showed as much as 79% and 76% similarity, respectively.
Discussion
Genetic characterization of seedling yellow rust resistance in the Kunduru-1149 x Cham-1 cross identified four genes conferring seedling resistance to the P. striiformis isolate WYR85/22 (vir Yr2, Yr6, Yr7, Yr9). At least one resistance gene was derived from Kunduru-1149, the yellow rust sus-ceptible durum wheat variety, as seen by transgressive seg-regation of seedling yellow rust resistance in the Kunduru-1149 x Cham-1 RIL population. The location of three of these yellow rust R-genes were identified, using a relatively small number of DNA markers, of which two were associ-ated with NBS marker loci. Analysis of the adult plant, field yellow rust phenotypes identified the same three genetic locations detected with the seedling data set, i.e. on linkage groups 1, 2 (chromosome 1B) and 6 (also chromosome 1B). However, as the P. striiformis isolates used in the field tests in Turkey were not available to carryout seedling tests, no
definitive conclusions can be made about the nature of the field resistance, which may also be expressed at the seedling growth stage.
A study by Vales et al. (2005) indicated that QTL could be identified in populations as small as 50 individuals if the genetic contribution to the phenotype was sufficiently large. IM carried out in a subpopulation of the Kunduru-1149 x Cham-1 RILs was able to identify two QTL located on the long arm of chromosome 1B which contributed to seedling and adult plant yellow rust resistance. Although increasing the population size may identify QTL of small effect, when selecting for disease resistance within a wheat breeding program it is the QTL/genes of large effect that the plant breeder is mostly interested in.
Kruskal–Wallis single marker regression analysis identi-fied the genomic regions containing 1B.2 and Qyr.jic-1B.1 with both the seedling and adult plant, field data sets. However, IM did not locate Qyr.jic-1B.1 using the adult plant, field data set. Examination of the RILs carrying the Cham-1 allele at locus Xgwm153 (Qyr.jic-1B.1 – peak marker locus) confirmed a significant association with both seedling and adult plant, field yellow rust resistance, the mean seedling IT nominal and the adult plant CoI scores being 1.87 and 5.139, respectively. This would indicate the power of the Kruskal–Wallis analysis, particularly when dealing with a small population size.
A number of seedling expressed yellow rust resistance genes have been assigned to chromosome 1B, including Yr10, Yr15, Yr21, Yr24 and Yr26 (Wellings et al. 2012; Waqar et al.2018). The adult plant resistance Yr29 has been mapped to the telomeric end of 1BL (Williams et al.2003; Rosewarne et al. 2006), while QTL for yellow rust adult plant resistance have been located on 1B in cultivars express (Lin and Chen 2009), Brigadier (Jagger et al. 2011) and Camp Remy (Mallard et al. 2005).
Table 4. Blastx search of cloned NBS loci DNA sequences.
NBS Marker Length of query search (bp) Homology
to Species E value Pos. (%)
GenBank accession no. NBS2-290/
NBS3-290
289 NBS-LRR type disease resistance protein NBS-LRR disease resistance protein homologue NBS-LRR type resistance protein
RPR1 Zea mays Hordeum vulgare Saccharum arundinaceum Oryza sativa 7e-10 3e-09 1e-07 2e-06 62% 76% 67% 65% NP_001105809.1 CAD45034.1 ACD70325.1 NP_001067557.1 Hv1LRR Hordeum vulgare 1e-05 57% BAD73414.1
LRR14 Triticum aestivum 4e-03 47% AAK20742.1 NBS2-350 339 NBS-LRR disease resistance protein homologue
Hypothetical protein SORBIDRAFT_02g001150 Pi2
Disease resistance protein RPM1, putative
Hordeum vulgare Sorghum bicolor Oryza sativa Ricinus communis 3e-38 2e-31 8e-29 2e-10 79% 68% 62% 46% CAD45030.1 XP_002459239.1 ABC94598.1 XP_002532244.1 Pos (%), percentage of similar amino acids between query and target sequences.
NBS-profiling (van der Linden et al.2004) has been used in a number of studies, including genetic mapping in apple and lettuce (Calenge et al. 2005; Syed et al. 2006), and genetic diversity studies in hexaploid (Sayar-Turet et al.
2011) and durum wheat (Mantovani et al. 2006). The number of polymorphic loci identified between the durum wheat varieties Kunduru-1149 and Cham-1 was relatively low compared with other studies. In apple, 52 polymorphic NBS-bands were identified using three NBS primer-restric-tion enzyme combinaprimer-restric-tions (Calenge et al.2005). This gave a polymorphism level of 14.8% (52/350), somewhat higher than the 3.8% (14/368) obtained in this study. Four NBS primers, with two restriction enzymes generated 78 poly-morphic NBS marker loci in a collection of hexaploid wheat genotypes (78/880) giving a level of polymorphism detec-tion of 8.86% (Sayar-Turet et al. 2011). The low level of polymorphism found between wheat varieties Kunduru-1149 and Cham-1 may reflect a closer genetic relationship between these two durum wheat varieties.
Of the 14 polymorphic NBS-bands identified between Kunduru-1149 and Cham-1 four associated, to some degree, with yellow rust resistance. In addition to NBS3-290, which mapped to linkage group 2 (1B), four NBS marker loci formed a single linkage group (linkage group 1), indicating a region of the genome rich in NBS sequences. In apple, 58% of NBS marker loci mapped close to known genes for resistance to scab and mildew (Calenge et al.2005). While in the wild potato species Solanum demissum NBS-profiling identified three NBS fragments linked to candidate R-genes for late blight resistance (Zhang et al. 2014). Therefore, it may prove valuable to test the Kunduru-1149 x Cham-1 population for resistance to other pathogens and pests to determine whether the regions containing NBS loci associate with resistance to other diseases.
The three NBS bands cloned in this study all showed high homology to functionally characterized R-genes and RGAs, and in particular R-genes and RGAs from cereal species. NBS marker loci generated by NBS-profiling in potato, tomato, barley and lettuce showed similarity to known R-genes and RGAs in 50–90% of cases, depending on the NBS primer and restriction enzyme used (van der Linden et al. 2004). Therefore, well in excess of 50% of the NBS marker loci generated by NBS-profiling should locate to regions of the genome containing potential R-genes.
The large genome size of many crop species, in particular wheat, often makes full scale, genome wide mapping projects prohibitive in terms of time, resources and costs. In this study, using relatively few markers and a small population, signifi-cant QTL for yellow rust resistance have been identified. Some 29% of the NBS marker loci identified as polymorphic between the durum wheat varieties Kunduru-1149 and Cham-1 showed a significant association with seedling and/or adult plant, field resistance for yellow rust. These results, along with those reported in apple, (Calenge et al. 2005), indicate that NBS-profiling can provide a valuable marker tool for the identification of R-genes in crop species.
Acknowledgements
The authors are grateful to Dr. M. Nachit of ICARDA, Syria for creating the Kunduru-1149 x Cham-1 cross and to the Central Research Institute, Ankara, Turkey for providing the study material. This study was supported by Bogazici University Research Fund (04HB101); TUBITAK – The Scientific and Technical Council of Turkey, project number: TBAG-2357-103T178 and an EMBO Fellow Grant: ASTF109-2004. We would also like to thank the British Society of Plant Pathology for awarding Ms. Hale Tufan a M.Sc. bursary that enabled her to carry out part of her M.Sc. research work in the group of Dr. Lesley A. Boyd at the John Innes Centre. The Genbank accession numbers for NBS2-290, NBS3-290 and NBS2-350 are DQ978777, DQ978778 and DQ978779, respectively.
References
Altschul S. F., Madden T. L., Schaffer A. A., Zhang J., Zhang Z., Miller W. et al. 1997 Gapped BLAST and PSI-BLAST: a new generation of protein database search programs. Nucleic Acids Res. 25, 3389–3402.
Ayliffe M. A. and Lagudah E. S. 2004 Molecular genetics of disease resistance in cereals. Ann. Bot. 94, 765–773.
Bonfield J. K., Smith K. F. and Staden R. 1995 A new DNA sequence assembly program. Nucleic Acids Res. 23, 4992–4999. Boyd L. A. and Minchin P. N. 2001 Wheat mutants showing altered
adult plant disease resistance. Euphytica 122, 361–368. Boyd L. A., Smith P. H., Wilson A. H. and Minchin P. N. 2002
Mutations in wheat showing altered resistance to yellow and brown rust. Genome 45, 1035–1040.
Calenge F., van der Linden C. G., van de Weg E., Schouten H. J., van Arkel G., Denance C. et al. 2005 Resistance gene analogues identified through the NBS-profiling method map close to major genes and QTL for disease resistance in apple. Theor. Appl. Genet. 110, 660–668.
C¸ etin L., Du¨s¸u¨nceli F. and Albustan S. 2000 Wheat stripe rust virulences and reactions of registered varieties in field nurseries in Ankara/Turkey in the period 1991 – 1999. In Wheat in a Global Environment, 6th International Wheat Conference Abstracts, 5-9 June 2000 (ed. Z. Bedo), pp. 164. Budapest, Hungary.
Charles M., Belcram H., Just J., Huneau C., Viollet A., Couloux A. et al. 2008 Dynamics and differential proliferation of transpos-able elements during the evolution of the B and A genomes of wheat. Genetics 180, 1071–1086.
Chen X. M. 2005 Epidemiology and control of stripe rust Puccinia striiformis f. sp. tritici on wheat. Can. J. Plant Pathol. 27, 314–337.
Dilbirligi M. and Gill K. S. 2003 Identification and analysis of expressed resistance gene sequences in wheat. Plant Mol. Biol. 53, 771–787.
Dilbirligi M., Erayman M., Sandhu D., Sidhu D. and Gill K. S. 2004 Identification of wheat chromosomal regions containing expressed resistance genes. Genetics 166, 461–481.
Edwards K. J., Barker J. H. A., Daly A., Jones C. and Karp A. 1996 Microsatellite libraries enriched for several microsatellite sequences in plants. Biotechniques 20, 758–760.
Ellen D., Tarr K. and Alexander H. M. 2009 TIR-NBS-LRR genes are rare in monocots: evidence from diverse monocot orders. BMC Res. Notes 2, 197.
Ellis J., Dodds P. and Pryor T. 2000 Structure, function and evolution of plant disease resistance genes. Curr. Opin. Plant Biol. 3, 278–284.
Elouafi I., Nachit M. M. and Martin L. M. 2001 Identification of a microsatellite on chromosome 7B showing a strong linkage with
yellow pigment in durum wheat (Triticum turgidum L. var. durum). Hereditas 135, 255–261.
Feuillet C. and Keller B. 1999 High gene density is conserved as syntenic loci of small and large grass genomes. Proc. Natl. Acad. Sci. USA 96, 8265–8270.
Feuillet C., Penger A., Gellner K., Mast A. and Keller B. 2001 Molecular evolution of receptor-like kinase genes in hexaploid wheat. Independent evolution of orthologs after polyploidization and mechanism of local rearrangements at paralogous loci. Plant Physiol. 125, 1304–1313.
Feuillet C. and Eversole K. 2007 Physical mapping of the wheat genome: a coordinated effort to lay the foundation for genome sequencing and develop tools for breeders. Israel J. Plant Sci. 55, 307–313.
Gilbert N. 2010 Virulent wheat fungus invades South Africa. Naturehttps://doi.org/10.1038/news.2010.265.
Gill B. S., Appels R., Botha-Oberholster A. M., Buell C. R., Bennetzen J. L., Chalhoub B. et al. 2004 A workshop report on wheat genome sequencing. Genetics 168, 1087–1096.
Go¨c¸men B. 2001 Genetic characterization of 150 F6inbred durum
wheat lines derived from Kunduru-1149 x Cham-1 cross using molecular markers and economically important traits. Ph.D thesis, Middle East Technical University, Ankara, Turkey. Go¨c¸men B., Albustan S., Kaya Z., Keskin S. and Taskin V. 2003
Response of 150 F6 inbred durum wheat lines derived from
Kunduru-1149 x Cham-1 cross to yellow rust (Puccinia striiformis). Crop Prot. 22, 787–793.
Hammond-Kosack K. E. and Jones J. D. G. 1997 Plant disease resistance genes. Ann. Rev. Plant Physiol. Plant Mol. Biol. 48, 575–608.
Hayashi K. 1991 PCR-SSCP: a simple and sensitive method for detection of mutations in the genomic DNA. PCR Methods Appl. l1, 34–38.
International Wheat Genome Sequencing Consortium et al. 2018 Shifting the limits in wheat research and breeding using a fully annotated reference genome. Science 17, 361.
Jagger L. J., Newell C., Berry S. T., MacCormack R. and Boyd L. A. 2011 The genetic characterisation of stripe rust resistance in the German wheat cultivar Alcedo. Theor. Appl. Genet. 122, 723–733.
Lin F. and Chen X. M. 2009 Quantitative trait loci for non-race-specific, high-temperature adult-plant resistance to stripe rust in wheat cultivar Express. Theor. Appl. Genet. 118, 631–642. Liu J. J. and Ekramoddoullah A. K. M. 2007 The CC-NBS-LRR
Subfamily in Pinus monticola: targeted identification, gene expression, and genetic linkage with resistance to Cronartium ribicola. Phytopathology 97, 728–736.
Mallard S., Gaudet D., Aldeia A., Abelard C., Besnard A. L., Sourdille P. et al. 2005 Genetic analysis of durable resistance to yellow rust in bread wheat. Theor. Appl. Genet. 110, 1401–1409. Maccaferri M., Harris N. S., Twardziok S. O., Gundlach H., Spannagl M., Ormanbekova D. et al. 2019 Durum wheat genome highlights past domestication signatures and future improvement targets. Nat. Genet. 51, 885–895.
Mantovani P., van der Linden G., Maccaferri M., Sanguineti M. C., Tuberosa R. 2006 Nucleotide-binding site (NBS) profiling of genetic diversity in durum wheat. Genome 49, 1473–1480. Marris E. 2009 Wheat fungus threatens global crops. Naturehttps://
doi.org/10.1038/news.2009.168News.
Meyers B. C., Dickerman A. W, Michelmore R. W., Sivaramakr-ishnan S., Sobral B. W. and Young N. D. 1999 Plant disease resistance genes encode members of an ancient and diverse protein family within the nucleotide-binding superfamily. Plant J. 20, 317–332.
Miller R. N. G., Bertioli D. J., Baurens F. C., Santos C. M. R., Alves P. C., Martins N. F. et al. 2008 Analysis of non-TIR NBS-LRR resistance gene analogs in Musa accuminata colla:
isolation, RFLP marker development, and physical mapping. BMC Plant Biol. 8, 15.
Mun J. H., Yu H. J., Park S. and Park B. S. 2009 Genome-wide identification of NBS-encoding resistance genes in Brassica rapa. Mol. Genet. Genomics 282, 617–631.
Nachit M. M., Elouafi I., Pagnotta M.A., Elsaleh A., Lacono E., Labhilili M. et al. 2001 Molecular linkage map for an intraspecific recombinant inbred population of durum wheat (Triticum turgidum L. var. durum). Theor. Appl. Genet. 102, 177–186.
Van Ooijen J. W., Kyazma B. V. and Wageningen 2004 MapQTLÒ5, software for the mapping of quantitative trait loci in experimental pepulations (https://www.kyazma.nl/index.php/
MapQTL/).
Ro¨der M. S., Korzun V., Wendehake K., Plaschke J., Tixier M. H., Leroy P. et al. 1998 A microsatellite map of wheat. Genetics 149, 2007–2023.
Rodrigues P., Garrood J. M., Shen Q. H., Smith P. H. and Boyd L. A. 2004 The genetics of non-host disease resistance in wheat to barley yellow rust. Theor. Appl. Genet. 109, 425–432.
Rosewarne G. M., Singh R. P., Huerta-Espino J., William H. M., Bouchet S., Cloutier S. et al. 2006 Leaf tip necrosis, molecular markers and ß1-proteasome subunits associated with the slow rusting resistance genes Lr46/Yr29. Theor. Appl. Genet. 112, 500–508.
Sakamoto K., Tada Y., Yokozeki Y., Akagi H., Hayashi N., Fujimura T. et al. 1999 Chemical induction of disease resistance in rice is correlated with the expression of a gene encoding a nucleotide binding site and leucine-rich repeats. Plant Mol. Biol. 40, 847–855.
Sayar-Turet M., Dreisigacker S., Braun H. J., Hede A., MacCor-mack R. and Boyd L. A. 2011 Genetic variation within and between winter wheat genotypes from Turkey, Kazakhstan and Europe as determined by NBS-profiling. Genome 54, 419–430. Smith P. H., Koebner R. M. D. and Boyd L. A. 2002 The development of a STS marker linked to yellow rust resistance derived from the wheat cultivar Moro. Theor. Appl. Genet. 104, 1278–1282.
Somers D. J., Isaac P. and Edwards K. 2004 A high-density microsatellite consensus map for bread wheat (Triticum aestivum L.). Theor. Appl. Genet. 109, 1105–1114.
Song Q. J., Fickus E. W. and Cregan P. B. 2002 Characterization of trinucleotide SSR motifs in wheat. Theor. Appl. Genet. 104, 286–293.
Stam P. and Ooijen J. W. 1995 Joinmap version 2.0: software for the calculation of genetic linkage maps. CPRO-DLO, Wageningen.
Syed N. H., Sørensen A. P., Antonise R., van der Wiel C., van der Linden C. G., van der Westende W. et al. 2006 A detailed linkage map of lettuce based on SSAP, AFLP and NBS markers. Theor. Appl. Genet. 112, 517–527.
Tufan H. 2006 Characterization of yellow rust (Puccinia stri-iformis) resistance in an F6durum wheat population. M.Sc thesis,
Bog˘azic¸i University, Istanbul, Turkey.
Vales M. I., Scho¨n C. C., Capettini F., Chen X. M., Corey A. E., Mather D. E. et.al. 2005 Effect of population size on the estimation of QTL: a test using resistance in barley stripe rust. Theor. Appl. Genet. 111, 1260–1270.
van der Linden C. G., Wouters D. C. A. E., Mihalka V., Kochieva E. Z., Smulders M. J. M. and Vosman B. 2004 Efficient targeting of plant disease resistance loci using NBS profiling. Theor. Appl. Genet. 109, 384–393.
Waqar A., Khattak S. H., Begum S., Rehman T., Rabia A., Shehzad W. et al. 2018 Stripe rust: a review of the disease, Yr genes and its molecular markers. Sarhad J. Agric. 34, 188–201.
Wellings C. R., Boyd L. A. and Chen X. M. 2012 Resistance to stripe rust in wheat: pathogen biology driving resistance
breeding. In Disease resistance in wheat (ed. I. Sharma). CABI Publications, Wallingford.
Williams M., Singh R. P., Huerta-Espino J., Islas S. O. and Hoisington D. 2003 Molecular marker mapping of leaf rust resistance Lr46 and its association with stripe rust resistance gene Yr29 in wheat. Phytopathology 93, 153–159.
Zhang J., Yuan Y., Niu C., Hinchliffe D. J., Lu Y., Yu S. et al. 2007 AFLP-RGA markers in comparison with RGA and AFLP in cultivated tetraploid cotton. Crop Sci. 47, 180–187.
Zhang K., Xu J. F., Duan S. G., Pang W. F., Bian C. S., Liu J. et al. 2014 NBS profiling identifies potential novel locus from
Solanum demissum that confers broad-spectrum resistance to Phytophthora infestans. J. Integra. Agric. 13, 1662–1671. Zhou B., Qu S., Liu G., Dolan M., Sakai H., Lu G. et al. 2006 The
eight amino-acid differences within three leucine-rich repeats between Pi2 and Piz-t resistance proteins determine the resis-tance specificity to Magnaporthe grisea. Mol. Plant Microbe Interact. 19, 1216–1228.
Ziyaev Z. M., Sharma R. C., Nazari K., Morgounov A., Amanov A. A., Ziyadullaev Z. F. et al. 2011 Improving wheat stripe rust resistance in Central Asia and the Caucasus. Euphytica 179, 197–207.