A PARAMETRIC STUDY OF THE OPTIMUM SHEAR WALL AREA FOR MID-TO HIGH-RISE RC BUILDINGS
1Gökhan TUNÇ, 2Mustafa Khalid AL-AGEEDI
1 [email protected] , 2[email protected]
1,2Atilim University, Engineering Faculty, Civil Engineering Department, Ankara, TURKEY
(Geliş/Received: 30.12.2019; Kabul/Accepted in Revised Form: 30.03.2020)
ABSTRACT: In this article, a structural analysis was conducted on a total of 40 building models with varying building height and wall dimensions in order to determine the optimum ratio of shear wall area to floor area in a reinforced concrete building. For this purpose, 20, 30 and 40 story buildings were selected to investigate the effect of varying building heights on their structural behaviors. A parametric study on shear wall areas was conducted base on varying shear wall area to floor area ratios. Building models, therefore, included no wall and walls with 0.5%, 1%, 1.5% and 2.0% area ratios applied in combined x and y directions. Each of these models was subjected to response spectrum analysis using the forces generated according to the 2018 dated Turkish Earthquake Code (TEC 18) and 2016 dated American Building Code (ASCE 7-16). The buildings were assumed to be all office buildings located in a severe seismic zone region, Avcilar, Istanbul. The 30 and 40 story buildings due to their total heights had to be considered tall in line with the requirements in TEC 18. The additional requirements were also included in the analysis to understand the impact of tall buildings on the optimum shear wall determination. Therefore, the following parameters were investigated for the optimum shear wall area to floor area ratio: (a) building periods, (b) base shear and shear forces resisted by all shear walls, and (c) maximum lateral displacements and story drifts. The impact of effective wall layout configuration on structural behavior was also investigated by studying the 2.0% wall area ratio. The results indicated that the most effective ratios of shear wall area to floor area for the 20 and 30 story buildings were equal to 1.5% and 2.0%, respectively. However, the need for the wall area of the 40 story building was slightly more than 2.0%. However, as the wall layout was revised for the building with the 2.0% wall area ratio, the requirement for the wall area was nearly met indicating that the 2.0% wall area ratio could also be recommended for the 40 story building.
Key Words: Shear Wall Ratio, Reinforced Concrete Buildings, Earthquake Engineering, Seismic Codes
Orta Yüksek ve Yüksek Betonarme Binalarda Optimum Perde Duvar Alanının Belirlenmesi Üzerine Parametrik Çalışma
ÖZ: Bu makalede, betonarme binalarda en uygun perde duvar alanının kat planı alanına olan oranını belirlemek için farklı bina ve duvar ölçülerine sahip toplam 40 bina üzerinde yapısal analizler gerçekleştirilmiştir. Farklı bina yüksekliklerinin yapısal davranışlarına etkisini anlamak için sırası ile 20, 30 ve 40 katlı üç tür bina seçilmiştir. Farklı perde duvar alanlarının kat planı alanına olan oranları değiştirilerek perde duvarlar üzerinde parametrik bir çalışma yapılmıştır. Bu amaç doğrultusunda, bina modelleri perde duvar içeren ve içermeyen binalar olmak üzere hazırlanmıştır. Perde duvar içeren modellerde x ve y yönlerinin toplamında sırası ile % 0.5, % 1, % 1.5 ve % 2.0 oranlarına sahip perde duvar kullanımı sağlanmıştır. Bu modellerin her biri, Türkiye Bina Deprem Yönetmeliği 2018 (TBDY 18) ve Amerikan Bina Yönetmeliği 2016 (ASCE 7-16) yönetmeliklerine göre belirlenen deprem kuvvetleri kullanılarak mod birleştirme yöntemine uygun olarak deprem analizlerine tabi tutulmuştur. Toplam yapı yüksekliği nedeniyle 30 ve 40 katlı olan binalar, TBDY 18'deki koşullara göre yüksek bina olarak
tasarlanmış ve analizleri yapılmıştır. Böylelikle, yüksek binaların optimum perde duvar alanı oranına olan etkisi anlaşılmaya çalışılmıştır. Bu kapsam dahilinde optimum perde duvar alanının toplam kat alanına oranı belirlenirken şu parametreler detaylı olarak incelenmiştir: (a) bina periyotları, (b) taban kesme kuvveti ve perde duvarların karşı koyduğu kesme kuvveti miktarı ve (c) maksimum yatay deplasmanlar ile göreli kat öteleme miktarları. Ayrıca, etkili perde duvar kullanımının yapısal analizler üzerindeki etkisini araştırmak amacı ile % 2.0 perde oranına sahip bina örnek olarak ele alınmıştır. Sonuçlara göre en uygun perde duvar alanı, 20 ve 30 katlı binalarda sırası ile yaklaşık olarak % 1.5 ve % 2.0 olarak değerlendirilmiştir. Fakat 40 katlı binada ihtiyaç duyulan perde duvar alanı % 2.0’den biraz fazla olarak ortaya çıkmıştır. Bununla birlikte, % 2.0 oranına sahip farklı bir perde duvar yerleşimi ile hedeflenen yük taşıma oranına ulaşılacağı belirlenmiştir.
Anahtar Kelimeler:Perde Duvar Alan Oranı, Betonarme Binalar, Deprem Mühendisliği, Deprem Yönetmelikleri 1. INTRODUCTION
Shear walls are structural elements that resist gravity and lateral loads acting on buildings. Their main goal is to provide lateral stiffness to buildings. Therefore, they resist most of the seismic forces resulting from an earthquake. Due to their benefits to structural design, shear walls have been increasingly used in buildings. However, their locations are important and need careful evaluation. In a floor layout, if possible, they should be located as close as possible to the center of mass in order to prevent any additional moments that might result otherwise. Therefore, it is important to use the adequate number of shear walls with the adequate cross-sectional area. This article, which is mainly extracted from an MS thesis conducted at Atilim University, Ankara, will investigate the optimum shear wall area for mid to high rise RC buildings (Al-Ageedi, 2019).
The aim of this article is (a) to investigate the effect of varying shear wall area to floor area ratio in a reinforced concrete building, and (b) to determine the optimum ratio of shear wall area. This study was conducted on 40 different reinforced concrete (RC) building models. A commercial software package, ETABS, was used to analyze the buildings based on the response spectrum method. In the previous building codes, shear walls were used in large proportions, since the codes did not have any requirements regarding the minimum area of shear wall usage except for the tunnel formwork type buildings that have been commonly used in Turkey. There have been numerous researches conducted in this area to find the optimum wall area so that earthquake damages would be at a tolerable level and non-life threating.
2. LITERATURE REVIEW
In the past, many types of research have carried out studies based on the shear wall ratio and its impact on buildings earthquake performance. In 1993, the optimum height of a shear wall that would perform effectively during an earthquake was studied by ignoring the shear walls for the upper floors that were used to reduce the deflection at the top. Based on the analyses results, it was concluded that if the wall was shortened at the level of contra-flexure, the change in the building’s top deflection was negligible (Nollet and Smith, 1993). In 1995, the performance of different types of shear walls were studied based on the following earthquakes from 1960 to 1988; Chile (May 1960), Macedonia (July 1963), Venezuela (July 1967), California (February 1971), Nicaragua (December 1972), Romania (March 1977), Mexico City (September 1985), Chile (1985) and Armenia (December 1988). The objective of this study was to examine the structural behaviors of shear walls with respect to the descriptions stated in the earthquake codes, which were in action at the time. It was concluded that using the appropriate wall to floor area ratios would improve the structural performance of shear walls (Fintel, 1995). In 2008, the design of a 56 story tower with shear walls containing irregular openings that resisted both gravity and lateral loads was conducted. The building had three primary walls and multiple secondary walls that were perpendicular to the primary ones. The primary walls had overlapped openings while the
secondary ones were linked to the primary ones through coupling beams. Some of the secondary walls contained continuous columns while the others did not. In this study, the trial and error approach was used to design the tower since there was no straight forward design procedure. It was concluded that the use of shear walls would increase the ductility level and the overall stability of a building(Esmaili, et al., 2008). In 2009, the impact of shear wall ratio on a building’s seismic response was examined and the results were compared to those from the approximate methods. For this purpose, a total of 45 building models with 2, 5 and 8 floors were constructed. The building models were analyzed with various ratios of shear walls, where the ratio of shear wall area to floor area varied from 0.52% to 3.60%. The elastic and inelastic change in story drifts based on these varying shear wall ratios were also studied. According to this study, it was found out that the change in the story drift was almost negligible when the shear wall ratio was larger than two. Therefore, it was concluded that the total height of the building had a significant impact on the roof drift while the building type had an impact on the story drift (Soydas, 2009).
The optimum shear wall area was continued to be studied further in the past 10 years as well. In 2011, the effect of shear walls with various heights on a building’s seismic response during an earthquake was investigated. For this purpose, three types of buildings with varying heights: low, medium, and high-rise were analyzed. The study concluded that the story shear was higher in a building with shear wall and exterior frames. In addition to that, the story shear was greater for the mid-rise height building while it reduced in a high-mid-rise building. It was concluded that the shear walls up to 65% of the building height were adequate to resist the lateral forces effectively (Malik et al., 2011). In 2013, the performance of the impact ratio between the shear wall area to the floor area was examined. For this purpose, 29 buildings with different number of floors, heights, and material properties were used. The shear wall ratio in this study varied from 0% to 2.5%. It was concluded that as the ratio of shear wall increased, plastic deformations and roof drifts decreased. The building with a 1% wall area ratio resulted in the lower drift when compared to the ones with 0% or 0.5%. After the 1.5% wall ratio, the effect of the ratio diminished since any ratio beyond 1.5% did not have any major impact on the drifts under lateral loads (Gunel, 2013). Again in 2013, the impact of varying shear wall ratios on the seismic response of buildings was studied using a nonlinear time history method. For this purpose, a total of 24 mid-rise reinforced concrete building models with two different number of floors, 5 and 8 floors, having shear wall ratios varying from 0.51% to 2.71% in both directions were constructed. The study concluded that a minimum shear wall ratio of 1.0% was recommended for mid-rise RC buildings to control the drift, and that the seismic response of RC buildings with more than 1.5% of wall ratio would not significantly improve (Burak and Comlekoglu, 2013).
Three more studies that were completed in 2016 were used as references to this article. In 2016, the most effective shear wall location was studied based on their linear structural behavior in a 10 story reinforced concrete building. In this analysis, two different shear wall locations were used; one located in the corner and one in the center with regular and irregular geometry. A frame structure with no shear walls was used as a reference building. Based on the analyses results it was concluded that the buildings with corner shear walls reduced the steel reinforcement and generated less shear forces compared to those without shear walls (Gupta et al., 2016). In 2016, 7 story buildings were studied with three different types of framing systems; wall equivalent dual system, coupled shear wall system and a system with no shear wall. Based on the analyses results it was found out that the coupled shear wall system compared to the wall equivalent dual system generated more story displacements, story shear and moment forces due to the rigidness of the shear walls (Foroughi and Yüksel, 2016). In the last article of 2016, an analytical study was performed on a total of 24 midrise RC buildings with five and eight stories to evaluate the effect of shear wall area to floor area ratio. For this purpose, the shear wall ratios in these buildings varied from 0.51% and 2.17% in both directions. The structural behavior of these building models (roof, interstory drifts, and base shear forces) were examined under earthquake loads by conducting nonlinear time history analyses. According to the analytical results, a minimum of 1.0% shear wall ratio was recommended for midrise buildings to control their drifts. Furthermore, it was also
concluded that if the shear wall ratio increased to a value more than 1.5%, the seismic performance of the buildings did not show any significant improvements (Mohammad and Bharathi, 2016).
In 2017, a tubular lateral resisting system containing shear walls was examined for multistory RC buildings to determine the influence of shear wall area to floor area ratio on their seismic behaviors. A total of three 30-story buildings with different wall configurations (8%, 41%, and 65% shear wall areas) were analyzed under earthquake loads generated according to the Indian Seismic Code of IS 1893:2002 by conducting Static and Response Spectrum Analyses. Based on their analyses, they examined the base shear forces, total seismic weights, and story drifts. The study concluded that as the shear wall area to floor area increased, base shear forces increased while the displacements and story drifts decreased (Sreevalli and Priya, 2017). Finally, in 2018, the effect of shear wall area to floor area ratio of a 15 story RC building was investigated by conducting nonlinear time history analysis. The building was assumed to have the following wall ratios: 0.0% (no shear wall), 4.8%, 9.6%, 14.4%, and 19.2%. Also in this study, three different wall thicknesses were examined: 180 mm, 230 mm, and 280 mm. According to the results, the building model with the 9.6% shear wall ratio exhibited lower story drifts and displacements then the models with the 0.0% and 4.8% shear wall ratios. The drifts and displacements were minimized when the shear wall to floor area ratio increased to 14.4%. It was concluded that the wall ratio beyond 14.4% had shown a slight improvement on the seismic performance of the building (Kumar and Kumar, 2018).
3. BUILDING MODELS
A total of 40 building models with 20, 30 and 40 stories were constructed in a commercially available software package, ETABS (ETABS, 2018). Out of 40 models, eight of them did not have any shear walls while the remaining 32 models had shear walls with varying locations and quantities. All buildings were assumed to be office type buildings located in Avcilar, Istanbul. The purpose of this study was to determine the optimum ratio of shear wall area to floor area. This ratio was calculated by dividing the wall areas located at each floor to the associated floor areas. For this purpose, a total of five shear wall area ratios were considered: (a) no wall (the ratio was zero, 0%), (b) 0.5%, (c) 1%, (d) 1.5%, and (e) 2.0%. In this study, 1%, 1.5%, and 2.0% ratios were not exactly achieved due to the dimensions of the proposed layouts. The exact values of these three ratios were calculated as 1.04%, 1.44%, and 1.9%. The total heights of the 20, 30 and 40 story buildings were 64 meters, 96 meters, and 128 meters, respectively, each with the 3.2-meter floor-to-floor height dimension. The floor plans of all buildings were assumed to be square with a 40-meter dimension in both x and y directions. The earthquake forces were calculated according to Turkish Earthquake Code (TEC 18, 2018) and its counterpart in the US, the American Building Code, ASCE 7-16 (ASCE 7-16, 2016). The response spectrum method was used for all the buildings.
4. FLOOR TYPES
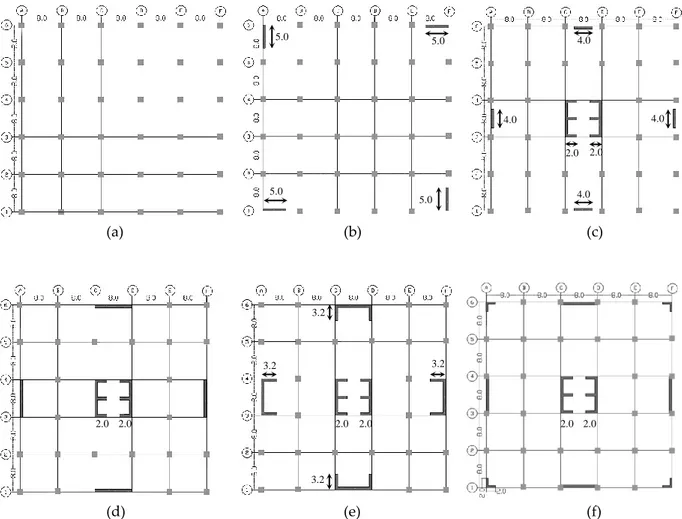
Two types of building layouts were selected. Type I was used to define buildings without shear wall and Type II was used to define buildings with shear walls. In determining the wall, column, beam and slab sizes, a conservative approach was used to prevent member failures during the response spectrum analysis stage (Figure 1).
(a) (b) (c)
(d) (e) (f)
Figure 1. Floor layouts with shear wall areas of (a) 0%, (b) 0.5%, (c) 1.0%, (d)1.5%, (e) 2.0% (Option 1), (f) 2.0% (Option 2) – all dimensions are in meters
Type I – 20, 30 and 40 story buildings
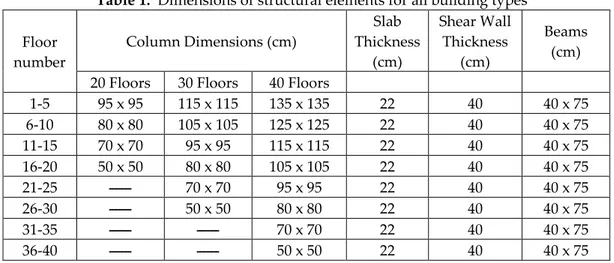
This type of building model contains only columns, beams and slab (no shear walls). As shown in Figure 1a, each span in the x and y direction was 8 meters long, and all the columns were connected through beams. The column sizes were changed every five floors while the slab and beam dimensions were kept unchanged. Table 1 lists the dimensions of all structural elements.
Type II – 20, 30 and 40 story buildings
Building in this type contains shear walls, columns, beams and slabs. Similar to the buildings in Type I, 20, 30 and 40 story buildings were modeled with the same floor to floor height of 3.2 meters. The total height of the 20, 30 and 40 story buildings were 64, 96 and 128 meters, respectively. As described before, four types of shear wall area ratios were used, 0.5%, 1.0%, 1.5% and 2.0% (see Figures 1b through f). All shear walls were assumed to have a constant thickness of 0.4 meter. The shear walls in the 0.5% model were located at the four corners of the building to effectively resist against the torsional forces. The length of each wall was constant at 5 meters. The shear walls in the 1.0% ratio (the exact number is 1.04%) were located both in the center and in the mid-spans around the perimeter of the building with varying lengths. The shear walls in the 1.5% model (the exact ratio is 1.44%) were again assumed to be located in the center and in the mid-spans around the perimeter of the buildings with longer lengths. Two options were decided to be studied for the shear walls in the 2.0% model (the exact figure is 1.9%). The walls of the 1.5% model were kept the same for option 1 except that the ones in the mid-spans
5.0 5.0 5.0 5.0 4.0 4.0 4.0 4.0 2.0 2.0 2.0 2.0 2.0 2.0 2.0 2.0 3.2 3.2 3.2 3.2
around the perimeter were converted to U shaped walls. In option 2, the walls were the same as those in the 1.5% except that the L shaped walls were used at the four corners instead of the U shaped walls.
Table 1. Dimensions of structural elements for all building types
4.1. Material Properties
Concrete class C40 was used for all structural members with a poison’s ratio of 0.2. As specified in the Turkish Standards, TS 500, the modulus of elasticity for C40 concrete is assumed to be 34,000 MPa (TS 500, 2000). In the self-weight calculation of structural members, the unit weight of reinforced concrete with rebars was selected to be 2,500 kg/m3.
4.2. Earthquake Loads
TEC 18 and ASCE 7-16 were used to calculate the gravity and lateral loads while the tall building guideline, Tall Buildings Initiative Guidelines for Performance Based Seismic Design of Tall Buildings, TBI 2017, was used for the tall buildings (TBI, 2017). TEC 18 classifies the buildings as tall and others. Depending on the seismic design category, a building is called tall if its total height exceeds 70, 91 or 105 meters. The buildings with 30 and 40 stories fall into tall building category, and therefore their analyses were conducted according to the rules of tall buildings. In order to compare the results of the tall buildings to those that were analyzed according to ASCE 7-16, the existing tall building guideline, TBI 2017 was used.
4.2.1. TEC 18
In this study, the local site class was assumed to be slightly weathered rocks. Therefore, a site class ZB with a shear velocity, VS, equal to 760 to 1500 m/s was selected for all buildings. Thus, a possible need for piles specifically for the 30 and 40 story buildings was eliminated. The importance factor for all buildings was equal to one since they were office types of buildings. The buildings’ occupancy class (BKS) was equal to three. A live load participation factor of 0.3 was used in the total seismic weight calculation.
In TEC 18, there are 3 design stages. The first one accounts for an earthquake with a return period of 475 years (DD2 type earthquake), the second one for an earthquake with a return period of 43 years (DD3), and the last one for tall buildings only (DD4). The short and 1 second periods for mapped spectral acceleration coefficients, SS and S1, were extracted from the following website: http://tdth.afad.gov.tr. The SS and S1 values for Avcilar, Istanbul are 1.21 and 0.33, respectively.
Floor number Column Dimensions (cm) Slab Thickness (cm) Shear Wall Thickness (cm) Beams (cm) 20 Floors 30 Floors 40 Floors
1-5 95 x 95 115 x 115 135 x 135 22 40 40 x 75 6-10 80 x 80 105 x 105 125 x 125 22 40 40 x 75 11-15 70 x 70 95 x 95 115 x 115 22 40 40 x 75 16-20 50 x 50 80 x 80 105 x 105 22 40 40 x 75 21-25 ـــــــ 70 x 70 95 x 95 22 40 40 x 75 26-30 ـــــــ 50 x 50 80 x 80 22 40 40 x 75 31-35 ـــــــ ـــــــ 70 x 70 22 40 40 x 75 36-40 ـــــــ ـــــــ 50 x 50 22 40 40 x 75
As stated in TEC 18, in design stage I (DD2 design stage), the concrete was assumed to be cracked. The cracked properties of the concrete for structural members are listed in Table 2. In this design stage, the values of the ductility ratio, R, and the overstrength coefficient, D, which both correspond to a high ductile lateral resisting system were obtained from TEC 18 as 7 and 2.5, respectively. For the buildings with no walls, the corresponding high ductile system values of R=8 and D=3 were used. The DD2 design stage was used for all buildings, i.e., the 20, 30 and 40 story buildings. The damping ratios of all buildings in this stage were 5% (TEC 18, 2018).
Table 2. Effective stiffness values in TEC 18 and TBI 2017 [14]
(1) cracked properties of concrete were used only for the 30 and 40 story buildings. For the 20 story building,
concrete was assumed uncracked.
(2) 0.07 (l/h)Ec Ig≤0.3EcIg
In design stage II, an earthquake with a return period of 43 years was applied to the buildings (DD4 type earthquake). Based on the earthquake map, the SS and S1 for DD4 were obtained as 0.278 and 0.072, respectively. In this design stage, as described in TEC 18, the values of both the R and the D were equal to one. Similar to the first design stage, the concrete, in this stage, was again assumed to be cracked but with different stiffness values (see Table 2). The DD4 stage was used only for tall buildings, i.e., the 30 and 40 story buildings. The damping ratios for the 30 and 40 story buildings were 2.5%.
The design stage III is required only for tall buildings. In this study, the response spectrum method was decided to be used for all buildings in order to compare the results of TEC 18 to ASCE 7-16. Therefore, the design stage III was not included in this study.
4.2.2. ASCE 7-16
The short and 1 second periods of mapped spectral acceleration coefficients, SS and S1, are extracted from the Turkish website based on an earthquake with a return period of 2475 years (DD1 type earthquake). The corresponding SS and S1 values for Avcilar, Istanbul are 2.118 and 0.589, respectively. ASCE 7-16 divides the risk category of a building into four groups. According to ASCE 7-16, the risk category for an office building falls into the second group (Group II). After determining the risk category, the seismic design category was calculated “D” based on the short and 1 second period response acceleration parameters. The site class B was selected for all buildings, which would exhibit similar soil properties to those in TEC 18. The values of the Response Modification Coefficient (or ductility, R), Overstrength Factor (Ω0, same as D in TEC 18) and the Deflection Amplification Factor (Cd) were determined as 7, 2.5 and 5.5, respectively. Similar to the definition in TEC 18, the values of R, D,
TEC 18 TBI 2017(1)
Structural Members DD2 DD4 DD1 (service)
Shear wall – slab (in plan) Axial Shear Axial Shear Axial Shear
Shear wall 0.50 0.50 0.75 1.00 1.00 0.40
Basement walls 0.80 0.50 1.00 1.00 1.00 0.40
Slabs 0.25 0.25 0.50 0.80 0.50 0.40
Shear wall- slab (out of plan) Flexural Shear Flexural Shear Flexural Shear
Shear wall 0.25 1.00 1.00 1.00 0.25 --
Basement walls 0.50 1.00 1.00 1.00 0.25 --
Slabs 0.25 1.00 0.50 1.00 0.50 --
Structural members Flexural Shear Flexural Shear Flexural Shear Coupling beams 0.15 1.00 0.30 1.00 see note (2) 0.40
Beams 0.35 1.00 0.70 1.00 0.50 0.40
and Cd for the buildings with no shear walls were different than the preceding ones. Therefore, for these buildings, 8, 3 and 5.5 were selected, respectively. The live load participation factor of zero was used in the seismic weight calculation according to the ASCE 7-16 since the building loads did not meet the requirements stated in the code. The concrete for the 20 story building was assumed uncracked while the concrete for the 30 and 40 story ones was assumed cracked (see Table 2, ASCE 7-16, 2016 and TBI, 2017). The damping ratios of the 20 story building were 5% while the ratios of the 30 and 40 story buildings were 2% (ASCE 7-16, 2016 and TBI, 2017).
4.2.3. TBI 2017
The American tall building seismic design guideline, TBI 2017, was used for only tall buildings, 30 and 40 story ones, to determine the effective stiffness values of the reinforced concrete members (see Table 2).
4.3. Finite Element Modeling in ETABS
A total of 40 building models were analyzed using the response spectrum method according to both Turkish and US building codes. The concrete was assumed cracked for the earthquakes in DD2 and
DD4 design categories as described in TEC 18. For the buildings analyzed according to ASCE 7-16, the
concrete in the 20 story building was assumed uncracked while the concrete for the tall buildings with 30 and 40 story ones was assumed cracked.
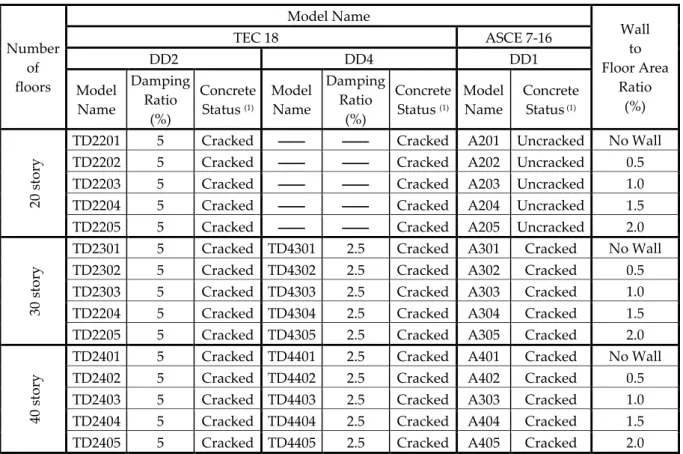
In addition to self-weight, 0.75 kN/m2 of snow load, 3.5 kN/m2 of uniformlydistributed live loads and 1.5 kN/m2 of superimposed dead loads were used. The live and snow loads were determined according to TS 498, the Turkish standard entitled Design Loads for Structures (TS 498, 1997). A four-digit label was used for the building models analyzed according to ASCE 7-16 code. In these labels, the first digit referred to the code, ASCE 7-16, the second and third ones referred to the number of floors, and finally, the fourth and the final digits referred to the ratio of shear wall area to floor area. A similar type of label was also used for the building models analyzed according to TEC 18. In these model names, unlike the 4 digit ones that were used for ASCE code, a six-digit label was used. The first digit in the model name referred to the code, TEC 18, the second and third ones referred to the earthquake design category, the fourth and fifth ones referred to the number of floors, and finally, the last digit was used to define the percentage of shear wall area to floor area ratio. In these labels, the last two digits were composed of integer numbers from 1 to 5 to define the shear wall area ratio to the floor area ratios. Therefore, the integer numbers 1 through 5 were used for buildings with 0% (no wall), 0.5%, 1.0%, 1.5%, and 2.0% shear wall area ratios. For example, a model name TD2202 was used for a 20 story building with a shear wall to floor area ratio of 0.5%, which was subjected to an earthquake in DD2 design category according to TEC 18. Table 3 lists the model names of all 40 buildings.
Table 3. Model names and model information
(1)cracked properties of concrete are different for the DD2 and DD4 design categories, see Table 2.
5. RESULTS
A total of forty building models were analyzed. The results are examined and discussed in the following order: (a) fundamental periods, (b) base shear and total wall shear forces, and (c) maximum lateral displacements and story drifts.
(a) fundamental periods
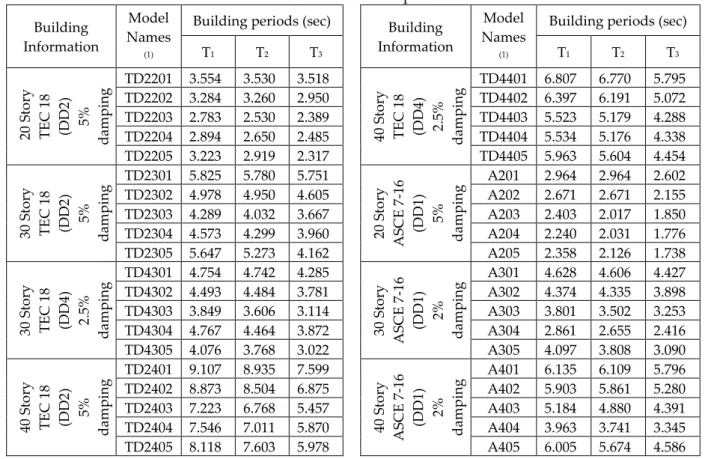
Table 4 lists the first three periods of all building models resulted in the x, y and rotational directions, z. The first periods were always in the “x” direction. However, for the second period, the mode shapes were almost always in the “y” direction except for the model TD2204, where the mode shape was in the “z” direction. For the third periods, the mode shapes were almost always in the “z” direction except for the model TD2204.
When the periods of 20 story building from TEC 18 were compared to those from ASCE 7-16, the periods from TEC 18 were as high as 20% to 40% more due to the heavier total seismic weight in TEC 18 and the varying cracked properties of structural members. As expected, for both the 30 and 40 story buildings, the building periods from DD2 were slightly larger than those from DD4 due to larger damping ratios and varying cracked properties (see Table 2). In the 30 story building, the periods from DD2 to DD4 were 10% more on the average while this increase was around 40% for the 40 story one since the tall building behavior became more prominent. The fundamental periods of DD2 from TEC 18 were compared to those from ASCE 7-16. Since the total seismic weights of buildings in TEC 18 were more than those in ASCE 7-16, the building periods in TEC 18 were always larger than their counterparts in ASCE 7-16. The fundamental periods of TEC 18 with 2.0% wall ratio for the 20, 30 and 40 story buildings were 30%, 60% and 90% more, respectively. The fundamental periods of the 20, 30 and 40 story buildings with 0.5%, 1.0%, 1.5% and 2.0% wall ratios, which were analyzed according to TEC 18
Number of floors Model Name Wall to Floor Area Ratio (%) TEC 18 ASCE 7-16 DD2 DD4 DD1 Model Name Damping Ratio (%) Concrete Status (1) Model Name Damping Ratio (%) Concrete Status (1) Model Name Concrete Status (1) 20 s tor y
TD2201 5 Cracked ـــــــــ ـــــــــ Cracked A201 Uncracked No Wall TD2202 5 Cracked ـــــــــ ـــــــــ Cracked A202 Uncracked 0.5 TD2203 5 Cracked ـــــــــ ـــــــــ Cracked A203 Uncracked 1.0 TD2204 5 Cracked ـــــــــ ـــــــــ Cracked A204 Uncracked 1.5 TD2205 5 Cracked ـــــــــ ـــــــــ Cracked A205 Uncracked 2.0
30
s
tor
y
TD2301 5 Cracked TD4301 2.5 Cracked A301 Cracked No Wall TD2302 5 Cracked TD4302 2.5 Cracked A302 Cracked 0.5 TD2303 5 Cracked TD4303 2.5 Cracked A303 Cracked 1.0 TD2204 5 Cracked TD4304 2.5 Cracked A304 Cracked 1.5 TD2205 5 Cracked TD4305 2.5 Cracked A305 Cracked 2.0
40
s
tor
y
TD2401 5 Cracked TD4401 2.5 Cracked A401 Cracked No Wall TD2402 5 Cracked TD4402 2.5 Cracked A402 Cracked 0.5 TD2403 5 Cracked TD4403 2.5 Cracked A303 Cracked 1.0 TD2404 5 Cracked TD4404 2.5 Cracked A404 Cracked 1.5 TD2405 5 Cracked TD4405 2.5 Cracked A405 Cracked 2.0
with a 5% damping ratio were also compared to each other. Based on this comparison, the increase in the fundamental period with respect to the one with the 0.5% wall ratio was 50% in the 30 story and 270% in the 40 story one. Similar comparisons were made for the 1.0%, 1.5% and 2.0% wall ratios. In the 1.0% one, 30% and 260%; in the 1.5% one, 60% and 260%; and finally in the 2.0% one, 75% and 145% increases were obtained. Based on the results, it is clear to say that the 40 story building exhibited a lot more pronounced period change as opposed to the 30 story one.
Table 4. Fundamental periods
(1)for the shear wall areas, see Figure 1 and Table 3.
(b) base shear and total wall shear forces
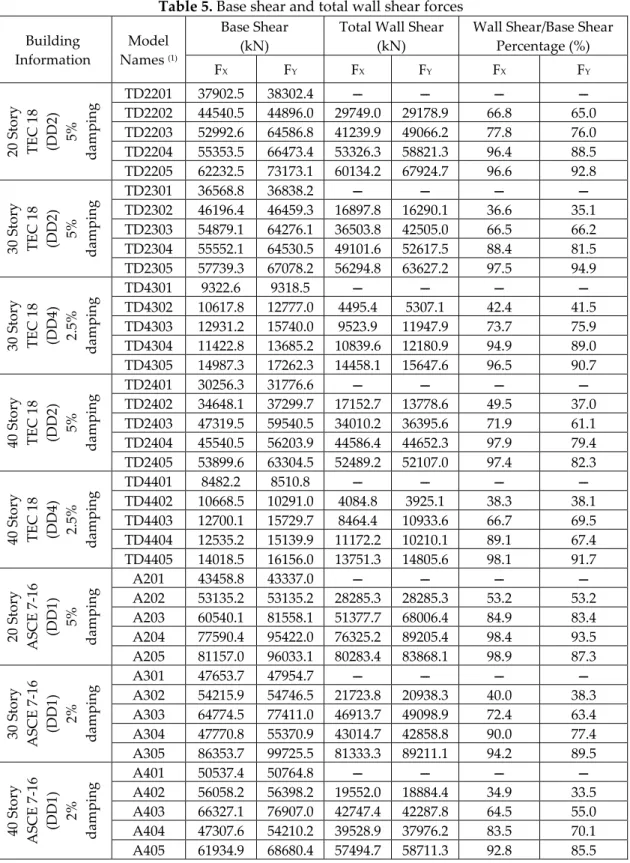
Table 5 lists the base shear and the shear forces resisted by the walls located in the x and y directions along with the ratios of shear forces in percentage resisted by these walls. The base shear forces of the 20 story building in TEC 18 were compared to those in ASCE 7-16. Based on the results, the forces in the x and y directions from TEC 18 were about 80% of their counterparts from ASCE 7-16 due to the less periods generated by ASCE 7-16 as a result of uncracked concrete properties. Similar to the base shear forces, total wall shear forces at the base were also compared in both directions. Based on the results, TEC 18, for almost all wall ratios, generated less shear forces than those from ASCE 7-16. As the ratios of wall area to the floor area increased from 1.0% to 2.0%, the total shear wall forces in TEC 18 compared to those in ASCE 7-16 decreased from 80% to 70%. The percentage of the base shear force resisted by the shear walls of the 20 story building in TEC 18 was around 65% in both x and y directions when the ratio of the shear wall area to floor area was 0.5%. This ratio increased to an average of 94% as the wall area ratio increased to 2.0%. In the ASCE 7-16, the same ratios were calculated 53% for the 0.5% wall ratio and 94% for the 2.0% ratio.
As expected, DD2 generated much larger base shear forces than DD4, which was used only in the 30 and 40 story buildings since they were considered tall. According to the results, the ratios for both
Building Information
Model Names
(1)
Building periods (sec) Building Information
Model Names
(1)
Building periods (sec)
T1 T2 T3 T1 T2 T3 2 0 S tor y T E C 18 (DD 2) 5% d am p ing TD2201 3.554 3.530 3.518 40 S tor y T E C 18 (DD 4) 2. 5% d am p ing TD4401 6.807 6.770 5.795 TD2202 3.284 3.260 2.950 TD4402 6.397 6.191 5.072 TD2203 2.783 2.530 2.389 TD4403 5.523 5.179 4.288 TD2204 2.894 2.650 2.485 TD4404 5.534 5.176 4.338 TD2205 3.223 2.919 2.317 TD4405 5.963 5.604 4.454 30 S tor y T E C 18 (DD 2) 5% d am p ing TD2301 5.825 5.780 5.751 20 S tor y A S C E 7 -16 (DD 1) 5% d am p ing A201 2.964 2.964 2.602 TD2302 4.978 4.950 4.605 A202 2.671 2.671 2.155 TD2303 4.289 4.032 3.667 A203 2.403 2.017 1.850 TD2304 4.573 4.299 3.960 A204 2.240 2.031 1.776 TD2305 5.647 5.273 4.162 A205 2.358 2.126 1.738 30 S tor y T E C 18 (DD 4) 2. 5% d am p ing TD4301 4.754 4.742 4.285 30 S tor y A S C E 7 -16 (DD 1) 2% d am p ing A301 4.628 4.606 4.427 TD4302 4.493 4.484 3.781 A302 4.374 4.335 3.898 TD4303 3.849 3.606 3.114 A303 3.801 3.502 3.253 TD4304 4.767 4.464 3.872 A304 2.861 2.655 2.416 TD4305 4.076 3.768 3.022 A305 4.097 3.808 3.090 40 S tor y T E C 18 (DD 2) 5% d am p ing TD2401 9.107 8.935 7.599 40 S tor y A S C E 7 -16 (DD 1) 2% d am p ing A401 6.135 6.109 5.796 TD2402 8.873 8.504 6.875 A402 5.903 5.861 5.280 TD2403 7.223 6.768 5.457 A403 5.184 4.880 4.391 TD2404 7.546 7.011 5.870 A404 3.963 3.741 3.345 TD2405 8.118 7.603 5.978 A405 6.005 5.674 4.586
base shear and shear walls varied from a minimum of 3.1 to a maximum of 4.9. As the shear wall area to floor area ratio increased from 0.5% to 2.0%, the shear forces resisted by the walls of the 30 and 40 story buildings resulting from both DD2 and DD4 increased from an average of 42% to 93%.
The base shear and total wall shear forces of the 30 and 40 story buildings calculated from the DD2 in TEC 18 were compared to their counterparts in ASCE 7-16 where DD1 was used. The base shear forces of the buildings with no walls extracted from TEC 18 were 80% of those from ASCE 7-16 in the 30 story building case, and 60% in the 40 story one. As the wall area ratios increased to 1.5%, the results from the two codes became almost equal to each other. However, when the wall area ratio was increased to 2.0%, the results of TEC 18 again decreased by an average of 30% in the 30 story building case, and 10% in the 40 story one due to less periods generated by ASCE, which led to higher base shear forces.
In order to determine the adequate ratio of shear wall area, the base shear component was used. For this purpose, as accepted in common practice, 90% ratio, which defines the percentage of the total shear force resisted by the walls, was set as a goal in each orthogonal direction that is under consideration [Burak and Comlekoglu, 2013]. Therefore, the critical value of 90%, which is used to describe the total shear wall to base shear force ratio was investigated both in the x and y directions. Based on the results of DD2 in TEC 18 with 5% damping, the 90% ratio in the x direction was achieved when the shear wall to floor area ratio was between 1.0% to 1.5% in the 20 story building case, 1.5% to 2.0% in the 30 story one, and around 1.5% in the 40 story one. However, there these ratios varied in the y direction due to the less wall areas compared to the x direction. The critical ratios associated in the y direction were achieved when the shear wall to floor area ratio was between 1.5% to 2.0% in the 20 and 30 story buildings. However, in the 40 story building case, even the 2.0% wall ratio was not adequate to reach the 90% target ratio indicating that more walls had to be used in that direction. The results of ASCE 7-16 were also studied both in the x and y directions. The results of ASCE 7-16 showed a slight variation as they were compared to those of TEC 18. The target ratio of 90% was achieved in the x direction when the shear wall to floor area ratio was between 1.0% to 1.5% in the 20 story building case, 1.5% in the 30 story one, and was 2.0% in the 40 story one. In the y direction, the required shear wall area to floor area ratio was between 1.5% to 2.0% in the 20 story case, 2.0% in the 30 story one, and was more than 2.0% in the 40 story one.
(c) maximum lateral displacements and story drifts
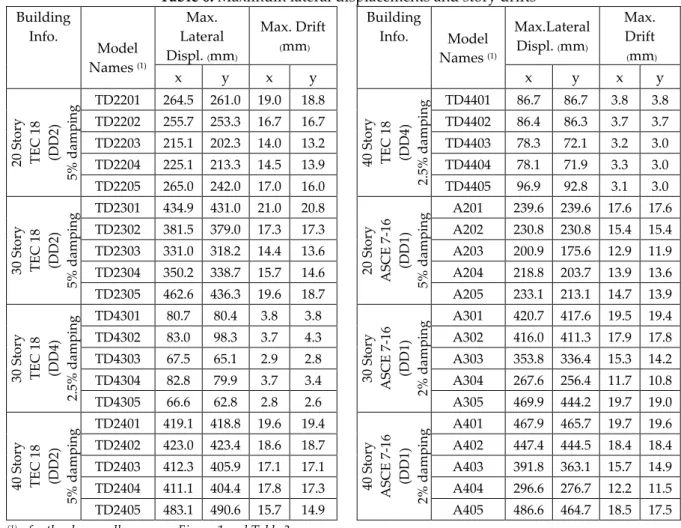
Table 6 shows the maximum lateral displacements and story drifts of each building model. The maximum displacements occurred at the top floor of each building while the story drifts (it is the lateral displacement of one floor relative to the floor above or below) occurred at floor number 11 in the x and floor number 16 in the y direction in both ASCE 7-16 and TEC 18.
Based on the results, the displacements and drifts of the 20 story building resulting from TEC 18 were approximately 10% more than those resulting from ASCE 7-16. This result was attributed to the cracked properties that were used only in TEC 18, which led to much larger lateral deflections. The presence of shear wall, as expected, reduced the roof deflection by as much as 20% when the shear wall area to floor area ratio was 1.0% as compared to the building with no wall. However, beyond the 1.0% shear wall area ratio, the roof deflections did not indicate any further reduction, and in fact, showed a slight increase due to the less columns that were used in the buildings both with 1.5% and 2.0% wall ratios.
The displacement and drift results of the DD2 to DD4 of TEC 18 that were used only in the 30 and 40 story buildings were compared to each other. As expected, the DD2 generated an average of 5 times more displacements and drifts than those from the DD4. However, the variation of the displacement and drifts from the DD2 to DD4 was more prominent, which was as little as 3.9 and as high as 7.2.
The maximum lateral displacements and story drifts of the 30 and 40 story buildings resulting from the DD2 in TEC 18 were compared to their counterparts resulting from the DD1 in ASCE 7-16. The displacements and drifts of both TEC 18 and ASCE 7-16 were almost equal to each other except for the
building model with a 1.5% shear wall area ratio. In the 1.5% ratio, the displacement and drift values of TEC 18 were 30% more in the 30 story building and 40% more in the 40 story building case due to heavier seismic weight.
Table 5. Base shear and total wall shear forces
(1)for the shear wall areas, see Figure 1 and Table 3.
Building Information Model Names (1) Base Shear (kN)
Total Wall Shear (kN)
Wall Shear/Base Shear Percentage (%) FX FY FX FY FX FY 20 S tor y T E C 1 8 (DD 2) 5% d am p ing TD2201 37902.5 38302.4 ـــ ـــ ـــ ـــ TD2202 44540.5 44896.0 29749.0 29178.9 66.8 65.0 TD2203 52992.6 64586.8 41239.9 49066.2 77.8 76.0 TD2204 55353.5 66473.4 53326.3 58821.3 96.4 88.5 TD2205 62232.5 73173.1 60134.2 67924.7 96.6 92.8 30 S tor y T E C 18 (DD 2) 5% d am p ing TD2301 36568.8 36838.2 ـــ ـــ ـــ ـــ TD2302 46196.4 46459.3 16897.8 16290.1 36.6 35.1 TD2303 54879.1 64276.1 36503.8 42505.0 66.5 66.2 TD2304 55552.1 64530.5 49101.6 52617.5 88.4 81.5 TD2305 57739.3 67078.2 56294.8 63627.2 97.5 94.9 30 S tor y T E C 18 (DD 4) 2. 5% d am p ing TD4301 9322.6 9318.5 ـــ ـــ ـــ ـــ TD4302 10617.8 12777.0 4495.4 5307.1 42.4 41.5 TD4303 12931.2 15740.0 9523.9 11947.9 73.7 75.9 TD4304 11422.8 13685.2 10839.6 12180.9 94.9 89.0 TD4305 14987.3 17262.3 14458.1 15647.6 96.5 90.7 40 S tor y T E C 18 (DD 2) 5% d am p ing TD2401 30256.3 31776.6 ـــ ـــ ـــ ـــ TD2402 34648.1 37299.7 17152.7 13778.6 49.5 37.0 TD2403 47319.5 59540.5 34010.2 36395.6 71.9 61.1 TD2404 45540.5 56203.9 44586.4 44652.3 97.9 79.4 TD2405 53899.6 63304.5 52489.2 52107.0 97.4 82.3 40 S tor y T E C 18 (DD 4) 2. 5% d am p ing TD4401 8482.2 8510.8 ـــ ـــ ـــ ـــ TD4402 10668.5 10291.0 4084.8 3925.1 38.3 38.1 TD4403 12700.1 15729.7 8464.4 10933.6 66.7 69.5 TD4404 12535.2 15139.9 11172.2 10210.1 89.1 67.4 TD4405 14018.5 16156.0 13751.3 14805.6 98.1 91.7 20 S tor y A S C E 7 -16 (DD 1) 5% d am p ing A201 43458.8 43337.0 ـــ ـــ ـــ ـــ A202 53135.2 53135.2 28285.3 28285.3 53.2 53.2 A203 60540.1 81558.1 51377.7 68006.4 84.9 83.4 A204 77590.4 95422.0 76325.2 89205.4 98.4 93.5 A205 81157.0 96033.1 80283.4 83868.1 98.9 87.3 30 S tor y A S C E 7 -16 (DD 1) 2% d am p ing A301 47653.7 47954.7 ـــ ـــ ـــ ـــ A302 54215.9 54746.5 21723.8 20938.3 40.0 38.3 A303 64774.5 77411.0 46913.7 49098.9 72.4 63.4 A304 47770.8 55370.9 43014.7 42858.8 90.0 77.4 A305 86353.7 99725.5 81333.3 89211.1 94.2 89.5 40 S tor y A S C E 7 -16 (DD 1) 2% d am p ing A401 50537.4 50764.8 ـــ ـــ ـــ ـــ A402 56058.2 56398.2 19552.0 18884.4 34.9 33.5 A403 66327.1 76907.0 42747.4 42287.8 64.5 55.0 A404 47307.6 54210.2 39528.9 37976.2 83.5 70.1 A405 61934.9 68680.4 57494.7 58711.3 92.8 85.5
Table 6. Maximum lateral displacements and story drifts
(1) for the shear wall areas, see Figure 1 and Table 3.
Further Study of Shear Walls with 2.0% Ratio
Further study of shear walls with a 2.0% shear wall area ratio was conducted using DD2 in TEC 18. The effective layout of wall configuration is important when determining the wall resistance against lateral loads. The results of varying wall layouts might be different even if the same wall area to floor area ratio is maintained. In order to emphasize the significance of wall layouts, a simple change in the layout was proposed as shown in Figure 1.f. The perimeter walls located in the mid-span were kept as rectangular ones similar to the other 2.0% wall ratio case, while the extra wall area needed to achieve the 2.0% wall ratio was placed to the four corners as L-shaped ones. The seismic analyses of 40 story buildings were conducted using the forces resulting from DD2 in TEC 18. Thus, a total of two separate wall layouts with the same wall ratios was investigated. The original 2.0% wall ratio was labeled as option 1 while this newly proposed one is labeled as option 2. The results of layout options 1 and 2 were compared to each other in the same order as discussed in the previous sections. Based on the results of building periods, the fundamental period was decreased by 18% (see Table 7).
Table 7. Building periods of Options 1 and 2 Building Info. Model Names (1) Max. Lateral Displ. (mm) Max. Drift (mm) Building Info. Model Names (1) Max.Lateral Displ. (mm) Max. Drift (mm) x y x y x y x y 20 S tor y TEC 18 (DD2 ) 5% da m pi n g TD2201 264.5 261.0 19.0 18.8 40 S tor y TEC 18 (DD4 ) 2. 5% da m pin g TD4401 86.7 86.7 3.8 3.8 TD2202 255.7 253.3 16.7 16.7 TD4402 86.4 86.3 3.7 3.7 TD2203 215.1 202.3 14.0 13.2 TD4403 78.3 72.1 3.2 3.0 TD2204 225.1 213.3 14.5 13.9 TD4404 78.1 71.9 3.3 3.0 TD2205 265.0 242.0 17.0 16.0 TD4405 96.9 92.8 3.1 3.0 30 S tor y TEC 18 (DD2 ) 5% da m pi n g TD2301 434.9 431.0 21.0 20.8 20 S tor y A S CE 7 -16 (DD1 ) 5% da m pi n g A201 239.6 239.6 17.6 17.6 TD2302 381.5 379.0 17.3 17.3 A202 230.8 230.8 15.4 15.4 TD2303 331.0 318.2 14.4 13.6 A203 200.9 175.6 12.9 11.9 TD2304 350.2 338.7 15.7 14.6 A204 218.8 203.7 13.9 13.6 TD2305 462.6 436.3 19.6 18.7 A205 233.1 213.1 14.7 13.9 30 S tor y TEC 18 (DD4 ) 2. 5% da m pin g TD4301 80.7 80.4 3.8 3.8 30 S tor y A S CE 7 -16 (DD1 ) 2% da m pi n g A301 420.7 417.6 19.5 19.4 TD4302 83.0 98.3 3.7 4.3 A302 416.0 411.3 17.9 17.8 TD4303 67.5 65.1 2.9 2.8 A303 353.8 336.4 15.3 14.2 TD4304 82.8 79.9 3.7 3.4 A304 267.6 256.4 11.7 10.8 TD4305 66.6 62.8 2.8 2.6 A305 469.9 444.2 19.7 19.0 40 S tor y TEC 18 (DD2 ) 5% da m pi n g TD2401 419.1 418.8 19.6 19.4 40 S tor y A S CE 7 -16 (DD1 ) 2% da m pi n g A401 467.9 465.7 19.7 19.6 TD2402 423.0 423.4 18.6 18.7 A402 447.4 444.5 18.4 18.4 TD2403 412.3 405.9 17.1 17.1 A403 391.8 363.1 15.7 14.9 TD2404 411.1 404.4 17.8 17.3 A404 296.6 276.7 12.2 11.5 TD2405 483.1 490.6 15.7 14.9 A405 486.6 464.7 18.5 17.5
Building Information Model Names Building periods (sec) T1 T2 T3 40 Story, TEC 18 (DD2)
5% damping
TD2405 – Option 1 8.118 7.603 5.978 TD2405 – Option 2 6.630 6.377 4.707
The total base shear and wall shear forces of the two options were compared to each other. As shown in Table 8, the second option generated an average of 15% more base shear forces and an average of 25% more wall shear forces due to less period values. However, the percentage of wall shear force to base shear ratio increased more prominently in the y direction from the 82% ratio calculated for option 1 to a 90% ratio calculated for option 2. Thus, the wall layout in option 2 satisfied the 90% critical ratio in both x and y directions.
Table 8. Base shear and total wall shear forces of Options 1 and 2
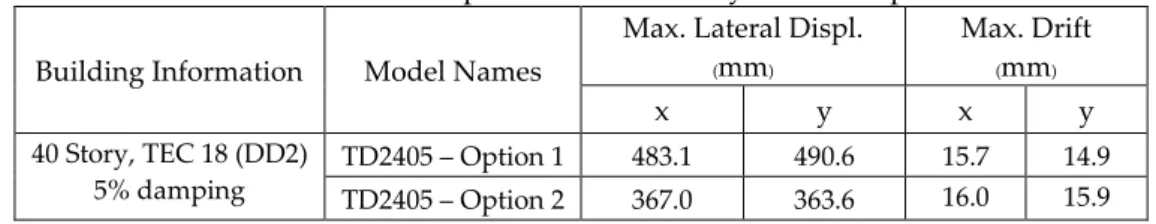
Table 9 shows the results of the maximum lateral displacements and story drifts of the two options. The maximum displacements occurred at the roof level while the story drifts were again at floor number 11 in the x and floor number 16 in the y direction. Based on the results, the maximum displacements from the second option were 25% less on average than their counterparts from the first option.
Table 9. Maximum lateral displacements and story drifts of Options 1 and 2
6. CONCLUSIONS
The results of the parametric studies of 40 buildings are presented under four groups. These groups are: (a) building periods, (b) base shear and total wall shear forces, (c) maximum lateral displacements and story drifts, and (d) wall configuration.
(a) building periods
The fundamental periods of all building models in TEC 18 were always larger than those in ASCE 7-16 due to the heavier seismic weights in TEC 18 resulting from a live load participation factor of 0.3 as opposed to a factor of zero used in ASCE 7-16. For the 30 and 40 story buildings, the building periods from the DD2 were slightly larger than those from the DD4 due to different damping ratios and cracked properties associated with these two design stages. The periods from the DD2 to DD4 increased by an average of 20% for the 30 story building, and an average of 35% for the 40 story one. As expected, as the shear wall ratios increased the fundamental period decreased. An increase from a no wall to 1.5% shear wall case resulted in an increase in the periods by an average of 20%.
Building Information Model Names
Base Shear (kN)
Total Wall Shear (kN) Wall Shear/Base Shear Percentage (%) FX FY FX FY FX FY 40 Story, TEC 18 (DD2) 5% damping TD2405 – Option 1 53899.6 63304.5 52489.2 52107.0 97.4 82.3 TD2405 – Option 2 66473.5 74960.6 65189.4 65536.5 98.1 87.4
Building Information Model Names
Max. Lateral Displ. (mm) Max. Drift (mm) x y x y 40 Story, TEC 18 (DD2) 5% damping TD2405 – Option 1 483.1 490.6 15.7 14.9 TD2405 – Option 2 367.0 363.6 16.0 15.9
(b) base shear and total wall shear forces
The base shear forces of the 20 story building generated from the DD2 in TEC 18 were 20% less in average than those obtained from the DD1 in ASCE 7-16 due to the smaller periods in ASCE 7-16. Similar to the trend in base shear, the wall shear forces from TEC 18 were again 20% less on average than those from ASCE 7-16. As the wall area ratio increased, both the base shear and the total shear forces in the walls decreased from a minimum of 10% in the 0.5% wall case to a maximum of 30% in the 2.0% wall case. Therefore, it was concluded that the diversion between the TEC 18 and ASCE 7-16 was a lot more prominent as the shear wall area increased.
As expected, both for the 30 and 40 story buildings, the DD2 in TEC 18 compared to the DD4 in TEC 18 generated much larger base shear and wall shear forces. The ratios of forces from the DD2 to DD4 varied from a minimum of 3.1 to a maximum of 4.9. The results indicated that the increase in the quantity of shear wall area made a prominent change in the base shear and wall shear forces for both the DD2 and the DD4. As the ratio of wall area increased from 0.5% to 2.0%, the shear forces resisted by the walls of the 30 and 40 story buildings resulting from both the DD2 and DD4 increased from an average of 42% to 93%. This result concluded that the 90% critical ratio of total wall shear to base shear was achieved both for the DD2 and DD4 when the 2.0% wall ratio was provided.
The base shear forces of the 30 and 40 story buildings with no walls resulting from the DD2 in TEC 18 were approximately 80% and 60% of those from the DD1 in ASCE 7-16. As the wall area ratios increased to 1.5%, the results from the two earthquake codes became almost identical to each other. However, at the 2.0% of wall area ratio, the results of TEC 18 were less by an average of 30% in the 30 story and 10% in the 40 story buildings. The results indicated that the forces from the two earthquake codes converge to each other at a wall ratio of 1.5%.
According to the results of DD2 in TEC 18, the 90% critical ratio of shear wall force to base shear was achieved in the x direction when the shear wall to floor area ratios were somewhere between 1.0% to 1.5% for the 20 story, 1.5% to 2.0% for the 30 story, and around 1.5% for the 40 story buildings. However, in the y direction, these ratios varied due to the less wall areas defined in the y direction. The critical ratios were achieved in the y direction when the shear wall to floor area ratios was somewhere between 1.5% to 2.0% for the 20 and 30 story buildings. However, in the 30 story building, even the 2.0% ratio was not adequate to achieve the 90% target ratio. Therefore, it was concluded that more wall area was needed as the building became taller. Based on the results, as a rule of thumb, for 20 story buildings, a shear wall area to floor area ratio of 1.5%, and for 30 story buildings, 2.0% can be recommended. For 40 story buildings, a wall ratio somewhere between 2.0% to 2.5% is believed to be adequate. However, it is important to emphasize the significance of effective wall layout. Therefore, more consideration should be given to the wall layout.
(c) maximum lateral displacements and story drifts
According to the results of the 20 story buildings, the maximum roof displacements generated from the DD2 in TEC 18 were approximately 10% more on the average to those from the DD1 in ASCE 7-16. The presence of shear wall, as expected, reduced the roof deflection by as much as 20% compared to a no wall case when the shear wall area to floor area ratio was 1.0%. However, as the shear wall area ratio was increased from 1.0% to 1.5% and 2.0%, the roof deflections did not show any further reduction, and in fact, increased slightly due to the less columns that were used both in the 1.5% and 2.0% wall ratio cases. Therefore, strengthening the wall ends with columns might be more effective than simply increasing the wall ratio.
The roof displacements and story drifts of the 30 and 40 story buildings resulting from the DD2 in TEC 18 were compared to those from the DD1 in ASCE 7-16. Based on the results, the displacements and drifts of both TEC 18 and ASCE 7-16 were approximately equal to each other except for the buildings with a 1.5% shear wall area ratio. In the 1.5% ratio, the displacements and drifts of the 30 and 40 story buildings resulting from TEC 18 were respectively, 30% and 40% more when they were compared to those of ASCE 7-16. The results indicated that the DD2 in TEC 18 and the DD1 in ASCE 7-16 generated somewhat similar displacements to each other due to varying damping ratios and cracked concrete properties.
In the 30 story building, as the ratio of shear wall area increased from no wall to 1.5% ratio, the associated roof displacements and story drifts decreased by as much as 20%. In the 40 story building, the same increase caused only a 5% decrease in the roof displacements and drifts. However, as the wall ratio was increased to 2.0%, the deflections became slightly larger than those from the no wall case due to the columns eliminated to provide additional walls in the 2.0% wall case. Therefore, it was concluded that a balance between the number of columns and walls should be maintained to provide effective lateral strength to the structural system. It is, therefore, might not be effective just to increase the number of columns for the buildings with 30 or more floors.
(d) wall configuration
As discussed before, the effective wall layout was also studied for the 2.0% shear wall area ratio. The walls in option 2 were oriented around the corners of the building, which would resist more effectively to the lateral forces. As expected, the fundamental period of the building in option 2 reduced by 18%, which in turn resulted in about 25% smaller roof deflections as compared to the building in option 1. The base shear and wall shear forces of the building in option 2 generated 25% more base shear and 15% more wall shear forces compared to the one in option 1. Changing the wall layout as it was performed in option 2 increased the ratio of shear forces resisted by the walls specifically in the y direction by an average of 6%. Thus, this increase in the shear force ratio improved the building’s lateral resisting system. Therefore, it is important to arrange the wall layout more effectively. Based on the results of the 40 story building, the further away the walls from the geometric center the better becomes their structural performance as long as the overall wall symmetry is maintained.
REFERENCES
Al-Ageedi, M., 2019, Determination of the Optimum Shear Wall Area to Floor Area Ratio for Reinforced Concrete Buildings, Master’s Thesis in Civil Engineering, Atilim University, Ankara.
ASCE 7-16: Minimum Design Loads and Associated Criteria for Buildings and Other Structures, 2016, American Society of Civil Engineers, Virginia.
Burak, B., Comlekoglu, H.G., 2013, “Effect of Shear Wall Area to Floor Area Ratio on the Seismic Behavior of Reinforced Concrete Buildings”, Journal of Structural Engineering, ASCE, Vol. 139, No. 11, pp. 1928-1937.
Esmaili, O., Epackachi, S., Samadzad M., Mirghaderi, S.R., 2008, “Study of Structural RC Shear Wall System in A 56-Story RC Tall Building”, The 14 World Conference on Earthquake Engineering, Beijing, China, October 12-27, 2008.
ETABS Version 17.0.1, 2018, Computers and Structures Inc.
Fintel, M. 1995, “Performance of Buildings with Shear Walls in Earthquakes of the Last Thirty Years”, PCI Journal, Vol. 40, pp. 62-80.
Foroughi, S., Yüksel, S. B., 2016, “Effect of Shear Walls on the Seismic Behavior of the Cast-in-Site Reinforced Concrete Buildings,” The 2nd International Conference on Modern Research in Civil Engineering, Architectural & Urban Development, March 14, 2016, Istanbul, Turkey. Gunel, A., 2013, Influence of the Shear Wall Area to Floor Area Ratio on the Seismic Performance of Existing
Reinforced Concrete Buildings, Master’s Thesis in Civil Engineering, Middle East Technical University, Ankara.
Gupta, S., Akhtar S., Hussain, A., 2016, “Effect of Shear Wall Location on Bending Moment and Shear Force of Multistory Building Subjected to Earthquake Loading,” International Journal of Computer and Advanced Engineering Research, Vol. 3, Issue 2, pp. 4-21.
Kumar Y.R., Kumar, P.B., 2018, “Effect of Shear Wall Area to Floor Area Ratio on Seismic Performance of R.C. Structures,” International Journal of Civil Engineering and Technology, Vol. 9, Issue 4, pp. 844–852.
Malik, R., Madan S.K., Sehgal, V.K., 2011, “Effect of Height on Seismic Response of Reinforced Cement Concrete Framed Buildings with Curtailed Shear Wall”, Journal of Engineering and Technology, Vol. 1, Issue 1, pp. 43-46.
Mohammad, A.U.R., Bharathi, D., 2016, “Effect of Shear Wall Area to Floor Area Ratio on the Seismic Behavior of Reinforced Concrete Buildings,” International Journal & Magazine of Engineering, Technology, Management and Research, Vol. 3, Issue 10, pp. 1424-1433.
Nollet, M.J., Smith, B.S., 1993, “Behavior of Curtailed Wall-Frame Structures,” Journal of Structural Engineering, Vol. 119, Issue 10, pp. 2835-2854.
Soydas, O., 2009, Evaluation of Shear Wall Indexes for Reinforced Concrete Buildings, Master’s Thesis in Civil Engineering, Middle East Technical University, Ankara.
Sreevalli, T., Priya, N.H., 2017, “Effect of Shear Wall Area on Seismic Behavior of Multistoried Building Tube in Tube Structure,” International Journal of Engineering Trends and Technology, Vol. 44, Issue 4, pp. 202-210.
TBI 17: Tall Buildings Initiative Guidelines for Performance Based Seismic Design of Tall Buildings, 2017, Pacific Earthquake Engineering Center, Report No. 2017/06.
TEC 18: Turkish Building Earthquake Code, 2018, Turkish Disaster and Emergency Management Authority, AFAD, Ankara.
TS 498: Design loads for Buildings, 1997, Turkish Standards Institution, TSE, Ankara.
TS 500: Requirement for Design and Construction of Reinforced Concrete Structures, 2000, Turkish Standards Institution, TSE, Ankara.
![Table 2. Effective stiffness values in TEC 18 and TBI 2017 [14]](https://thumb-eu.123doks.com/thumbv2/9libnet/4972659.100675/7.892.172.794.322.652/table-effective-stiffness-values-in-tec-and-tbi.webp)