Effect of Pitching Delta Wing on Vortex Structures with and
without Impingement Plate
Muammer ¨OZG ¨OREN and Be¸sir S¸AH˙IN Department of Mechanical Engineering, C¸ ukurova University,
01330, Adana-TURKEY
e-mail: [email protected] and [email protected]
Received 05.06.2001
Abstract
Flow past the leading edge of a delta wing oscillating about its mid-cord in a pitch plane with a reduced frequency of K=0.74 generates primary vortices having mostly elongated shapes. Their shapes and orienta-tions vary with the pitching angle of the delta wing in upstroke and downstroke direcorienta-tions. Unsteady flows around the impingement plate placed downstream of the delta wing and in the flow field downstream of the onset of vortex breakdown are characterized by the existence of unsteady large-and small-scale vortices. These time-dependent vortex core formations and breakdowns apply aerodynamic loads to the impingement plate. For the pitching delta wing, the development of the vortex core and degree of hysteresis are found to be a strong function of reduced frequency.
Key words: PIV, Delta wing, Vortex breakdown, Angle of attack, Pitching Introduction
Improved understanding of unsteady flow phenom-ena, especially from a fundamental fluid dynamics aspect, is essential in order to develop an effective control scheme. In this sense, control of vortex breakdown continues to be of vital importance be-cause the breakdown may have a considerable ef-fect on aerodynamic behavior such as aircraft per-formance where unsteadiness may affect the stability of an aircraft and also cause buffeting.
Comprehensive reviews of experimental and the-oretical descriptions of various aspects of the vortex breakdown process were given by Hall (1972), Lei-bovich (1978, 1984), Escudier (1988) and Rockwell (1998). The structure of vortex breakdown was stud-ied by Lambourne and Bryer (1961), Sarpkaya (1971) and Faler and Leibovich (1977) using traditional flow visualization techniques. The most recent reviews on vortex breakdown were done by Mitchell and Delery (2001) and Negro and Doherty (2001).
The effect of shear layer control on leading edge
vortices over delta wings with a sharp leading edge was investigated by McCormick and Gursul (1996). This type of flow was also numerically studied by Hammand and Redekopp (1994), Gad el-Hak and Blackwelder (1987) and Gordnier and Visbal (1995). The force testing of small-scale models in a wa-ter tunnel was investigated by Atlee et al. (1998) to obtain static and dynamic forces and moment data representative of full-scale fighter aircraft maneuver-ing in the post-stall regime. A review of experimen-tal data for a delta wing under both steady and un-steady conditions was presented from a vortex dy-namics point of view by Lee and Ho (1990). Conclu-sions were derived that vortices on the suction sur-face provide an important contribution to the lift of a delta wing, especially for those with a large sweep back angle.
S¸ahin et al. (2001) indicated that a substantial retardation, or delay, in the onset of vortex break-down, and thereby development of a large-scale con-centration of vorticity, are attainable when the lead-ing edge of the implead-ingement plate positioned in the
wake-flow region is perturbed at a natural frequency of vortex breakdown. Akıllı et al. (2001) used the technique of high-image-density Particle Image Ve-locimetry to characterize the alterations and struc-ture of the leading edge vortex formed from a delta wing at high angle of attack in the presence of a small wire oriented transversely to the axis of the vortex. It was demonstrated that an extremely small wire hav-ing a diameter two orders of magnitude smaller than the diameter of the leading edge vortex prior to the onset of vortex breakdown can substantially advance the onset of breakdown by as much as fifteen vortex diameters. It was indicated that the effectiveness of a wire at a given diameter is a strong function of the location of the wire along the axis of the vortex.
The unsteady structure of flow on a delta wing subjected to controlled motion has received less at-tention. Leading edge vortices due to low Reynolds number flow past a pitching delta wing were exam-ined by Atta and Rockwell (1990). They oscillated the delta wing sinusoidally over a range of tenfold re-duced frequency in order to determine the nature of the vortex development and breakdown. They found that the vortex core develops in the upstream direc-tion towards the apex at low frequencies. On the other hand, there is an ejection of the leading edge of the vortex core from the apex in the downstream direction at high frequencies. They defined reduced frequency as K = πfeC/U∞. This dimensionless fre-quency represents the ratio of the wing chord C to the wavelength U∞/fe of the forced motion, where U∞is the freestream (reference) velocity and feis the frequency of the delta wing. They examined the flow structure over the range of reduced frequency 0.025 < K < 1.94 and mean angle of attack 5◦< αm< 20◦. It is known that a delta wing in steady flow can pro-vide high lift at large angles of attack and are there-fore used on many high-performance aircraft.
Gad el-Hak and Ho (1985) studied the flow field around two pitching delta wings with apex angles of 90◦ and 60◦, at chord Reynolds number up to 3.5× 10⁵. The reduced frequency was in the range K = 0.05 to 3. They reported that the three-dimensional separation process of the leading edge vortex starts from the trailing edge corners and prop-agates upstream and inward. At low reduced fre-quencies, the separation region on the suction side is fairly thick. A distinct change of the flow pat-tern happens at K = π. In the work of LeMay et al. (1990) a sharp-edged, flat–plate delta wing hav-ing a sweep angle of 70◦ was used. The wing was
sinusoidally pitched about its one-half chord posi-tion at reduced frequency ranging from K= 0.025 to 0.15 at root chord Reynolds numbers between 9× 10⁴ and 3.5× 10⁵ for angle of attack ranges of
α = 29◦ to 39◦ degree and α = 0◦ to 45◦. The hys-teresis and an overshoot are observed in the chord-wise position of vortex breakdown at a reduced quency as low as K = 0.025. As the reduced fre-quency is further increased the hysteresis effect be-comes greater. ¨Ozg¨oren et al. (2001a) investigated the vortex generation of a stationary and pitching delta wing in the presence of the stationary impinge-ment plate by acquiring images of flow in side- view and end-view planes. They observed that the mecha-nism of vortex-plate interaction varies substantially. Features of the partitioned vorticity field are also interpreted in terms of space-time distributions of vertical (transverse) velocity above and below the impingment plate. The magnitude of the buffet ve-locity distribution is found to be sensitive to the el-evation from the top or bottom surface of the im-pingement plate. Shih and Ho (1994) had a station-ary two-dimensional NACA 0012 airfoil placed at the static stall angle of 12◦in a sinusoidally varying free stream. They introduced a local circulation mea-surement technique to survey the evolving vorticity field on the airfoil and showed that the aerodynamic properties were closely related to the change of cir-culation as a result of the balance between vorticity convection and generation from the surface. The vor-ticity produced by the spatial variation of the pres-sure gradient always cancels the vorticity convection of the boundary layer. Therefore, the surface vor-ticity flux generated by the temporal change of the surface pressure dominates the dynamics of the at-tached flow.
The aim of the present investigation is to study the patterns of vortex development under the effect of a pitching motion of a delta wing with and with-out an impingement plate placed in the wake flow region using a scanning laser version of high-image density Particle Image Velocimetry.
Measurement Techniques and Experimental System
Experiments were carried out in a recirculating, free-surface water channel located in Lehigh University, Fluid Mechanics Laboratory, USA. The water chan-nel test section was constructed of transparent Plexi-glas with upstream and downstream PVC reservoirs,
which had a cross section of 927 mm x 610 mm. The free-surface of the water was maintained at a height of 558.8 mm. The water flow speed was con-trolled by an axial flow pump, which provided reli-able test section flow speeds of 2.0 cm/s to 38 cm/s. A honeycomb, which had an area ratio of 2:1, was located immediately upstream of contraction. This flow conditioning provided very low levels of turbu-lence intensity in the test section. All experiments were performed at a speed of U∞= 42 mm/s and the Reynolds number was around Re = 9.4× 10³ based
on a chord of 222.3 mm delta wing.
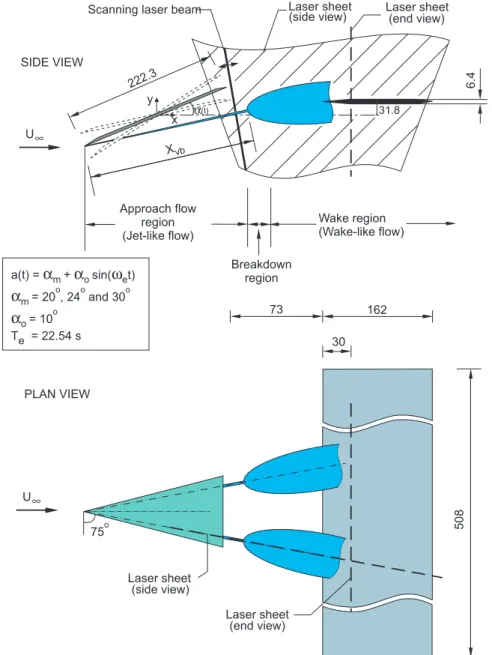
A schematic of the experimental system used in the present investigation is shown in Figure 1. The delta wing used had a chord length of C = 222.3 mm at a sweep angle of Λ = 75◦ . The thickness of the delta wing was 3.18 mm. It was beveled at an an-gle of 34◦ on its windward side. The impingement plate had a length of Lp = 162 mm and a thickness of tp = 6.35 mm. The distance between the trailing edge of the delta wing and the leading edge of the impingement
Scanning laser beam Laser sheet
6.4 31.8 Xvb α(t) y x 222.3 Approach flow region (Jet-like flow) Breakdown region Wake region (Wake-like flow) ∞ U SIDE VIEW 508 162 73 PLAN VIEW a(t) = + sin( t) = 20 , 24 and 30 = 10 T = 22.54 s α α ω α α m o e m o o o o o e ∞ U 75o Laser sheet (side view) Laser sheet (end view) 30 Laser sheet (side view) (end view)
Figure 1. Schematics of delta wing subjected to high-amplitude oscillations about its mid-chord and the impingement plate. Dimensions are in mm.
plate was maintained at L = 73 mm. Both the delta wing and the impingement plate were mounted in separate sections, placed between two 12 mm thick false walls, and spaced 508 mm apart to facilitate installation in the water channel test section. The front edges of the false walls were beveled in order to provide sharp edges, which minimize flow distur-bance. The delta wing and the impingement plate were placed at the mid distance between the free surface and the bottom wall of the channel, which were 560 mm apart. The delta wing was connected to a driving mechanism so that it could be driven in its a pitch plane independently.
The delta wing was sinusoidally oscillated about its mid-cord in a pitch plane to provide a vortex core that convects downstream and impinges upon the leading edge of the sharp-edged impingement plate, as seen in Figure 1. A step motor controlled the os-cillation amplitude and frequency of the delta wing motion. The variation of angle is defined as∝(t) = ∝m +∝osin (ωet) where ωe = 2πfe. The period Te = 2π/ωeand the time interval between images were Te= 22.54 s and 0.644 s, respectively.
In the present study, a high-powered Argon Ion laser with a 20 watt power output was used. The laser sheet was created by passing the laser beam through a steering mirror and a focusing lens combi-nation onto a 8-facet rotating mirror to create a ver-tical side view scanning laser sheet. The 8-faceted mirror rotated at a frequency of 9.38 Hz, giving a scanning frequency of 75 Hz. The frequency and am-plitude of the oscillating mirror were controled by an optical scanner and its amplifier. A rotating mirror scanning frequency of 75 Hz allowed a Canon Eso-1 camera to photograph 5 exposures of the metal-lic coated seeding particles when the camera shutter speed was 1/15 s. The magnification factor of the camera lens was 1:4.3. A bias mirror placed in front of the camera lens at 45◦ to the optical axis of the camera could be activated to superimpose artificial uniform velocity (bias velocity) on the flow. In other words, the bias mirror oscillated at 3.33 Hz with the desired amplitude of 0.30 V while the camera shutter was open; this added a positive displacement to all particles in the free stream direction.
The film used for particle images was 35 mm Ko-dak Tmax, with a resolution of 300 lines per mil-limeter, which was digitized at a resolution of 125 pixel/mm. A single frame cross-correlation tech-nique was employed to determine the velocity field. Each image was mapped into a regular mesh of
over-lapping interrogation windows size of 90 by 90 pixels. An overlap ratio of 0.5 was used in order to satisfy the Nyquist sampling criterion. This resulted in a grid spacing of 61 mm on the negative or 76 mm in the actual flow field. The grid size was 61× 94, re-sulting in 5734 velocity vectors in an actual field size of 142 mm x 92 mm.
Discussion of Experimental Results
Vortex Breakdown Hysteresis
In this section of the study, the dynamic behavior of the leading edge vortices with and without an im-pingement plate was investigated using dye visual-ization and PIV to define the position of the onset of vortex breakdown. As seen in Figure 1, Xvb spec-ifies the distance between onset of vortex breakdown and apex of a delta wing. The onset of vortex break-down distance Xvbis normalized by delta wing chord length C as X∗vb = Xvb /C. A delta wing was sinu-soidally pitched about its mid-chord with a reduced frequency of K = 0.74 for mean angles of attack of αm = 20◦, 24◦ and 30◦ with an amplitude of αo = 10◦.
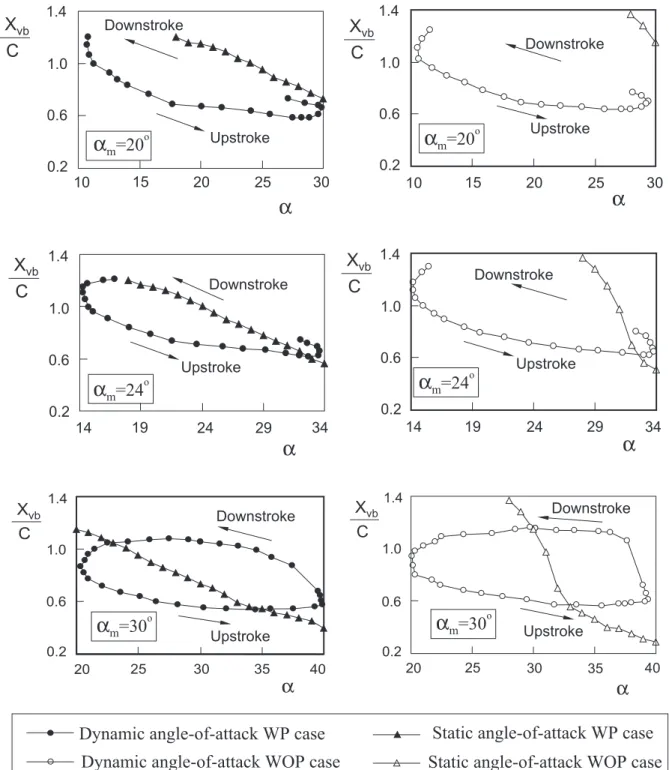
Non-dimensional onset of vortex breakdown lo-cations are presented as a function of angles of at-tack in Figure 2 for a pitching cycle along with static data obtained over the same angles of attack range and free stream velocity. Before explaining the re-sults, it is worth mentioning that the required time for full relaxation of the breakdown to its equilib-rium position does not appear to correlate with the pitching rate. Because, the delta wing subjected to a pitching motion with a reasonably high reduced fre-quency induces phase shift between the delta wing motion and the onset of vortex breakdown. Figure 2 gives a graphical representation of how the location of vortex breakdown varies not only between the up-stroke and the downup-stroke of a given motion, but also how it differs from the static results for three different mean angle of attack values. A study of the dynamic behavior of the leading edge vortices on a delta wing undergoing oscillatory pitching motion with a reduced frequency ranging from K = 0.05 to 0.3 was presented by LeMay et al. (1990). The delta wing was oscillated in a sinusoidal fashion in the an-gles of attack range between 29◦and 39◦. The hys-teresis they observed had a 2 % difference with the static cases. In the present experiment, the existence of a dynamic hysteresis in the vortex flow relative to the static case is shown in Figure 2. Here, the results
Dynamic angle-of-attack WP case
Dynamic angle-of-attack WOP case
Static angle-of-attack WP case
Static angle-of-attack WOP case
1.4 1.0 0.6 0.2 14 19 24 29 34
α
X
vbC
Upstroke Downstroke 1.4 1.0 0.6 0.2 10 15 20 25 30α
X
vbC
α
m=20
o Upstroke DownstrokeX
vbC
α
20 25 30 35 40 1.4 1.0 0.6 0.2α
m=30
o Upstroke Downstroke 20 25 30 35 40 1.4 1.0 0.6 0.2α
X
vbC
α
m=30
o Upstroke Downstroke 14 19 24 29 34 1.4 1.0 0.6 0.2X
vbC
α
α
m=24
o Upstroke Downstroke 1.4 1.0 0.6 0.2 10 15 20 25 30α
X
vbC
α
m=24
o Upstroke Downstrokeα
m=20
oFigure 2. Comparisons of static and dynamic loops of vortex breakdown as a function of angle of attack. Amplitude of oscillation angle of attack is αo = 10◦, period of oscillation is Te = 22.54 s and the reduced frequency is K =
0.74.
of hysteresis with plate (WP) and without plate (WOP) are compared. The hysteretic behavior is generally the same for both the WP and WOP cases. In the third diagram in Figure 2, the results of vortex
breakdown locations are presented as closed loops. This indicates that vortex breakdown never disap-pears from the entire flow field range considered in the present experiment. On the other hand, setting
the mean angles of attack to 20◦and 24◦ force the vortex breakdown locations to move further stream and disappear completely the during down-stroke of the vortex core axis. When a delta wing is pitched, there is a time lag in the response of the vortex flow structure, which can result in temporar-ily delayed vortex formation at low angle of attack or temporarily delayed vortex breakdown at higher angle of attack values. By taking advantage of these unsteady effects, a high performance aircraft might be able to perform certain maneuvers more quickly and efficiently (LeMay et al., 1990). The mechanism of aerodynamic hysteresis for sinusoidally oscillating delta wing was investigated by Huang et al. (1994). An unsteady model of a vortex system was developed to simulate the phenomena of aerodynamic hystere-sis of sinusoidally perturbed delta wings. They con-cluded that the flow separation on the wing surface strongly depends on the reduced frequency and direc-tion of the pitching modirec-tion. As the wing pitches up, the flow separation on the wing surface is suppressed. It is well known that the phase shift existing in the flow field strongly depends on the dimensionless re-duced frequency K relative to that occuring for the stationary delta wing. In the present experiment, the discrepancy between the static and dynamic onset of vortex breakdown values is significantly high due to the high-reduced frequency K. As seen in Figure 2, for delta wings undergoing cyclic motions, with K = 0.74, a hysteresis is developed in the location of vortex breakdown flow with high rate of discrepancy relative to the static case.
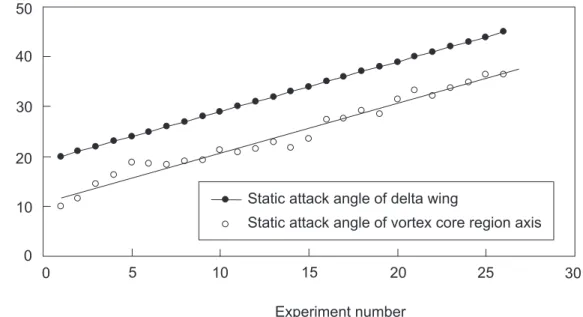
The angle difference between the static angle of attack of the delta wing and vortex core region axis is 8◦ as shown in Figure 3a. This angle is indepen-dent of the angle of attack. During the experiment of static angle of attack, considerable time was given to let the flow reach the equilibrium state. Figure 3b presents the phase difference between pitching delta wing axis and vortex core axis with respect to the case of the stationary wing. The angle of the attack of the vortex core region in the horizontal plane was calculated by fitting a straight line through the cen-ter of core region in each image. There is a high level of variation in the angle of attack of the vortex core axis corresponding to the pitching delta wing posi-tion. However, angle differences between the axis of vortex core region and pitching delta wing occur during the upstroke and downstroke motion of the delta wing. Finally, it can be stated that the maxi-mum and minimaxi-mum angle differences are 16◦and 9◦, respectively, as seen in Figure 3b.
Instantaneous Vortex Structure of a Pitching Delta Wing
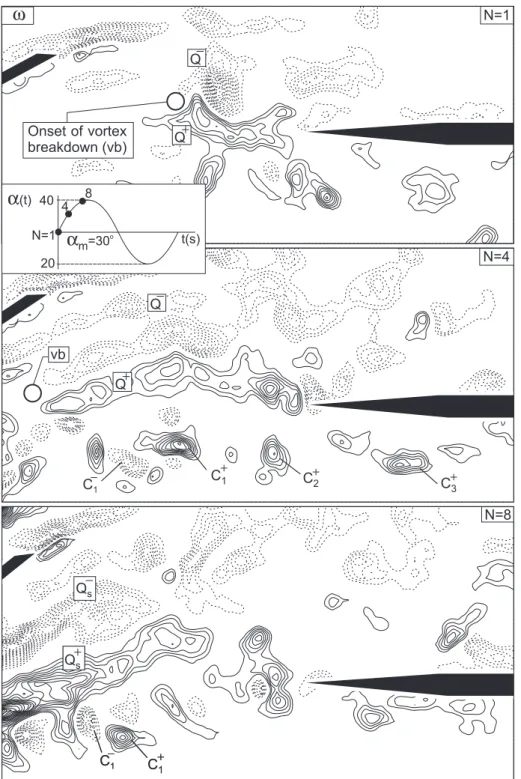
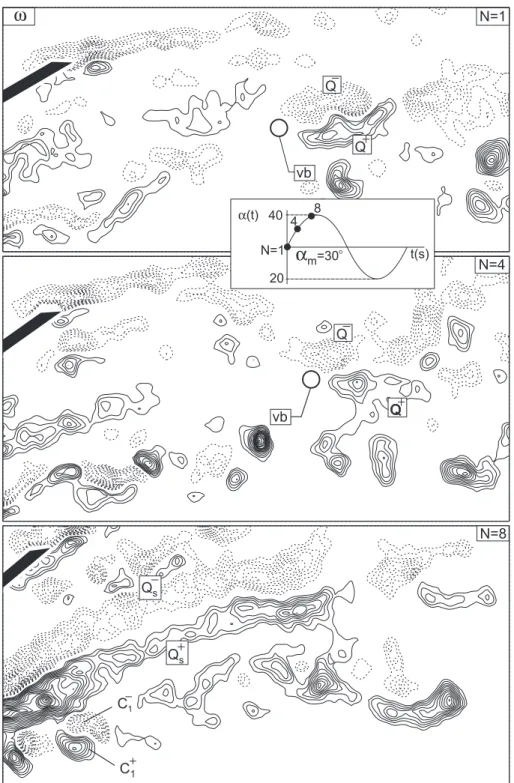
The structure of vortex breakdown using standard flow visualization techniques does not provide a pre-cise definition of the complex three-dimensional un-steady structure of the flow. The present experimen-tal study seeks to describe the unsteady flow struc-ture above or below (depending on the angle of at-tack) the pitching delta wing and along the impinge-ment plate for static and dynamic angles of attack. During one cycle of wing oscillation, 36 images were taken in the period of Te = 22.54 s. Instantaneous vorticity distributions, ω, during the pitching mo-tion with an amplitude of αo = 10◦ are presented in Figures 4 and 5. Patterns of instantaneous pos-itive and negative vorticity, ω, are indicated as a solid line and dashed line, respectively. Minimum and incremental values of these positive (solid line) and negative (dashed line) instantaneous vortices are ωmin = ±1.5s−1 and ∆ω = 0.75 s−1 respectively. Nominal angle of attack of the delta wing is αm = 30◦and amplitude of perturbation angle of attack is αo = 10◦. The onset of vortex breakdown appears at Xvb/C = 0.97 and the central axis of the vortex core is positioned above the impingement plate for the pitching angle of attack of the delta wing α(t) = 30◦ as seen in image N = 1 in Figure 4a. As indi-cated in the second and third images in Figure 4a, the location of the vortex breakdown advances up-stream towards the leading edge of the delta wing rapidly. The axis of the vortex core region moves upward and downward with the pitching motion of the delta wing. After a certain period of time, for example, by t∗ = tU∞/C = 0.85 or t = 4.508 s, vortex breakdown propagates rapidly upstream to a location close to the leading edge of the delta wing, which is around Xvb/C = 0.6 as seen in Figure 2. This result corresponds to the image N = 8 of Figure 4a. During this propagation, vortices elongate in the longitudinal direction. Counter-rotating vortices are developed around the primary vortices, which im-pinge the leading edge of the plate as well. ¨Ozg¨oren et al. (2001b) stated that a total of five distinct vor-ticity layers of a stationary delta wing are detectable in the absence of vortex breakdown at low angles of attack. Small-scale concentrations of opposite signs in the external layers of the main vertical regions appear to form a counter-rotating system. It was previously stated that in an impinging jet, the ring-shaped coherent structure in the shear layer
in-50 40 30 20 10 0 0 5 10 15 20 25 30
Static attack angle of delta wing
Static attack angle of vortex core region axis
Experiment number
α
Figure 3a. Comparison of static angle of attack of delta wing and of an axis of a vortex core region. 50 40 30 20 10 0 6 12 18 24 0
Dynamic attack angle of delta wing
Dynamic attack angle of vortex core region axis
t (sec)
α
( )tFigure 3b. Comparison of pitching angle of attack of a delta wing and of an axis of a vortex core region in the presence of the impingement plate. Amplitude of oscillation angle is αo = 10◦, nominal angle of attack is αm= 30◦
and oscillation period is Te = 22.54 s.
duces counter-rotating vortices while it approaches the walls (Gad el-Hak and Ho, 1985). In the present experiment, the animation of 36 instantaneous vor-ticity images showed that counter-rotating vortices appear clearly beyond the vortex breakdown loca-tion and move downstream. It is worth mention-ing that durmention-ing pitchmention-ing of the delta wmention-ing, rounded
shaped vortices are generated by the trailing edge of the delta wing, which is designated as the trailing edge vortex (tev) indicated in Figure 4b. During the pitching motion, there are intersections between the vortex core axis and the impingement plates. As a result of these intersections, impinging vortices peri-odically induce a high rate of unsteady aerodynamic
vb N=4 Q Q C3 C1 C1 C2 C1 C1 Qs C1 C1 Qs N=8 Qs Onset of vortex breakdown (vb) Q N=1
ω
Q 4 8 N=1α
m=30o t(s) 40 20α
(t)Figure 4a. Excerpts from cinema sequence showing evolution of patterns of instantaneous positive (solid line) and neg-ative (dashed line) vorticity ω. Minimum and incremental values of instantaneous vorticity are ωmin=±1.5
s−1 and ∆ω = 0.75 s−1.
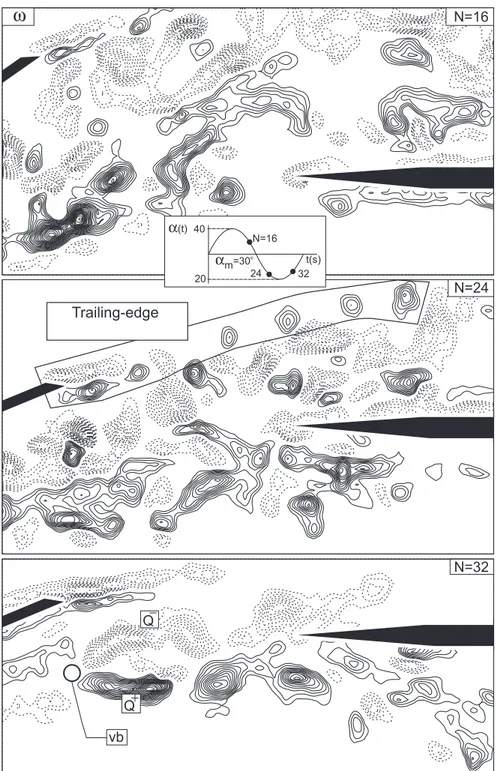
loading on the leading edge of the impingement plate. Images N = 16, N = 24 and N = 32 in Figure 4b illus-trate that the vortex breakdown core region moves downstream during the downstroke motion of the
delta wing. The existence of unsteady large- and small-scale vortices characterize the unsteady flow around the delta wing. In practical cases, these aerodynamic loads may interact with the wing
struc-tural response causing aeroelastic instabilities, which may restrict, for example, the aircraft flight enve-lope. The offset between the instantaneous location of vortex core and the delta wing and degree of
hys-teresis in relation to the static values of the delta wing were found to be a strong function of the re-duced frequency. vb Q Q N=32 Trailing-edge N=24 N=16
ω
N=16 24 32 αm=30o t(s) 40 20 α(t)Figure 4b. Excerpts from cinema sequence showing evolution of patterns of instantaneous positive (solid line) and neg-ative (dashed line) vorticity ω. Minimum and incremental values of instantaneous vorticity are ωmin=±1.5
vb N=4 Q Q C1 C1 N=8 Qs Qs N=1
ω
Q Q vb 4 8 N=1α
m=30o t(s) 40 20 α(t)Figure 5a. Excerpts from cinema sequence showing evolution of patterns of instantaneous positive (solid line) and neg-ative (dashed line) vorticity ω. Minimum and incremental values of instantaneous vorticity are ωmin=±1.5
s−1 and ∆ω = 0.75 s−1.
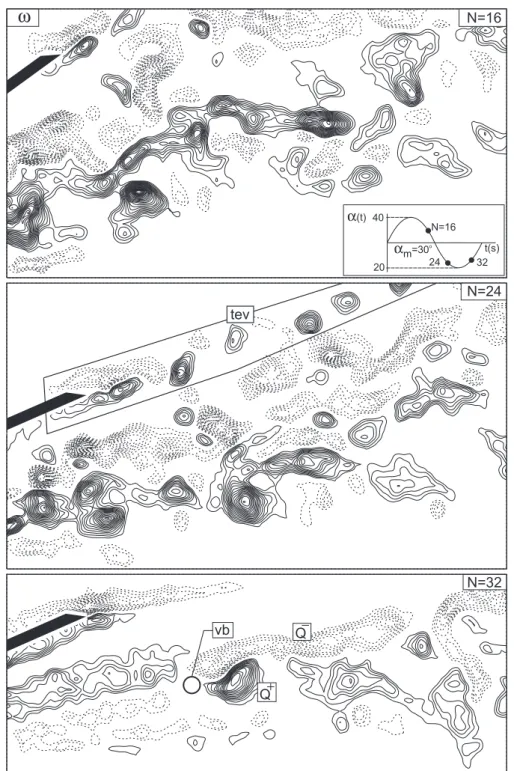
Figures 5a and 5b present instantaneous vortic-ity distributions in the absence of the WOP case. Images presented in time sequence demonstrate the mechanism of the development and collapse of the
vortex core during the pitching motion of the delta wing. In fact, in this experiment, attention was fo-cused on the primary (major) vortex formed from the leading edge of the wing and counter-rotating
vortices developed near the boundary of the primary vortex core region. Using the laser-sheet technique, it is possible to visualize not only the primary vor-tex addressed in the foregoing section, but also the
small-scale vortices, presented in Figures 4 and 5. Atta and Rockwell (1990) investigated the leading edge vortices of a pitching delta wing in order to al-low examination of the fal-low structure. They used
N=16
ω
tev N=24 vb N=32 Q Q N=16 24 32 αm=30o t(s) 40 20 α(t)Figure 5b. Excerpts from cinema sequence showing evolution of patterns of instantaneous positive (solid line) and nega-tive (dashed line) vorticity. Minimum and incremental values of instantaneous vorticity are ωmin=±1.5 s−1
different visualization techniques, such as dye injec-tion and hydrogen bubble methods. They stated from their dye visualization experiments that the primary vortex is fed by vorticity from the bound-ary layer along the leading edge of the delta wing. The secondary vortex adjacent to leading edge is fed by vorticity shed from the edge. In the present experiment, a quantitative observation was done to provide more information in detail. Through-out Figures 4 and 5 primary vortices are desig-nated as Q+ and Q−vortices developed during the over shooting process are designated as Q+
s and Q−s and counter-rotating vortices are designated as C+1...C+3, C−1...C−3. Examining all images in Figures 4 and 5, it may be seen that the onset of vortex breakdown moves forward and backward in the flow direction rapidly. In some of the images, vortex breakdown location advances well upstream beyond the left boundary of the images close to the delta wing apex. Therefore, indicating all of the locations of vortex breakdown in terms of instantaneous vor-tices of PIV readings is not possible during a com-plete pitching cycle. During the pitching motion of the delta wing, primary vortices designated as Q+ and Q−elongate substantially in the longitudinal di-rection.
Existence of the impingement plate in the flow field expands the size of the cross section of the vor-tex core region compared to the WOP case. Figures 4a and 4b demonstrate that moving the delta wing upstroke direction from the position N = 1 corre-sponding to the mean angle of attack of α(t) = 30◦ to a position N = 8 corresponding to the angle of at-tack α(t) = 39.5◦, the location of vortex breakdown advances upstream rapidly. At N = 8 (α(t) = 39.5◦) elongated primary vortices Q+
s and Q−s demonstrate that the onset of vortex breakdown sheds forward in a short period of time. This type of vortex core phenomenon observed in each set of tests (a total of three sets) during the experiment were discussed by ¨Ozg¨oren (2000) in detail. The level of vorticity shown in Figures 4a and 4b in the experiment of the WP case is more or less equal to the level of vor-ticity shown in Figures 5a and 5b in the experiment of the WOP case. During the downstroke motion the onset of vortex breakdown is substantially re-tarded, i.e. it moves downstream. Moreover, this retardation process continues until the delta wing reaches an angle of attack of α(t) = 30◦in the up-stroke motion. In the image N = 1 in Figure 5a, the peak values of vorticity in the vortex breakdown
re-gion are dramatically reduced since onset of vortex breakdown location moves further downstream. The results in Figure 5a indicate that the diameter of the cross section of the vortex core is smaller when the impingement plate is removed from the flow field.
Instantaneous velocity distributions
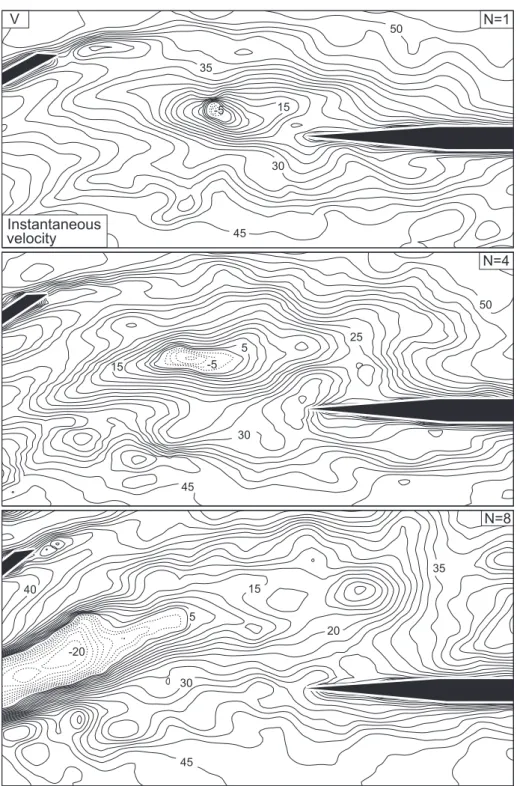
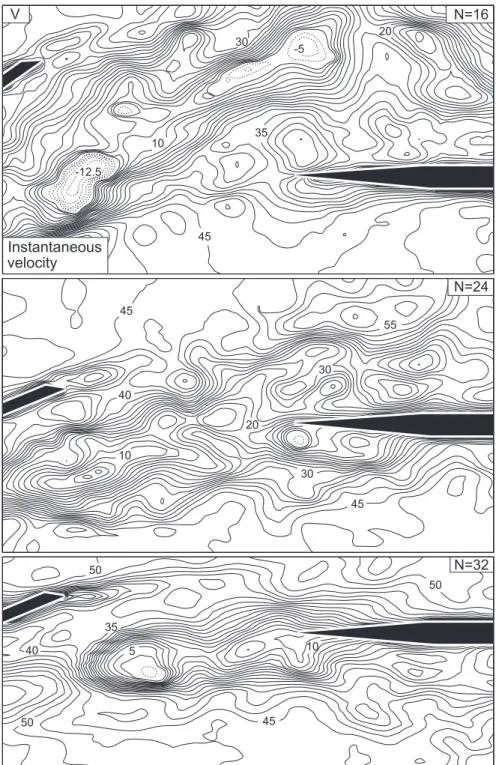
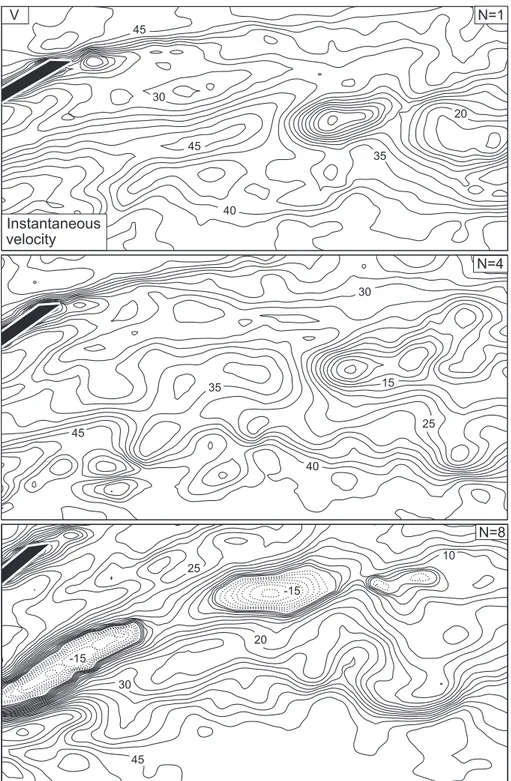
Contours of instantaneous velocity (magnitudes of velocity vectors) distributions in the vicinity of a vortex core region as a function of a pitching angle of attack, αm = 30◦, are shown in Figures 6 and 7 for the WP and WOP cases, respectively. Numbers on the contours correspond to velocity in mm/s; in-cremental value between the contours is 2.5 mm/s. The solid line represents positive instantaneous con-stant velocity distributions and the dashed line rep-resents negative instantaneous constant velocity dis-tributions that are in the opposite direction of pos-itive velocity. The nominal angle of attack of delta wing is αm= 30◦and amplitude of perturbation an-gle of attack of the delta wing is αo= 10◦. The top image in Figure 6a indicates that during the upstroke motion of delta wing at αm = 30◦ negative velocity region occurs at Xvb = C. The decay of the instan-taneous velocity of V prior to the onset of vortex breakdown is relatively mild. This negative veloc-ity core region, in which appears downstream of on-set of vortex breakdown, advances upstream rapidly during the upstroke motion of the vortex core axis. The final image in Figure 6a indicates that overshoot of vortex breakdown occurs causing a large area of negative velocity. In image N = 16 in Figure 6b wake-type the flow dominates the large area of the flow field. Here, instantaneous velocity is presented to indicate a magnitude of wakeflow regions and to also show the non-uniformity of local velocity distri-bution in the entire flow field. Images N = 24 and 32 in Figure 6b clearly indicate that the size of area illustrating the non-uniform velocity distribution is reduced during the downstroke motion of the vortex core axis relative to the pitching motion of the delta wing. Image N = 32 in Figure 6b illustrates the onset of vortex breakdown location quite well, al-though one frame of instantaneous velocity is used. It is worth mentioning that there is no possibility to present averaged velocity contours due to the pitch-ing motion of the delta wpitch-ing. This motion changes flow properties locally in each instant of time. Sim-ilar results are also presented in Figures 7a and 7b for the WOP experiment. In general, the distribu-tion of local velocity contours in the absence of the
impingement plate is the same as the distribution of velocity contours in the presence of the impinge-ment plate. The image of N = 16 in Figure 7b shows that the negative velocity occupies a larger area com-pared to the WP cases shown in Figure 6a. As seen
in images 8 and 16 in Figures 5a and 5b, primary vortices have elongated geometrical shapes that lay throughout the flow field causing reversed flow. The identical data shown in the top image in Figure 7b is presented in Figure 8 as distributions of velocity
45 30 35 15 5 20 40 N=8 -20 45 50 30 5 25 15 N=4 -5 45 30 15 50 35 N=1 velocity Instantaneous V -5
Figure 6a. Contours of constant instantaneous velocity V for the case of the delta wing subjected to a high-amplitude oscillation at period Te = 22.54 s.
45 10 50 40 50 50 5 35 N=32 20 40 30 45 10 45 30 55 N=24 45 10 35 30 20 N=16 V velocity Instantaneous -12.5 -5
Figure 6b. Contours of constant instantaneous velocity V for the case of the delta wing subjected to a high-amplitude oscillation at period Te = 22.54 s.
vectors. During the overshoot flow process, a high rate of flow circulation occurs along the wake flow axis shown in this figure.
Concluding Remarks
At higher angles of attack ranging from 10◦ to 40◦, dimensionless vortex breakdown locations from the apex of the delta wing X∗vb yield larger hysteresis
loops with α (t). The size of these hysteresis loops decrease with decreasing angles of attack ranging from α = 40◦to α = 10◦. Time-dependent vortex-core formation and breakdown may apply
aerody-namic loads on the plate. These aerodyaerody-namic loads may interact with the plate structural response caus-ing aeroelastic instability. Atta and Rockwell (1990) stated that the timing of vortex development relative
45 30 20 10 25 N=8 -15 -15 40 25 15 30 35 45 N=4 30 45 35 20 40 45 N=1 V velocityInstantaneous
Figure 7a. Contours of constant instantaneous velocity V for the case of the delta wing subjected to a high-amplitude oscillation at period Te = 22.54 s.
40 40 25 5 60 N=32 45 40 20 30 15 10 N=24 -5 -15 45 35 5 25 20 40 -25 -10 velocityInstantaneous V N=16
Figure 7b. Contours of constant instantaneous velocity V for the case of the delta wing subjected to a high-amplitude oscillation at period Te = 22.54 s.
to the delta wing position is a strong function of the reduced frequency. As a consequence of the phase shift associated with the vortex development during the pitching delta wing motion relative to that
oc-curing for the stationary delta wing, the nearest lo-cation of vortex breakdown to the apex occurs near the maximum angle of attack of the delta wing in the upstroke pitching motion. Structures of the
vor-V
velocity Instantaneous
N=16
Figure 8. Distributions of instantaneous velocity vectors for the case of the delta wing subjected to a high-amplitude oscillation at period Te = 22.54 s.
tex core as a whole take a variety of forms strongly dictated by the pitching motion of the the delta wing. During the upstroke motion of the vortex core axis, the onset of vortex breakdown overshoots rapidly to-wards the apex of the delta wing. When the position of the onset of vortex breakdown is stable, the break-down occurs in a bubble mode. During the break- down-stroke motion of the delta wing, after a short while the vortex core axis also moves downward causing re-tardation of vortex breakdown. At this instant, the onset of vortex breakdown moves downstream in a classical spiral mode. Once the location of the break-down is stable, it switches from spiral mode to the bubble mode randomly or visa versa. These observa-tions are seen in the experiments of mean angles of attack αm= 20◦, 24◦and 30◦ for the WP and WOP cases. An offset occurs between the central axis of the vortex core and the instantaneous position of the pitching delta wing. Since the reduced frequency is quite high, a substantial hysteresis occurs in the plot of Xvb/C against α(t) at a reduced frequency of K = 0.74. The instantaneous velocity contours indicate that velocity distributions vary throughout the en-tire image as a function of pitching angle of attack of the delta wing. They give further information on the development of the primary vortices. During the
overshoot of onset of vortex breakdown negative ve-locity distributions occupy a large range of area in close regions of the trailing edge of the delta wing.
Acknowledgment
The authors would like to thank Professor D. Rockwell for letting them carry out this exper-imental study at the Fluid Mechanics Laboratory of Lehigh University, USA, and for his many valuable discussions and suggestions on this topic.
Nomenclature
C : chord of delta wing (mm)
fe : oscillation frequency (Hz), fe= 1/Te K : dimensionless reduced frequency,
K = πfeC/ U∞
L : distance between trailing edge of the delta wing and leading edge of the plate (mm) Lp : length of the plate (mm)
T : time (s)
t∗ : dimensionless time t∗ = tU∞/C Re : Reynolds number, Re = U∞C/ν Te : period of oscillation (s)
tp : thickness of the plate (mm) tw : thickness of the delta wing (mm) U∞ : free stream velocity (mm/s)
V : instantaneous total velocity (mm/s) Vb : vortex breakdown
Xvb : vortex breakdown location from the apex of the delta wing (mm)
X∗vb : dimensionless vortex breakdown loca-tion from the apex of the delta wing
Y : vertical distance (mm) ω : instantaneous vorticity (1/s) ω e : angular frequency (Hz), 2πfe α : static angle of attack (◦) α m : mean angle of attack (◦) α o : amplitude of perturbation (◦) α (t) : dynamic angle of attack (◦) ∆ t : time interval (s)
Λ : sweep angle of the delta wing (◦)
References
Akıllı, H., S¸ahin, B. and Rockwell, D., “Control of Vortex Breakdown by a Transversely Oriented Wire”, Physics of Fluids, 2(13), 452-463, 2001. Atlee, M., Cunningham, J.R. and Todd, B., “Steady and Unsteady Force Testing of Fighter Aircraft Models in a Water Tunnel”, AIAA Journal, 98-2815, 222-237, 1998.
Atta, R. and Rockwell, D., “Leading Edge Vortices due to Low Reynolds Number Flow Past a Pitching Delta Wing”, AIAA Journal, 2(6), 995-1004, 1990. Escudier, M., “Vortex Breakdown Observations and Explanations”, Prog. Aerospace Sci. 25,189-229, 1988.
Faler, J.H. and Leibovich, S., “Disrupted States of Vortex Flow and Vortex Breakdown”, Physics of Fluids, 20(9), 1385-1400, 1977.
Gad el-Hak, M. and Ho, C-M., “The Pitching Delta Wing”, AIAA Journal, 23(11), 1660-1665, 1985. Gad el-Hak, M. and Blackwelder, R.F., “Control of the Discrete Vortices from a Delta Wing”, AIAA Journal, 25(8), 1042-1049, 1987.
Gordnier, R.E., and Visbal, M.R., “Instabilities in the Shear Layer of Delta Wings”, AIAA Paper 95-2281, 26th AIAA Fluid Dynamics Conference, San
Diego, CA, June 19-22, 1995.
Hall, M.G., “Vortex Breakdown”, Annual Review of Fluid Mechanics, 4, 195-218, 1972.
Hammand, D., and Redekopp, L.G., “Global Dy-namics and Flow Vectoring in Asymmetric Wakes”, AIAA Paper 94-2219, 25th AIAA Fluid
Dynam-ics Conference, Colorado Springs, CO, June 20-23, 1994.
Huang, G.H., Wang, Y.M. and Cao, G.X., “The Mechanism of Aerodynamic Hysteresis for Sinu-soidally Delta Wing”, Science in China (Series A), 37(11), 1337-1346, 1994.
Lamburne, N.C. and Biyer, D.W., “The Bursting of Leading Edge Vortices Some Observations and Discussion of Phenomenon”, Aerodynamic Division NPL, ARC, U.K, Report and Memoranda 3232, 1961.
Lee, M. and Ho, C.M., “Lift Force of Delta Wings”, Applied Mech. Rev, 43(9), 209-221, 1990.
Leiboivich, S., “The Structure of Vortex Break-down”, Annual Review of Fluid Mechanics, 10, 221-246, 1978.
Leiboivich, S., “Vortex Stability and Breakdown: Survey and Extension”, AIAA Journal, 22, 1192-06, 1983.
Lemay, S.P., Batill, S.M. and Nelson, R.C., “Vortex Dynamics on a Pitching Delta Wing”, J. Aircraft, 27(2), 131-138, 1990.
McCormick, S. and G¨ursul, I., “Effect of Shear Layer Control on Leading Edge Vortices”, AIAA 96-0541, 34th Aerospace Sciences Meeting of Exhibit, Reno, NH. 1996.
Mitchell, A.M. and Delery, J., “Research into Vor-tex Breakdown Control”, Progress in Aerospace Sci-ences, 37, 385-418, 2001.
Negro, O.L. and Doherty, T.O., “Vortex Break-down: a Review”, Progress in Energy and Combus-tion Science, 27, 431-481, 2001.
¨
Ozg¨oren, M., “Impingement of Vortex Breakdown upon an Edge: Flow Structure and Origin of Load-ing”, Ph.D. Thesis, C¸ .U., Institute of Natural and Applied Sciences, Adana, Turkey, 2000.
¨
Ozg¨oren, M., S¸ahin, B. and Rockwell, D., “Vortex Breakdown From a Pitching Delta Wing Incident upon a Plate: Flow Structure as the Origin of Buf-fet Loading”, J. Fluids and Structures, (Accepted for publication), 2001a.
¨
Ozg¨oren, M., S¸ahin, B. and Rockwell, D., “Struc-ture of Leading Edge Vortices on a Delta Wing at High Angle of Attack,” AIAA Journal, (Accepted for publication), 2001b.
Rockwell, D., “Vortex-Body Interactions”, Annu. Rev. Fluid Mech., 30, 199-229, 1998.
Sarpkaya, T., “On Stationary and Traveling Vortex Breakdowns”, J. Fluid Mech., 45(3), 545-559, 1971.
Shih, C. and Ho, C.M., “Vorticity Balance and Time Scales of a Two-Dimensional Airfoil in an Unsteady Free Stream”, Physics of Fluids, 6(2), 710-723, 1994. Shih, C. Lourenco L.M. and Krothapalli, A., “In-vestigation of Flow at Leading and Trailing Edges
of Pitching-up Airfoil”, AIAA Journal, 33(8), 1369-1376, 1995.
S¸ahin, B., Akıllı, H, Lin, J. -C. and Rockwell, D., “Vortex Breakdown-Edge Interaction: Consequence of Edge Oscillations”, AIAA Journal, 39(7), 2001.